Safety Advisory and Transportation Committee Briefing
|
|
|
- Nelson Henderson
- 5 years ago
- Views:
Transcription

1 ATTACHMENT #1 Regular SA&T meeting of 02/27/2007 Safety Advisory and Transportation Committee Briefing February 27, 2007
2 AGENDA Overview of Norfolk Southern Railway Company Formation and organization of the subsidiary Delaware Business Unit (DBU) Railroad safety Hazardous materials transportation by railroad

3

4

5

6
7 Since 1980, U.S. Class I railroads have spent $340 billion on track and equipment. Capital Expenditures and Maintenance Expenses, Excluding Depreciation, in Billions of Dollars Equipment Track & Structures Sources: AAR, Analysis of Class I Railroads, , based on R-1 Reports submitted by each Class I railroad to the ICC/STB. Equipment: Lines Track: Lines Note: Current year dollars.
8 Since 1991, U.S. Class I railroads have accelerated capital spending on new rail. Billions of Current Dollars Capital Expenditures on Rail Operating Expenses for Rail & Other Track Material Source: R-1 Reports submitted by each Class I railroad to the ICC/STB, Schedule 330, line 8, column e; Schedule 410, lines 1, 14, and 15, column h.
9 Delmarva Business Unit Created in 2006 NS Eastern North Carolina parallels Capital budget challenges Amtrak Northeast Corridor Track Gateway Improved localized management
10 U.S. Railroad Safety Statistics: Main Themes Railroads have dramatically improved safety over the last two and a half decades. Railroads compare favorably with other industries & transportation modes. The most troubling railroad safety problems arise from factors largely outside railroad control. Railroads have implemented numerous and effective technological improvements and company-wide safety programs.
11 Derailments per million train-miles have dropped 65% since 1980 and 12% since Sources: FRA website: & r02.htm (preliminary 2004 data) FRA, Railroad Safety Statistics Annual Report, , Tables 1-1, 5-6. FRA, Accident/Incident Bulletin, , Tables 19, 36. Note: Excludes grade crossing accidents.
12 Train accidents per million train-miles have dropped 62% since 1980 and 8% since Sources: FRA website: (preliminary 2004 data). FRA, Railroad Safety Statistics Annual Report, , Tables 1-1, 1-2. FRA, Accident/Incident Bulletin, , Tables 19, 36. Note: Excludes grade crossing accidents.
13 Human factors-caused accidents per million train-miles have dropped 46% since 1980 and 3% since Sources: FRA website: & r02.htm (preliminary 2004 data) FRA, Railroad Safety Statistics Annual Report, , Tables 1-1, 5-9. FRA, Accident/Incident Bulletin, , Tables 19, 36. Note: Excludes grade crossing accidents.
14 Accidents with a hazmat release have declined 76% since 1980 and 17% since Train Accidents with a Hazmat Release Sources: FRA, RR Safety Statistics Annual Report, , Tables 6-1. FRA, Accident/Incident Bulletin, Table 26. Note: An accident may involve releases from more than one car. AAR Analysis of FRA Train Accident Database through 2004.
15 Railroad Industry Safety Programs: Hazardous Materials AAR North American Non-Accident Release (NAR) Program Transportation & Community Awareness & Emergency Response (TRANSCAER) ACC Responsible Care Operation Respond TTCI's Emergency Response Training Center TTCI's BOE Hazmat Inspections TTCI's BOE Hazmat Safety Information
16 Hazmat incident release rates have declined 72% since 1980 and 58% since Incidents per Thousand Hazmat Carloads % Incident Free Sources: USDOT, Pipeline & Hazardous Materials Safety Administration, Hazardous Materials Incidents by Year & Mode. for Includes releases in train accidents as well as non-accident releases. ICC/STB Waybill Sample Carloadings adjusted to counter known hazmat underreportings of hazmat designations.
17 Railroads now have less than 1/4 of the hazmat accidents that trucks have, despite roughly equal hazmat ton-mileage Truck Railroad Sources: USDOT, Pipeline & Hazardous Materials Safety Administration, Hazardous Materials Incidents by Year & Mode, from 11/14/2005 In 2003, both the truck and rail modes hauled an estimated 110 billion ton-miles of hazmat.
18 Grade crossing collisions have declined 71% since 1980 and 46% since ,000 10,000 10,611 8,000 6,000 4,000 2,000 5,715 3, Sources: FRA, Railroad Safety Statistics Annual Report, , Table 1-1. FRA Highway/Rail Crossing Accident/Incident & Inventory Bulletin,Table S, FRA website: (preliminary 2004 data) Note: Includes accidents involving pedestrians. Includes accidents at private crossings.
19 In 2004, 94% of rail-related fatalities were grade crossing users and trespassers. Trespassers: 482 Grade Crossing Users: 364 Passengers: 3 Employees: 25 Others: 24 Sources: FRA website: (preliminary 2004 data). FRA, Railroad Safety Statistics Annual Report 2004, Table 1-3.
20 Railroad Security After the 9/11 terrorist attacks, the AAR & its member railroads voluntarily conducted a comprehensive risk assessment and implemented a security action plan with four alert levels. The Security Plan encompasses over 1,300 critical facilities (tunnels, bridges, yards, dispatch centers, etc.) over a 142,000-mile nationwide rail network. The plan evolves in response to classified information obtained through DHS and FBI. DHS has cited this plan as a model for other U.S. industries.
21 Railroad Security: Countermeasures include: Employee and customer awareness and training: e.g. to thwart terrorist intelligence gathering, facilitate warning & recovery. Sharing of Intelligence on Threats: AAR Operations Center (24/7) collects, evaluates, and disseminates information to railroads thru the Railway Alert Network (RAN) The Surface Transportation Information Sharing & Analysis Center (ST- ISAC) collects, analyzes, and disseminates information on physical and cyber-security threats to providers and users of surface transportation. Vetting employees & contractors. Controlling access to critical facilities and shipment info. Securing communications and data and ensuring message integrity and best IT practices.
22 Security and Hazmats Municipal legislation on routing 2006 DOT DHS TIH Security Action Items for Railroads 2006 TSA and FRA Railroad inspectors for verification of compliance 2007 DHS TSA notice of action on TIH routes
23 Railroads have lower employee injury rates than do other major industry groups. Lost Workday Injuries & Illnesses per 100 Full Time Employees, RAILROADS Hotels Grocery Stores Construction Manufacturing Agriculture Source: Bureau of Labor Statistics, Department Stores


24
25 ATTACHMENT #2 Regular SA&T meeting of 02/27/2007
26
27
28
29
30
31
32
33
34
35

36 ATTACHMENT #3 Regular SA&T meeting of 02/27/2007 Why Sprinkle townhouses In line with the Cities proactive approach of fire protection. Improves the overall image of the city Fire determination made easier Meets the Cities mission statement of having a safe City.
37 Benefits to the public 5 to 10 percent discount on homeowners insurance. Faster recovery for fire victims. Fewer displaced families and less of a drain on support services. No standby fees for fire protection water. Allows the City to make amends and trade off for new construction
38 Benefits to the public Fire protection remains intact even if the property is sold or the occupant changes Increases the survivability of the occupant. Less potential for the loss of family heirlooms and personal belongings. Protection from fire spread from other units. Assists individuals unable to initiate self preservation in surviving a fire.
39 Benefits to the public Even when you are not at home the Sprinkler System will be. Ready to stop the fire and alert the Fire Department at a moments notice. Yes, there is a cost, but for the peace of mind that the Sprinkler System gives us knowing that our home is protected, it s more than worth it.
40 Why Sprinkle Townhouses? Good Fire Protection Early detection and suppression. Incorporates Technology as part of the Cities Fire protection program. Less in service time for the Fire Department. Reduces the hazards to the Firefighters. Reduces Firefighting costs. Helps maintain a volunteer Fire Department.
41 Other considerations Sprinkler systems need to be installed during construction. Cost of installation ranges from $2.00 to $2.25 per square foot. Equal to or less than installing carpet in the same area
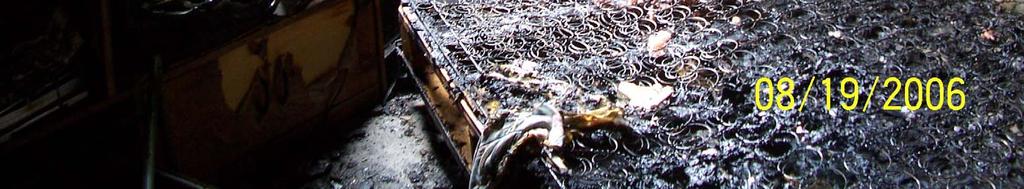
42 Less Fire Damage There is far less damage in the homes with sprinklers! Average fire loss with sprinkler activation, $2,166 Average fire loss without sprinkler activation, $45,019


43 Communities that currently sprinkle townhouses Newark, Delaware Camden, Delaware Silver Lake Blvd. Dover City of New Castle, Delaware Belfonte, Delaware Beach area.


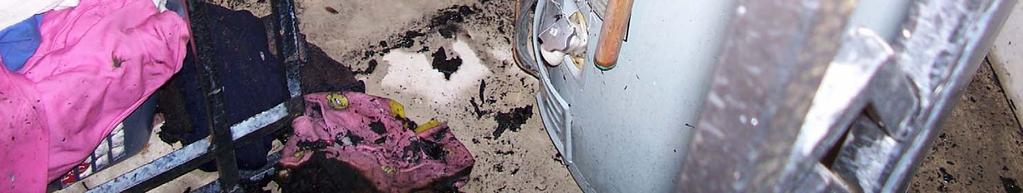
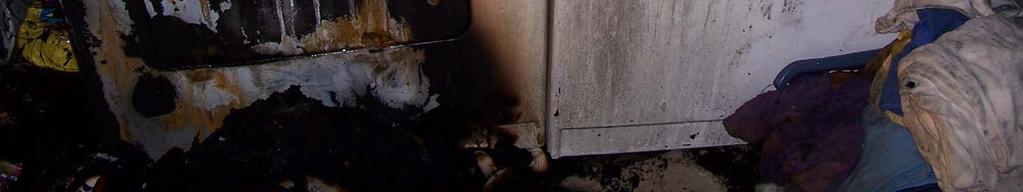
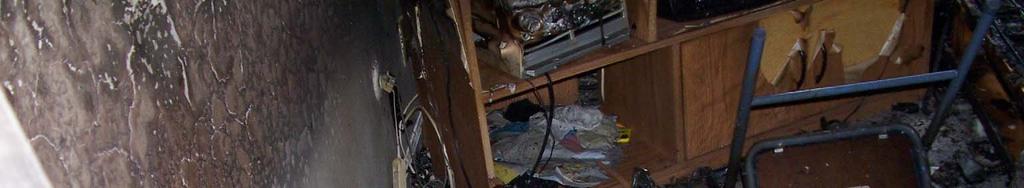
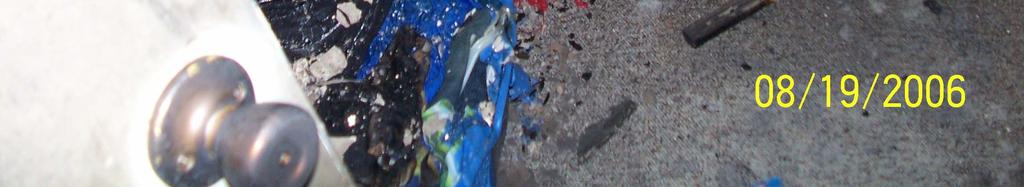
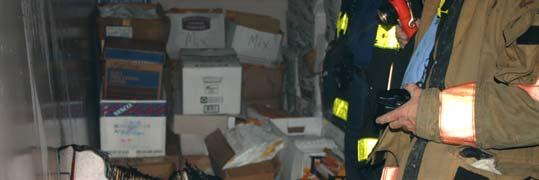
44 Why do we sprinkler To avoid this buildings? And this!


45


46


47


48


49


50


51


52


53

54


55