Infrastructure Investments Enhance Economic Activity
|
|
|
- Earl Baker
- 5 years ago
- Views:
Transcription


1 Infrastructure Investments Enhance Economic Activity National Association of Legislative Fiscal Offices 2013 Fiscal Analysts Seminar Jason Powell October 8, 2013
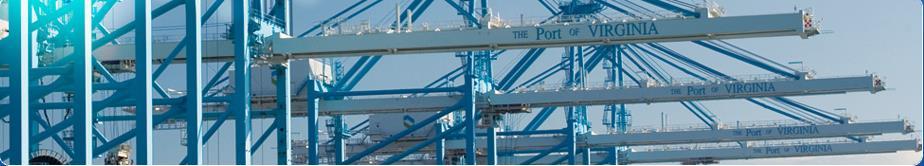
2 Virginia s Multimodal Transportation System: Air, Land, Sea and Space Department of Transportation 126,529 lane miles 19,381 bridges and structures 7 tunnels 2 toll facilities 51 rest areas / welcome centers 114 commuter parking lots Virginia Port Authority 7 commercial facilities 2.1 million TEUs $ 41 billion economic impact $ 1.2 billion local taxes 343,000 jobs Department of Rail and Public Transportation 193 million passenger trips 178 million tons of freight 27,000 jobs Department of Motor Vehicles $ 2.1 billion revenue 5.5 million licensed drivers 7.8 million vehicle registrations 74 customer service centers 13 weigh stations 2,000 jobs FY14 Appropriation $4.9 billion Motor Vehicle Dealer Board 4,439 automobile dealers Population 8.1 million Commercial Spaceflight Authority 2 launch pads 2 completed COTS launches 8 scheduled COTS launches 19,000 licensed salespersons Department of Aviation 66 public airports 49 million passenger trips 3,400 registered aircraft 259,000 jobs 2

3 Virginia s Port-folio 3
 APM Terminals (APMT) in Hampton Roads NNMT \" \" APMT \" \" NIT")
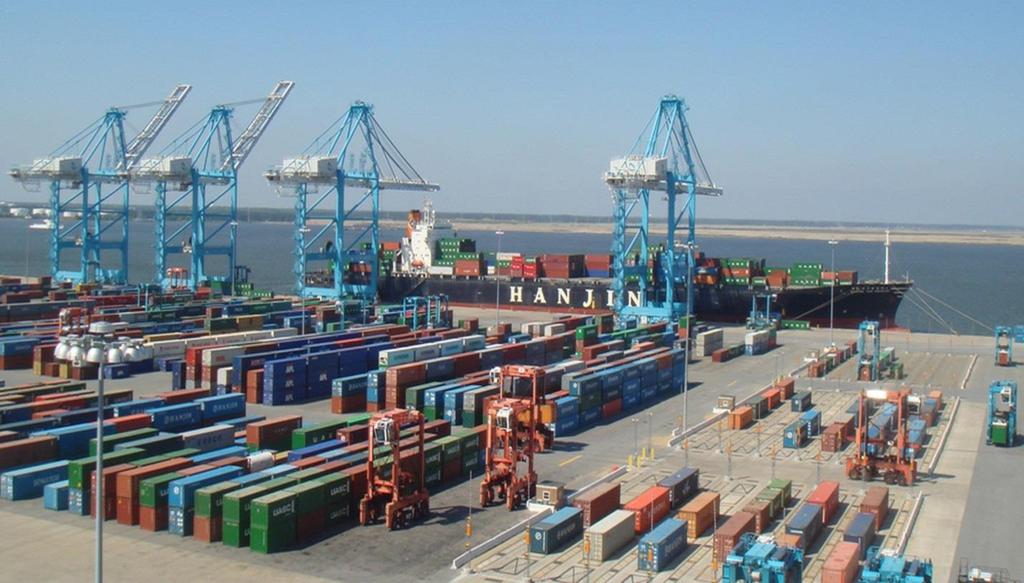
4 Three Major Container Terminals Norfolk International Terminal (NIT) Newport News Marine Terminal (NNMT) APM Terminals (APMT) in Hampton Roads NNMT " " APMT " " NIT 4

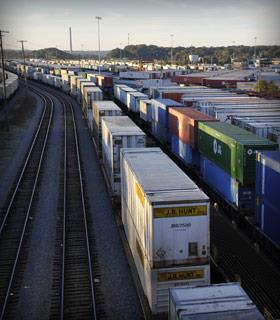
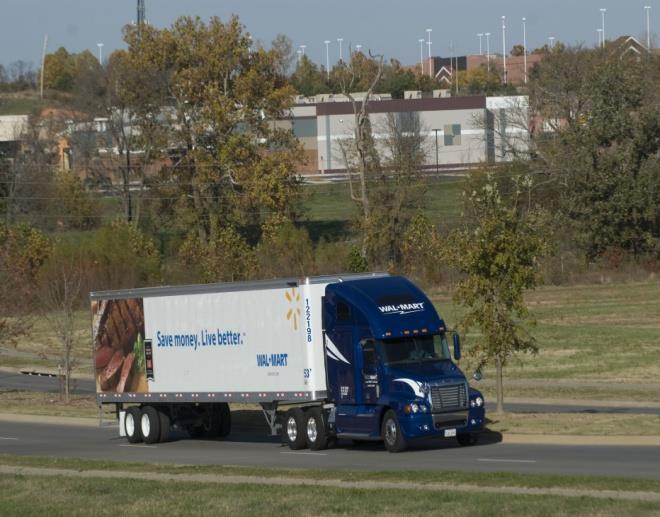
5 Mid Atlantic U.S. Location The Port of Virginia is within a day s drive of two-thirds of the U.S. population. Containers moving in and out of the port are transported: 64 percent by truck, 32 percent by rail, and 4 percent by barge. 5

6 Port Facilities Geographically Aligned with Retail Distribution Center Network 6
7 Top 10 U.S. East Coast Container Ports 2012 TEUs East Coast Market Share New York/New Jersey 5,529,913 33% Savannah 2,966,217 18% Virginia 2,105,887 13% Charleston 1,514,590 9% Miami 926,180 6% Port Everglades 923,009 6% Jacksonville 909,197 6% Baltimore 678,262 4% Wilmington, NC 270,792 2% Philadelphia 267,377 2% Approximately $63b in commodities move through the Port. - 45% Import and 55% Export by tonnage. 7


.")
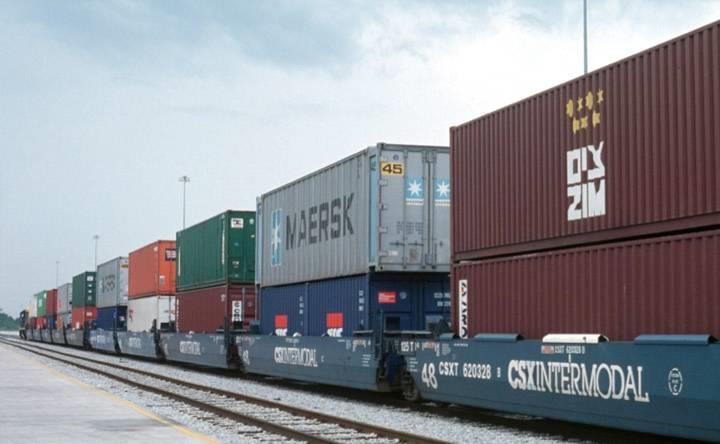
8 TEU What Is It? 20 One 20 container = 1 TEU 40 One 40 container = 2 TEU 53 Port capacity and productivity is often Measured in TEUs. TEU Stands for Twenty Foot Equivalent Unit. Original containers were 20 feet long, 8 feet wide, and 8 feet high. Today, most cargo is moved in 40 foot containers (2 TEUs). For tax credit purposes, payout is by TEU. 40 s or larger count at 2 TEUs for tax credit. Typical over the road truck 8
9 Port of Virginia Historical TEUs (Twenty-foot Equivalent Units) 2,000,000 1,500,000 1,000, , *2013 Projected based on YTD performance through July 9
10 Top Ten Commodities (by total tonnage) EXPORTS IMPORTS Mineral Fuel, Oil Grain, Seed, Fruit Wood Pulp Animal Feed Wood Mixed Metal Plastic Paper & Paperboard Cereals Organic Chemicals Machinery Furniture Salt, Sulfur, Earth, Stone Beverages Vehicles Fertilizer Fuels Rubber Paper & Paperboard Wood 10
11 Top Ten Trading Partners (by total tonnage) EXPORT IMPORT Italy Netherlands Brazil India Turkey China United Kingdom France South Korea Germany China Brazil Germany India Italy Turkey France Trinidad & Tobago Japan Canada 11
12 Virginia Container Terminals Fared Worse During Recession but Recovered Quickly 30 % 20 Va. Container Terminals 10 0 Savannah NY/NJ Port of Virginia

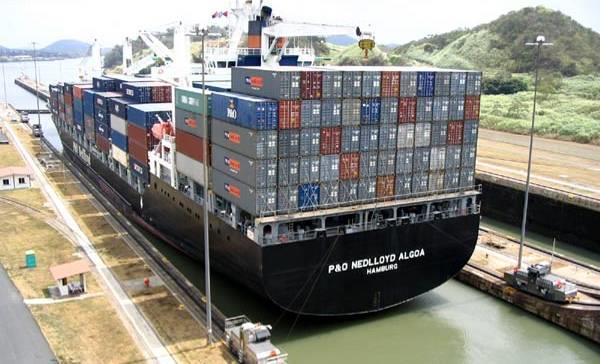
13 Expansion of the Panama Canal Presents a Unique Window of Opportunity $5.25 billion capital investment program to modernize and improve the Panama Canal. Channel deepening began in Redesign a third set of locks. Expected completion in The expansion will double capacity, and allow more and larger ships to transit the canal. This will open the east coast to direct traffic from India, Asia and China, creating demand for port facilities along the eastern seaboard. Ports from Miami to New York are considering renovations including dredging, blasting and bridge raising to be able to handle post-panamax ships. 13

 12.")
 Will Accommodate Post-Panamax Vessels")
14 Panama Canal Expansion - New Locks Will Accommodate Post-Panamax Vessels Existing Locks Max Vessel size: 4,400 TEU s 12.4 m (39.5 ) 32.3 m (106 ) 12.8 m (42 ) 49 m (160 ) New Locks 18.3 m (60 ) Will Accommodate Post-Panamax Vessels 15.2 m (50 ) New Locks Max Vessel size: 12,600 TEU s 14
 Baltimore Norfolk 4,500 TEU 45 ft. 50 ft. 8,500 TEU 12,500+ TEU Norfolk 55 ft.")
15 Comparison of U.S. East Coast Competitive Ports Water Depth Jacksonville 38 ft. Wilmington, NC Savannah 42 ft. Charleston NY/NJ (2012) Baltimore Norfolk 4,500 TEU 45 ft. 50 ft. 8,500 TEU 12,500+ TEU Norfolk 55 ft. (authorized) 15


16 Canal Expansion Will Increase Business Only East Coast port with channels deep enough to accommodate these vessels fully loaded. Only East Coast port with all improvements in place to handle these vessels now. 50 foot harbor depth (authorized to go to 55 ) and no overhead obstructions provide Virginia with an opportunity to draw traffic before other east coast ports can accommodate them. Lowest Cost Area After 2015 Lowest Cost Area Today 16
17 Why make the investment? Virginia s Port infrastructure investments are targeted at reducing the amount of time freight moves from production to consumption. Capital asset investment Channel depth Dockside operations Landside logistics Incentive programs 17
18 How Virginia s Port is funded The Virginia Port Authority receives a 4.2% share of revenues of Virginia s Transportation Trust Fund approximately $33 million annually. Statutorily dedicated to the Commonwealth Port Fund (CPF). Public sources including federal funds- account for about 26% of annual revenues. Remaining 74% comes from business operations. Public revenue sources are used to pay for major capital projects, maintain the state-owned terminal facilities, provide aid to local ports, and reimburse local governments in lieu of property taxes. Additionally, the Port Authority receives $1.0 million in GF for payments in lieu of taxes and an additional $1.0 million GF to fund economic incentive grant payments (effective FY 2014). 18
19 Overview of Port Appropriations Fiscal Year FY2009 FY2010 FY2011 FY2012 FY2013 FY2014 Special Fund $ 65,048,693 $ 64,481,147 $ 64,541,372 $ 113,191,372 $ 105,389,932 $108,586,537 Commonwealth Port Fund 9,960,080 22,042,750 22,042,750 22,042,750 33,653,024 33,656,419 General Fund & Other 950, , , ,000 3,950,000 4,950,000 Total 75,958,773 86,880,642 87,534, ,184, ,992, ,192,956 19
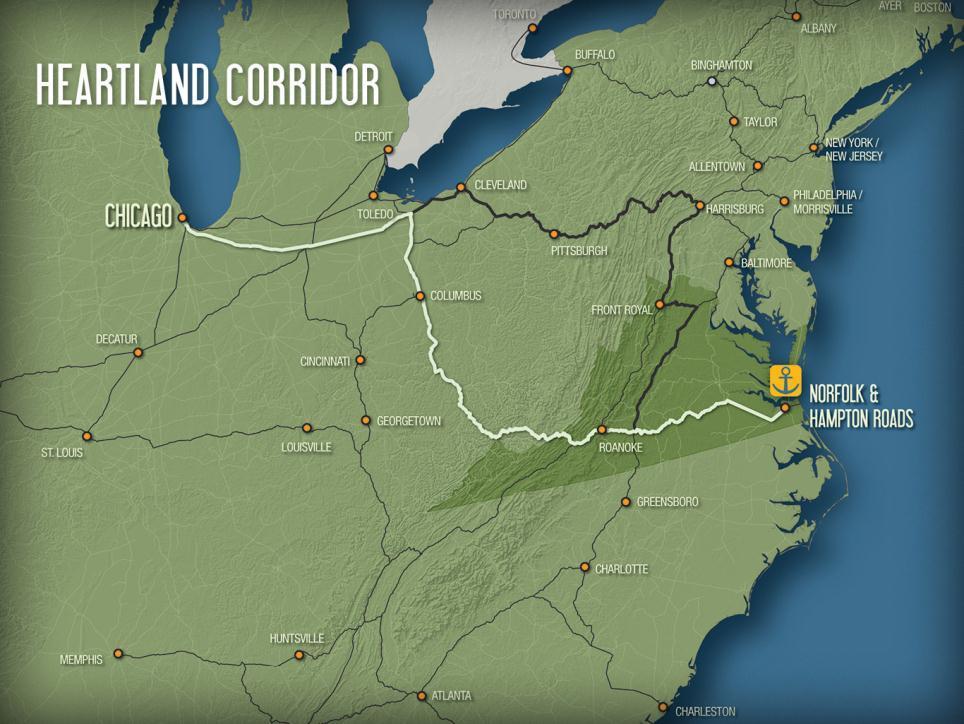
20 Investments in Freight Rail Capacity Improves Throughput Virginia has invested over $100 million in freight rail capacity expansion projects targeted at improving Port access. On-dock rail at container facilities Rt. 164 Median Rail Norfolk Southern Heartland Corridor CSX National Gateway Projects Goal is to create more efficient rail routes, linking Mid- Atlantic ports with Midwestern markets, through track upgrades, signals, and tunnel clearance allowing double-stack intermodal. Increase rail volume by increasing use of double-stack trains. Enhance Virginia s market access potential - increases Port s market access by 141% (from 22 to 53 million people). Reduce highway congestion. Reduce costs for road maintenance and logistics. Reduce greenhouse gas emissions and helps improve air quality. 20


21 Landside Logistics Increase Port Throughput With Conventional Lift-on/Lift-off Intermodal Technology, containers and truck chassis are lifted on to and off of rail cars using overhead cranes, top picks and/or fork lifts. Service is limited to containers, containers on truck chassis, and dry van chassis and trucks. Intermodal Container Dry Van Dry Van 21


22 APM Terminals Dual Rail Access On-dock rail: 40 acre yard, 6 rail tracks. Expandable to 12 as intermodal freight demand increases. 22

23 NIT Central Rail Yard 12 new on-dock rail lines, doubles capacity of existing rail yard. 23

24 Commonwealth Median Rail Line Second track provides a parallel connection to APM Terminal; improves rail capacity and efficiency. Unencumbered rail connections provide connectivity to both the Heartland Corridor and the National Gateway. 24
25 25

26 The Heartland Corridor New route is double-stack and eliminates more than 230 miles. Opened Sept
27 27

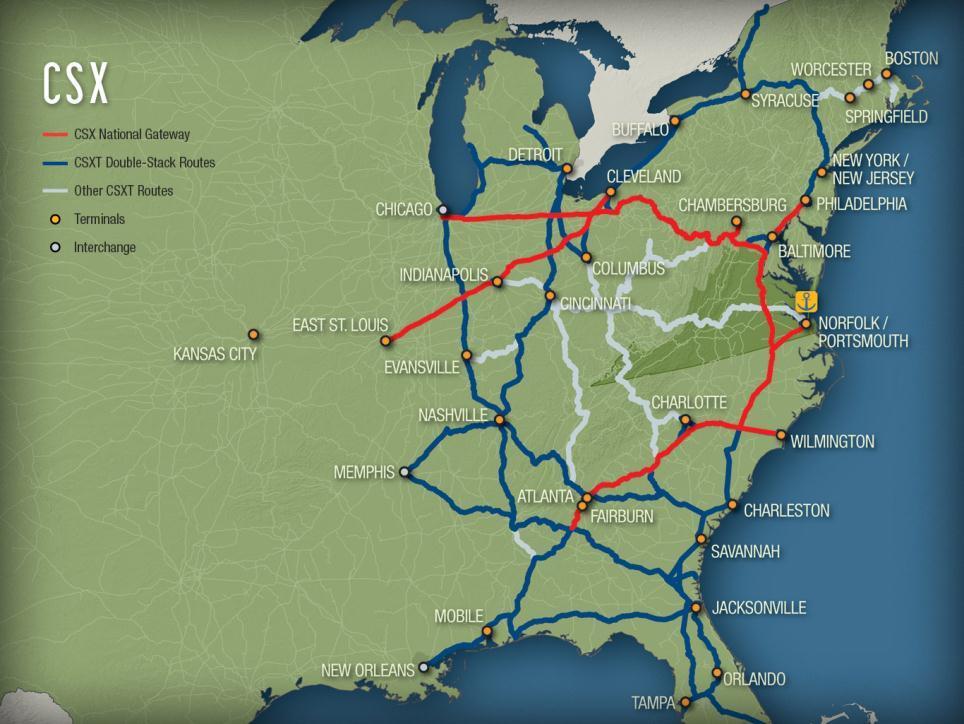
28 The National Gateway Connects Norfolk to the Midwest and beyond. St Louis Chicago Columbus Pittsburgh Norfolk NY/NJ/PA NW Ohio Transfer Yard enables CSX service to new major markets. Memphis Birmingham Atlanta Expedites traffic through Chicago and St. Louis gateways. New Orleans Tampa Jacksonville CSX National Gateway CSXT double stack routes Other CSXT routes Miami 28

29 Norfolk Southern Greensboro Rail Service 29

30 Route 460 Improving Port Access NNMT Naval Station Norfolk Isle of Wight Craney Island NIT Norfolk Proposed 460 Relocation APMT PMT Portsmouth Shirley T. Holland Intermodal Park Suffolk Chesapeake 30
31 Port Incentive Programs Focus on Increasing Volume and Distributor Clusters A variety of Port incentive programs are available to companies that: Have Virginia income tax liability, and Move cargo through public or private terminals in Virginia. The current offerings include both corporate income tax credits as well as grant programs. Award metrics include both increases in total tonnage and job creation. Statutory sunsets and liability caps with carry forward available to users. 31
32 Tax Incentive Programs Port Volume Increase Entities that increase volume through public or private maritime port facilities in Virginia by 5% in a single year over a base year. Credit is $50 per TEU Available for tax years 2011 through 2017 (5 year carry forward). $3.2 million available each calendar year. Can also be used for a major facility located in VA and projected to import/export cargo in excess of 25,000 TEUs in the first year. Cap is generally 250,000 per taxpayer (can receive more then the cap if money is left over or less if oversubscribed). Barge & Rail Use Entities that use barge or rail to move cargo rather than by truck. Credit is $25 per TEU Demonstrate that the cargo could or has moved by truck in the past but the decision was made to use rail or barge. Available for tax years 2011 through 2017 (5 year carry forward). $1.5 million available for each fiscal year. No specified cap per tax. Taxpayer does not receive more if there is more money left in the pot but could receive less if oversubscribed. International Trade Facility Entities either creating new jobs or making capital investments in an international trade facility as result of moving 10% more cargo through a VPA cargo facility than in the preceding taxable year. Credit is either $3,500 per full time employee or 2% of capital investment. Available for tax years 2011 through 2017 (10 year carry forward). $250,000 available for each fiscal year. No cap but taxpayer can only receive up to 50% of its yearly tax liability. 32

33 Port of Virginia Economic & Infrastructure Development Zone Grant for port users new to or expanding in the Zone (dark green). - $1.0M GF appropriation provided July 1, Cash grant for jobs retained for at least three years. $1,000 per job for new jobs $1,500 per job for new jobs $2,000 per job for new jobs $3,000 per job for new jobs 33
34 Ensuring Value for Virginia s Investment Legislative Budget Authority and Policy Review funding, including federal and port terminal revenues are appropriated annually by the General Assembly to the Virginia Port Authority. Senate Finance Committee held a series of ad hoc public hearings in response to unsolicited proposal by APM to buy-out VPA operations in Auditor of Public Accounts reviews VPA SSA and incorporates into the Commonwealth CAFR. In addition to budget and financial reviews, Virginia s Joint Legislative Audit and Review Commission (JLARC) provides both special purpose and performance evaluations. Port Operations related to unsolicited PPTA (January 2013). Governance and market competitiveness (October 2013). 34
35 Contact Information Jason Powell Legislative Fiscal Analyst 35