Exit 61 to Exit 67 Corridor Study
|
|
|
- Jeffrey Rogers
- 5 years ago
- Views:
Transcription


1 Exit 61 to Exit 67 Corridor Study submitted to: The South Dakota Department of Transportation in conjunction with: City of Box Elder The Rapid City Area MPO and The Federal Highway Administration December 2017

2 INTERSTATE 90 EXIT 61 TO 67 CORRIDOR STUDY REPORT Prepared for: Prepared by: Felsburg Holt & Ullevig 6300 S. Syracuse Way, Suite 600 Centennial, CO / Project Managers: Lyle DeVries, PE, PTOE Todd Frisbie, PE, PTOE FHU Reference No December 2017
3 The preparation of this report has been financed in part through grant[s] from the Federal Highway Administration and Federal Transit Administration, U.S. Department of Transportation, under the Metropolitan Planning Program, Section 104(f) of Title 23, U.S. Code. The contents of this report do not necessarily reflect the official views or policy of the U.S. Department of Transportation. The South Dakota Department of Transportation (SDDOT) provides services without regard to race, color, gender, religion, national origin, age or disability, according to the provisions contained in SDCL 20-13, Title VI of the Civil Rights Act of 1964, the Rehabilitation Act of 1973, as amended, the Americans With Disabilities Act of 1990 and Executive Order 12898, Federal Actions to Address Environmental Justice in Minority Populations and Low-Income Populations, To request additional information on the SDDOT s Title VI/Nondiscrimination policy or to file a discrimination complaint, please contact the Department s Civil Rights Office at
4 TABLE OF CONTENTS EXECUTIVE SUMMARY ES INTRODUCTION Study Purpose and Background Study Area Study Process Needs and Solutions Analyses Public Involvement Environmental Study Oversight Planning Context and Prior Studies EXISTING CONDITIONS Roadway Network Geometric Conditions Traffic Volumes Travel Patterns Traffic Operations Intersection Level of Service I-90 Freeway Level of Service Safety Crash Summary Safety Analysis Intelligent Transportation Systems (ITS) Infrastructure Dynamic Message Signs (DMS) Road Weather Information Systems (RWIS) Automatic Traffic Recorder (ATR) Closed-Circuit Television (CCTV) Road Closure Gates and Signs Traveler Information (safetravelusa.com) Traveler Information (511) Traffic Signals ITS Needs ENVIRONMENTAL OVERVIEW Floodplains Historic Resources Hazardous Materials Wetlands & Waters of the US Wildlife/Threatened and Endangered Species Section 4(f) Section 6(f) Noise Environmental Justice Cumulative Impacts Page Page i
5 4.0 YEAR 2045 TRAFFIC CONDITIONS Future Roadway Network Growth Projections Projected Traffic Conditions Corridor Traffic Forecasts External Roadway Connection Scenarios Year 2045 No Action Traffic Volumes Projected Year 2045 No Action Traffic Operations I-90 Mainline Operations I-90 Ramp Merge / Diverge Operations Intersection Level of Service SOLUTIONS Description of Solutions Process Project Scoping Project Solutions Process Screening Criteria Alternative Development and Screening Exit 63 Level 1 Alternatives and Screening Exit 63 Level 2 Alternatives and Screening I-90 Corridor Solutions ITS Solutions Feasible Scenarios Feasible Option 1: Alternative #1 - Westgate Diamond Feasible Option 2: Alternative #4 - County Highway 1416 Diamond IMPLEMENTATION PLAN LIST OF APPENDICES Appendix A Appendix B Appendix C Appendix D Appendix E Appendix F Appendix G Public Meeting Summaries Methods and Assumptions Traffic Counts Existing Conditions LOS Worksheets Supporting Information Environmental Overview 2045 No Action LOS Worksheets Alternatives, Evaluation Matrix, Feasible Options, Cost Estimates Page ii
6 LIST OF FIGURES Figure ES-1. Figure ES-2. Figure ES-3. Figure ES-4. Page Feasible Option 1: Westgate Road Diamond Interchange ES-6 Feasible Option 2: County Highway 1416 Diamond Interchange ES-8 Existing and Proposed Typical Sections ES-9 Implementation Steps ES-10 Figure 1-1. Study Vicinity/Area Figure 1-2. Work Plan Figure 1-3. Planning Context Figure 2-1. Mainline I-90 Conditions Figure 2-2. Existing Traffic Volumes Figure 2-3. Corridor Travel Patterns Figure 2-4. Existing Traffic Conditions Figure 2-5. Statewide Traveler Information Figure 3-1. Overall Resource Map Figure 3-2. Existing Floodplain Conditions Figure 3-3. Potential Historic Properties Figure 3-4. Hazardous Materials Sites Figure 3-5. Identified Wetlands Figure 3-6. Section 4(f) Resources Figure 3-7. Section 6(f) Properties Figure 3-8. Noise Sensitive Areas Figure 3-9. Minority Populations Figure Low-Income Populations Figure 4-1. Year 2045 Land Use Forecasts Figure 4-2. Corridor Traffic Forecasts Figure 4-3. External Roadway Connections Scenarios Figure 4-4. Year 2045 No Action Traffic Volumes Figure 4-5. Year 2045 Projected Level of Service Figure 5-1. Solutions Process Figure 5-2. Alternative 1. Interchange at West Gate Figure 5-3. Alternative 2. Interchange at West Gate Road with Direct Access to Figure 5-4. Eastbound Alternative 3. Interchange at West Gate Road with Existing West Ramps and New East Ramps Figure 5-5. Alternative 4. Diamond Interchange at County Highway Figure 5-6. Alternative 11. Exit 63 Removal at County Highway Figure 5-7. I-90 Future Widening Plan Figure 5-8. Existing and Future Typical Section Figure 5-9. Feasible Option 1: Westgate Road Diamond Interchange Figure Feasible Option 1: Traffic Conditions Figure Feasible Option 2: County Highway 1416 Diamond Interchange Figure Feasible Option 2a: County Highway 1416 Diverging Diamond Interchange (DDI) Figure Feasible Option 2: Traffic Conditions Figure 6-1. Recommended Actions Next Steps Page iii
7 LIST OF TABLES Table ES- 1. Table ES- 2. Environmental Overview Results ES-2 ITS Solutions ES-9 Table 2-1. Origin-Destination Study Description Table 2-2. Traffic Parameters for Operational Analyses Table 2-3. Mainline I-90 LOS Criteria Table 2-4. Year 2017 Mainline I-90 Traffic Operations Table 2-5. Interchange Ramp Merge/Diverge Level of Service Table 2-6. Reported Crash Summary Table 2-7. Levels of Service of Safety Table 4-1. Traffic Growth by Roadway Table 4-2. Year 2045 Mainline I-90 Operations Table 4-3. Year 2045 Interchange Ramp Merge/Diverge Level of Service Table 5-1. Alternative Evaluation Categories and Criteria Table 5-2. Level 1 Alternative Descriptions Table 5-3. Level 1 Alternatives Screening Results Table 5-4. Level 2 Alternatives Screening Results Table 5-5. ITS Solutions Page iv
8 LIST OF ACRONYMS AADT annual average daily traffic AFB Air Force Base AICUZ Air Installation Compatible Use Zones ATR Automatic Traffic Recorder CCTV Closed-Circuit Television CEQ Council on Environmental Quality CFR Code of Federal Regulations CLOMR Conditional Letter of Map Revision CWA Clean Water Act DDI diverging diamond interchange DMS dynamic message sign DOT United States Department of Transportation EJ environmental justice EO Executive Order EPA U.S. Environmental Protection Agency ESA Endangered Species Act ESS Environmental Sensor Station FEMA Federal Emergency Management Agency FHU Felsburg Holt & Ullevig FHWA Federal Highway Administration FRS Facility Registry Service GIS Geographic Information System HCM Highway Capacity Manual HSM Highway Safety Manual I-90 Interstate 90 IMJR Interchange Modification Justification Report ITS Intelligent Transportation Systems JLUS Joint Land Use Study LOMR Letter of Map Revision LOS level of service LOSS level of service of safety LWCF Land and Water Conservation Fund mph miles per hour NEPA National Environmental Policy Act Page v
9 NPS NRHP NWI RCAMPO RCPE RCRA ROW RPW RWIS SAT SDDOT SDGFP SH SHPO SPF SPUI TNW USC USFWS vpd VSL WOUS National Park Service National Register of Historic Places National Wetland Inventory Rapid City Area Metropolitan Planning Organization Rapid City, Pierre, & Eastern Resource Conservation and Recovery Act right-of-way Relatively Permanent Water Road Weather Information Systems Study Advisory Team South Dakota Department of Transportation South Dakota Game, Fish, and Parks State Highway State Historic Preservation Office safety performance function single point urban interchange Traditional Navigable Water United States Code United States Fish and Wildlife Service vehicles per day variable speed limit waters of the U.S. Page vi
10 EXECUTIVE SUMMARY Introduction The Interstate 90 (I-90) Exit 61 to Exit 67 Corridor Study has investigated two primary areas of need: 1. I-90 Corridor Capacity: Traffic analyses were conducted to assess the need for additional travel lanes along I-90, regional roadway network improvements, or other multimodal mobility enhancements to provide acceptable traffic operations and safety now and into the long-range future. 2. Interchange Access: The current interchange at Exit 63 provides only for movements to and from the west, not in compliance with current Federal Highway Administration (FHWA) policy requiring that service interchanges provide for all movements. The study investigates options to bring Exit 63 into compliance with FHWA policy. The study area encompasses approximately 6 miles of I-90 and the areas on either side of I-90. Study Process The major elements that comprise the study include the Needs and Solutions Analyses, Public, Stakeholder and Agency Involvement and the Environmental Overview. These work elements proceeded along parallel paths throughout the project, culminating in the final selection of corridor-wide solutions. Existing Conditions To understand how the transportation system functions along the I-90 corridor between the Exit 61 and Exit 63 interchanges, the project team performed an inventory of the existing transportation system. This inventory included the following elements: I-90 geometric conditions Traffic conditions, including current traffic volumes, Ellsworth Air Force Base (AFB) travel patterns, and freeway and intersection operations Crash experience Intelligent Transportation Systems (ITS) inventory of locations and types of devices The following sections provide an overview of existing traffic conditions in the study area: Traffic Volumes and Operations Recorded traffic volumes along I-90 and surface street intersections are currently within capacity throughout most of the study area. I-90 traffic volumes in the study area range between 8,000 and 33,000 vehicles per day (vpd), which result in Level of Service (LOS) A and LOS B conditions. Intersections and turn movements at intersections generally operate at LOS D or better during the peak hours. The Elk Vale Road interchange operates at a LOS C during the peak hours but eastbound to southbound turn movement does experience higher delay than other turn movements at the intersection. At the Elk Vale Road / S. Service Road intersection, turn movements to Elk Vale Road do experience LOS F conditions in the peak hours. The County Highway 1416 intersections with Radar Hill Road and Ellsworth Road show Page ES-1
11 LOS F conditions for the northbound approaches as northbound vehicles attempt to turn left to westbound County Highway Traffic Safety A traffic safety analysis of crash data between 2011 and 2015 was conducted at the study intersections and along the I-90 corridor. Over this period there were just under 100 crashes reported along the I-90 corridor and more than half of these crashes involved a fixed object. A safety performance analysis of I-90 crashes did not show any crash patterns that deviated significantly from the norm. However, the crash analysis did show a relatively high number of off-road and over-turning crashes along the Exit 63 westbound on-ramp of which about twothirds occurred during poor roadway surface conditions. A few intersections within the study limits did show crash patterns. These intersections are: County Highway 1416 / Radar Hill Road Of the 46 crashes at this intersection, the predominant crash type (74 percent) were angle crashes. County Highway 1416 / Commercial Gate Road Of the 18 recorded crashes at this intersection, nine (50 percent) were angle crashes. Elk Vale Road / S. I-90 Service Road Only eleven crashes were recorded at this intersection but eight were angle crashes. ITS Infrastructure The existing ITS infrastructure in the study area consists of dynamic message signs (DMS), road weather information systems (RWIS), an automated traffic recorder (ATR), cameras, and road closure gates. Limitations of the current ITS infrastructure to address current needs include: The need for personnel to manually operate road closure gates/flashers Limited remote detection of roadway conditions, hampering the ability for emergency responders to reach incidents and/or maintenance forces to address concerns Multiple communications paths for ITS devices Closed-circuit television (CCTV) only supplying still images Lack of unified control interface for devices/cameras Environmental An environmental overview was completed for the study area with a focus on the immediate vicinity of the mainline I-90 alignment. The resources reviewed, findings and next steps associated with future projects are outlined in Table ES-1. Table ES- 1. Environmental Overview Results Floodplains Resource Findings Main floodways associated with Box Elder Creek, designated as 100-year floodplain Next Steps for Project Implementation Provide relevant documentation associated with any project efforts. Conduct floodplain modeling as needed. Page ES-2
12 Table ES- 1. Environmental Overview Results Resource Historic Resources Hazardous Materials Wetlands Wildlife/Threatened and Endangered Section 4(f) Section 6(f) Noise Findings 70 properties identified as potentially historic. Multiple potential hazardous materials sites based on U.S. Environmental Protection Agency (EPA) information. Exit 61 shows higher concentration of potential sites. Numerous wetlands identified in the study area of varying quality. Area habitat consistent with several species, particularly wetlands, streams, ponds, ditches and other drainages. No migratory bird nests noted on field visit. Two park properties were identified as Section 4(f) resources. According to the South Dakota Department of Transportation (SDDOT) information, two 6(f) properties are located within or adjacent to the environmental study area. Numerous noise sensitive areas exist within the study area, some of which are located within Ellsworth AFB noise areas. Next Steps for Project Implementation Sites should be evaluated further for National Register Eligibility. Project designs should seek ways to avoid or minimize impacts. Any projects must abide by hazardous waste handling regulations. Wetland delineation should occur to ensure accurate identification of wetlands leading to necessary permitting and mitigation. This can be time consuming. Detailed survey would need to be conducted for recommended species. The next steps of the Section 4(f) process require evaluations of publicly owned parks, trails, and open space lands to be conducted to determine if there are any impacted properties that qualify for protection under Section 4(f). For Section 6(f) properties located in the areas of the improvements, alternatives should be designed to avoid a conversion of these properties. If a conversion of land cannot be avoided, efforts will be made to mitigate effects to these properties. A full evaluation of traffic noise following the Guidelines (Figure 1) will likely need to occur later in the project development process because some improvement(s) ultimately recommended through the corridor study likely will be Type I and require a traffic noise analysis. Depending on project location, coordination with Ellsworth AFB may be required. Page ES-3
13 Table ES- 1. Environmental Overview Results Resource Environmental Justice Findings Approximately one-half of the study area includes minority population concentrations that exceed 16.4 percent. Low income threshold of 17 percent exceeded in all but one census block group in the area. Next Steps for Project Implementation Evaluations of impacts to low income and minority populations would be necessary. Cumulative impacts were evaluated using a 5-step process by which geographic and temporal limits were identified, future actions considered, and resources affected. Findings of the analysis indicate that it is not anticipated that recommended actions proceeding from the corridor study would substantially contribute to cumulative impacts. Year 2045 No Action Conditions To understand future transportation needs, Year 2045 traffic projections were developed using Rapid City Area Metropolitan Planning Organization (RCAMPO) land use forecasts and the travel demand model. Over the next 20 to 30 years, households in the study area are expected to increase by more than double and employment is expected to increase by a factor of 3.6. Traffic Forecasts Year 2045 traffic forecasts and the associated traffic volume growth factors developed using the regional travel demand model showed 29-year growth factors ranging from roughly 1.4 to 2.9. Overall, significant growth is expected throughout the study area. Higher growth rates are anticipated along the Elk Vale Road and Liberty Boulevard corridors. Slower growth is expected along I-90 and County Highway Traffic Operations Current I-90 capacity is sufficient to accommodate the expected growth in traffic. Both mainline and ramp/merge segments east and west of Exit 61 are expected to operate at LOS C during peak hours. East of Exit 63, interstate operations are LOS B or better. Anticipated growth will cause some operational issues by Year 2045 at intersections along Elk Vale Road and along County Highway The intersections with anticipated operational issues include: Elk Vale Road / I-90 Ramp Terminal Elk Vale Road / South I-90 Service Road Elk Vale Road / Mall Drive County Highway 1416 / Radar Hill Road County Highway 1416 / Ellsworth Road Operational improvement strategies for consideration at these locations include traffic control changes, lane additions, and consolidation of closely spaced intersections. Page ES-4
14 Solutions Project Solutions Process In response to transportation deficiencies and project needs, the Study Advisory Team (SAT) developed a comprehensive list of corridor solutions and categorized these into the following groups: I-90 Mainline: SDDOT plans to reconstruct the pavement of I-90 between Exit 61 and Exit 63 by the year Solutions were based on the need to evaluate different approaches to the pavement reconstruction effort to accommodate the potential for widening between Exit 61 and Exit 63. Exit 63 Reconstruction: The current Exit 63 interchange is not a full movement interchange. Interchange alternatives were developed for consideration based on the basic need to provide full movement access at Exit 63 to I-90, either at the existing Exit 63 location or at a nearby cross street. ITS Components: Various ITS devices exist in the I-90 corridor. Solutions focused on enhancing this existing system and to address safety issues in the corridor. Other Projects: Based on Year 2045 traffic volumes, there will be other deficiencies in the transportation system. Other project solutions are traffic control and capacity improvements at intersections to mitigate these future deficiencies. External Scenarios: These are new roadway connections and network enhancements that are independent of solutions in the other groups of solutions but, if implemented, would impact traffic operations along I-90 and at study intersections. Exit 63 Alternatives and Screening The focus for Exit 63 was to evaluate different interchange alternatives that provided full movements to and from I-90. To evaluate the feasibility and performance of the interchange alternatives, a set of screening criteria were established along these key core values. Ellsworth AFB impacts Physical impacts Compatibility with Existing Plans Construction Phasing and Implementation Design Criteria Public Comment Eleven initial alternatives were developed for reconstruction of the Exit 63 interchange. These alternatives are shown in Appendix G and are grouped around these cross streets with I-90 West Gate Road, County Highway 1416, Radar Hill Road, Commercial Gate Road, and Bennett Road. Using screening criteria through two rounds of screening, these eleven alternatives were narrowed to two feasible scenarios. These two scenarios are described in the following sections. Feasible Option 1: Alternative #1 - Westgate Diamond The conceptual design of Feasible Option 1 is shown on Figure ES-1. This scenario scored well for driver expectancy because of its diamond configuration, constructability as it could be largely constructed off-line, and implementation as it had the lowest cost. Page ES-5

15 Figure ES-1. Feasible Option 1: Westgate Road Diamond Interchange Page ES-6
16 Feasible Option 2: Alternative #4 - County Highway 1416 Diamond The second feasible option is Alternative 4, which is the extension of County Highway 1416 over I-90 to a new diamond interchange. The SAT also requested that for Alternative 4, a diverging diamond interchange (DDI) be evaluated. The conceptual design of Feasible Option 2 is shown on Figure ES-2. The primary reasons Feasible Option 2 was advanced were due to high driver expectancy, fewer property impacts, meeting of design criteria and control of access standards, and positive public feedback. I-90 Corridor Solutions Several key findings were discovered when evaluating options for the future widening of I-90. These findings were: Year 2045 traffic volumes did not warrant the need for a six-lane I-90. The widening needed to match the existing lane alignment under the Elk Vale Road overpass. Due to the railroad right-of-way, it was best to have all widening occur to the north. The widening needed to utilize the existing bridges south of Exit 63. Given these conditions and constraints, the proposed I-90 widening solution is auxiliary lanes between Exits 61 and 63. The widening would occur to the north but would avoid impacts or modifications to existing structures and the existing median width would be maintained. In terms of phasing, it is likely that the pavement rebuilding project of Year 2023 will not construct these auxiliary lanes but will put in place the grading needed to accommodate these new lanes. Figure ES-3 illustrates the proposed widening through existing and proposed typical sections. Note the outside lane in both directions is the proposed auxiliary lane. Page ES-7

17 Figure ES-2. Feasible Option 2: County Highway 1416 Diamond Interchange Page ES-8
18 Figure ES-3. Existing and Proposed Typical Sections ITS Solutions Table ES-2 provides a listing of recommended ITS solutions for the study corridor. These solutions would offer a range of safety and operational benefits to I-90 and roadway network travel. Table ES-2. ITS Solutions ITS Solution Description Goal/Potential Benefits 1 Roadway condition warning/ anti-icing for existing WB Exit 63 on-ramp to I-90 Use sensors and signs and/or sprayers to reduce crash risk. Improve safety 2 Intersection conflict warning for County Highway 1416 intersections 3 Remotely operated intelligent gates 4 Additional vehicle detection and surveillance on I-90 5 Fiber optic trunk along I-90 to connect devices to unify communications 6 Control software to unify DMS, CCTV, detection and other operations 7 Variable speed limit (VSL) signs Use detection and flashers to alert drivers approaching conflicting traffic. Allows current manual closure gates to be operated remotely. Allows data collection and monitoring of trouble spots, reducing response time and improving awareness. Enables reliable communications and full-motion video. Places all devices on one high performance network. Enables monitoring, data collection and control from a single interface. Reduces training time and IT workload. Uses hybrid active signs to display speed limits that vary based on conditions. Improve safety Improve safety and staff efficiency Improve mobility and efficiency Improve mobility and efficiency Improve efficiency Improves safety Page ES-9
19 Implementation Plan The I-90 Exit 61 to Exit 67 Corridor Study provides: A recommended ultimate I-90 typical section and alignment to ensure that actions taken with the grading and surfacing project planned for the Year 2023 can be compatible with and advance the future ultimate plan for widening I-90 to provide six travel lanes. Feasible design options for reconstructing the Exit 63 interchange include the following: Feasible Option Description Estimated Construction Cost 1 West Gate Road Diamond $11.3 M 2 County Highway 1416 Diamond $17.1 M 2a County Highway 1416 Diverging Diamond $23.8 M ITS Strategies that address identified needs and offer opportunities to provide improved traffic operations and safety with a lower investment level than required for major infrastructure projects. Figure ES-4 provides an overview of next steps related to each type of recommended action provided in the corridor study. Figure ES-4. Implementation Steps Page ES-10
20 1.0 INTRODUCTION 1.1 Study Purpose and Background The South Dakota Department of Transportation (SDDOT), in conjunction with the City of Box Elder, Federal Highway Administration (FHWA) and Rapid City Area Metropolitan Planning Organization (RCAMPO) has conducted the Interstate 90 (I-90) Exit 61 to Exit 67 Corridor Study to provide a foundation for a purpose and needs statement that defines the goals and objectives for the corridor and/or recommended projects. The study revealed transportation issues and needs facing the I-90 corridor within the study area. The study recommends feasible solutions to address those issues and needs that meet current design standards and/or traffic Level of Service (LOS) expectations under both the current and predicted future traffic conditions, while promoting a livable community that will enhance the economic and social well-being of all users of the corridor. Two primary areas of need have been investigated in this study: 1. I-90 Corridor Capacity: The need for I-90 and the surrounding roadway network to provide acceptable traffic operations and safety now and into the long-range future. Traffic counts, forecasts and analyses were used to address: The need for an additional travel lane along I-90 for all or part of the study corridor The need for particular regional roadway network improvements to accommodate vehicle-trips and support I-90 The need for other multimodal mobility enhancements 2. Interchange Access: The current interchange at Exit 63 provides only for movements to and from the west, not in compliance with current FHWA policy requiring that service interchanges provide for all movements. The study will investigate options to bring Exit 63 into compliance with FHWA policy. The study builds upon the momentum of recent planning efforts undertaken in the area that have highlighted needs and solutions surrounding the Interstate corridor in the area. The study considers the influence of supporting roadway network connections on I-90 traffic levels and the ability to improve transportation safety and operations using Intelligent Transportation Systems (ITS) solutions. Involvement from area stakeholders and the general public was sought to enrich and secure broad input into the study s findings. An environmental resource overview was conducted to understand the implications associated with corridor solutions and set the stage for future environmental analyses and clearances needed to construct improvements. 1.2 Study Area The I-90 corridor serves as the primary east-west connection across the State of South Dakota and beyond its borders. The study area encapsulates the portion of I-90 that connects the City of Rapid City with the City of Box Elder and Ellsworth Air Force Base (AFB). Figure 1-1 provides an overview of the project vicinity and the study area. The study area includes three freeway interchanges and roughly six miles of I-90. Page 1-1

21 Figure 1-1. Study Vicinity/Area Page 1-2
22 The study area is located entirely within Pennington County and includes portions of the cities of Box Elder and Rapid City, unincorporated areas of the County and Ellsworth AFB. Land uses within the study area are comprised of commercial development, hospitality uses, farm and ranch land, and residential uses. City of Box Elder land immediately adjacent to the interstate includes commercial development and residential subdivisions with numerous homes immediately adjacent to mainline I-90 Right-of-Way. Ellsworth AFB is located immediately north of the study area s eastern portion and its accompanying Air Installation Compatible Use Zones (AICUZ) influence land use decisions beyond Ellsworth AFB boundaries within the study area. 1.3 Study Process The work plan is depicted graphically on Figure 1-2. Three main elements comprised the study: Needs and Solutions Analyses, Public Involvement, and Environmental. These work elements proceeded along parallel paths throughout the project, culminating in the final selection of corridor-wide solutions Needs and Solutions Analyses The needs and solutions analyses comprised the technical core of the study. The identification of needs was performed by first compiling a comprehensive dataset describing existing conditions throughout the study area. Data collection efforts included recording traffic volumes, reviewing relevant agency requirements, compiling available Geographic Information Service (GIS)-based mapping of boundaries, resources and land contours, gathering a current inventory of ITS, and collecting a history of reported traffic crashes. The data were analyzed to rate current performance and identify deficiencies. Year 2045 traffic forecasts were developed to test operational performance into the future, reveal any additional needs not known based on current conditions, and understand the impact of various potential future roadway network enhancements. Grasping the needs, the project team worked to identify potential solutions along the I-90 corridor. Solutions included potential interchange reconstruction, mainline I-90 widening scenarios, and ITS improvements. The potential solutions were evaluated to assess the ability of each to address the needs, and higher-performing feasible build scenarios were developed for consideration, refinement and inclusion as study recommendations Public Involvement Conversation about the study was held with the general public using the following means: Public Meetings: Three public meetings were held each including a presentation and open house style interaction. The initial meeting was held in July 2016 to introduce the study and gather input on baseline conditions. The second meeting was held in March 2017 to provide results of the needs assessment and gather input on study area solutions. The third and final public meeting was held in September 2017 to present draft study recommendations. A total of 100 people attended the three meetings. Summaries of each public meeting are included in Appendix A. Page 1-3

23 Figure 1-2. Work Plan Page 1-4
24 Study Website: Project information was regularly posted to the project website located at Posted materials included public meeting documents and announcements and contact information. Ellsworth AFB Postings: Concurrent with each of the three public meetings, project information was posted at locations throughout Ellsworth AFB, including the commissary, BX, health clinic, and service center. The information provided on-base viewers with access to the same material presented at public meetings and offered an opportunity to provide input if desired. Other channels: Other general public channels included media coverage of each of the three public meetings, press releases, and agency notifications of public meetings. Input from agencies was received via regular meetings of the Study Advisory Team (SAT). The SAT met eight times during the project to provide input on study findings, discuss proposed solutions, and review public involvement materials. The SAT was comprised of representatives of SDDOT, FHWA, City of Box Elder, RCAMPO, Ellsworth AFB, and the Ellsworth Development Authority. Two additional meetings were held for particular study purposes. The Solutions Workshop was held following the first public meeting and completion of the needs assessment. At the workshop, the SAT and additional agency representatives brainstormed options and articulated priorities for the future of the study area. The information coming out of the Solutions Workshop helped sharpen the project team s understanding of issues and yielded good ideas for consideration. The ITS Stakeholder Meeting was held weeks after the Solutions Workshop. This meeting included primarily SAT members and provided a forum for the project team to share information about ITS enhancements for consideration as study recommendations Environmental The environmental work element served a twofold purpose throughout the project, as follows: 1. The inventory of existing environmental resources helped to inform the determination of feasibility of various corridor and interchange solutions and will assist in future steps toward implementation of projects. 2. The environmental overview conducted as a part of this study sets the stage for future environmental documentation that would be required to clear projects for implementation. The National Environmental Policy Act (NEPA) requires that, among other items, projects have a firm basis in a Purpose and Need statement, arise from appropriate consideration of alternatives, and include public involvement efforts. By introducing these items, the efforts included in the study help set the stage for more streamlined future completion of NEPA documents. The environmental overview included a desktop review of available resource information, and a field review to confirm/supplement known information. Mapping and text information is provided in Section 2.7. Page 1-5
25 1.3.4 Study Oversight Study oversight was provided by the SDDOT Project Manager and SAT. Consistent with SDDOT practice for planning studies, a Methods and Assumptions document was developed at the outset of the project in collaboration with SDDOT and FHWA authorities. The Methods and Assumptions document ensured agency agreement on the fundamental methods to be used for completion of the study. This document is included in Appendix B. 1.4 Planning Context and Prior Studies A number of previous plans and studies have included consideration of transportation needs within and proximate to the study area. These documents served as references for the corridor study and their findings were incorporated as appropriate. Documents included: Decennial Interstate Corridor Study: Completed by SDDOT in 2010, the statewide study included initial alternatives for the future of Exit 63. BESTPlan Box Elder Strategic Transportation Plan: This transportation plan completed for the rapidly growing City of Box Elder outlines needed actions for the surface transportation network surrounding I-90 to continue to mature in its role of serving motorized and non-motorized travel to and through the community. The plan highlighted the importance of I-90 access to the community and noted the need for further consideration of the future of Exit 63. Ellsworth AFB Joint Land Use Study (JLUS): Ellsworth AFB completed a study of the area surrounding the base, collaborating with local agencies and stakeholders to ensure that future growth around Ellsworth AFB is coordinated and compatible with military training activities. Figure 1-3 provides a tabulation of entities possessing active interest in the future of the study area, along with a description of their goals, documented positions and I-90 input. Page 1-6

26 Figure 1-3. Planning Context Page 1-7
27 This page intentionally left blank. Page 1-8
28 2.0 EXISTING CONDITIONS To understand how the transportation system functions along the I-90 corridor between the Exit 61 and Exit 67 interchanges, the project team completed an inventory of the existing transportation system. This inventory is an important component of the planning process as it becomes the starting point for identifying areas in need of improvement. The inventory of existing conditions in the study area (Figure 1-1) includes the following aspects of the transportation system along and adjacent to I-90 between the Exit 61 and Exit 67 interchanges. Existing traffic volumes at interchanges, along I-90, and intersections Traffic operations at intersections, along mainline I-90, and at ramp junctions Travel patterns including an origin-destination study for I-90 Exit 63 traffic to/from Ellsworth AFB and Radar Hill Road Geometric characteristics of I-90 and surface streets including the number of lanes, bridge conditions, and grades Crash history along I-90 and at study intersections Inventory of existing ITS equipment in the study area Environmental data including floodplains, environmental justice (EJ), wetlands, and other biological and natural data. The environmental overview is detailed in Section Roadway Network Most roads within the study area provide two travel lanes (one in each direction). The only four-lane roads are I-90, County Highway 1416 from I-90 to Ellsworth Road, Liberty Boulevard between I-90 and Ellsworth Road, and Elk Vale Road. The following sections describe major roadways in the study area. Interstate 90: I-90 is a four-lane interstate freeway that extends east-west throughout the United States and through Pennington County, forming the backbone of the City of Box Elder area roadway network. The posted speed is 65 miles per hour (mph) to east of the Exit 67 interchange where it changes to 80 mph through the rest of the study area. Interchanges in the study area include: Exit 61 is the Elk Vale Road/US 16B/SD 79 interchange and is a single point urban interchange (SPUI). Exit 63 is the County Highway 1416/West Gate Road interchange and is a partial movement interchange that only provides I-90 access to and from the west. Exit 67 is the Liberty Boulevard interchange and it has a partial cloverleaf configuration with a loop ramp to serve eastbound to northbound movements. County Highway 1416: County Highway 1416 is a divided four-lane roadway extending eastwest from I-90 to Ellsworth Road, where it becomes two lanes through the City of Box Elder and the study area. The four-lane section is posted 55 mph. Page 2-1
29 Radar Hill Road: Radar Hill Road is a north-south arterial extending from County Highway 1416 to State Highway (SH) 44. It is east of Elk Vale Road and is the only roadway in the study area that traverses the ridge south of Box Elder. Ellsworth Road: Ellsworth Road is a two-lane north-south arterial running north from just south of Box Elder Creek, under I-90, to the Patriot Gate at Ellsworth AFB. Elk Vale Road/US 16B/SD 79: Elk Vale Road within the study area is a four-lane arterial between Cheyenne Boulevard and East Mall Drive. It has a posted speed limit of 45 mph, intersects I-90 at a SPUI, has signalized intersections at Cheyenne Boulevard, and has stopcontrolled intersections at Mall Drive and at the North and South I-90 Service Road intersections. In the larger context of the Rapid City area, Elk Vale Road runs along the eastern and southern edges of Rapid City to form a loop around the City. Regionally, it connects I-90, SH 44, SH 79, and US Highway 16. West Gate Road: West Gate Road is a two-lane north-south arterial running south from Heppner Drive to its terminus with County Highway It crosses I-90 with a two-lane bridge and has stop control at all its intersections. South Gate Road: South Gate Road, also called Commercial Gate Road, is a two-lane, mostly private north-south access road connecting County Highway 1416 with Ellsworth AFB s Commercial Gate. The roadway passes beneath mainline I-90. The commercial gate serves all commercial traffic entering the base, and is currently also open to private vehicle traffic. 2.2 Geometric Conditions Figure 2-1 illustrates some of the basic geometric features of I-90 through the study area. The typical section of I-90 lies within a 300-foot total right-of-way with two general purpose lanes in each direction, inside and outside shoulders, and a depressed median. Along I-90 there are eight structures. The structures at Elk Vale Road, County Highway 1416, Westgate Road, and Liberty Boulevard all go over I-90, while structures at Commercial Gate, Ellsworth Road, and the abandoned Ellsworth AFB track take the I-90 mainline over these cross streets and railroads. East of Exit 63 the terrain is significantly higher along the north side of I-90 than along the south side of I-90. Homes and businesses between I-90 and Box Elder Road sit well below the I-90 grade. 2.3 Traffic Volumes In May 2016, peak hour turning movement counts were collected at 12 at-grade intersections in the study area. Working from north to south, counts were collected at the Elk Vale Road intersections with Mall Drive, the I-90 ramps, and at the South I-90 Service Road. Along County Highway 1416 counts were collected at the Westgate, Radar Hill, Commercial Gate, and Ellsworth Road intersections. Along Westgate Road north of I-90 counts were collected at the Bluebird Drive and the North I-90 Service Road intersection. Counts were also collected at the Liberty Boulevard ramp terminals. Page 2-2

30 Figure 2-1. Mainline I-90 Conditions Page 2-3
31 In general, PM peak hour volumes are higher than AM peak hour volumes. In the Box Elder area eastbound traffic flows are higher in the AM peak and PM peak hour flows are higher in the westbound direction. Along Elk Vale Road peak hour volumes are heavily oriented to and from locations south of I-90. Peak hour volumes along I-90 show an unexpected pattern east of Exit 61 where the westbound peak hour traffic volume during both the AM and PM peak hours is higher than the peak hour volumes in the eastbound direction. Mainline volumes west of the Exit 61 follow a more typical pattern with AM peak hour volumes oriented to the west and PM peak hour volumes oriented to the east. In addition to the peak hour counts at intersections, daily traffic counts were obtained from SDDOT at spot locations while additional daily traffic counts were estimated throughout the study area using existing peak hour percentages. As shown, I-90 daily volumes decrease from about 32,000 vehicles per day (vpd) west of Exit 61 to about 13,300 vpd east of Exit 63. In fact, about half of the traffic on I-90 enters and exits I-90 at County Highway 1416 and, as shown on Figure 2-2, County Highway 1416 traffic is slightly greater than daily traffic on I-90. East of Exit 67, I-90 daily traffic volumes again drop significantly, from 13,300 vpd to about 8,300 vpd. 2.4 Travel Patterns In addition to the extensive traffic volume collection effort, corridor travel pattern data were collected by means of an origin-destination study of I-90 traffic. The purpose behind the corridor travel study was twofold: (1) quantify the use of the Exit 63 interchange by traffic at the Elk Vale Road interchange and by Ellsworth AFB personnel, and (2) quantify the use of Elk Vale Road to travel to the Rapid City Regional Airport. To obtain this information, License Plate Recognition technology was used to track vehicles between origin-destination pairs. The origin-destination pairs evaluated are described in Table 2-1. Table 2-1. Origin-Destination Study Description Question Question #1: What is the amount of Exit 63 traffic that enter/exits I-90 via Exit 61? Question #2: What is the amount of Exit 63 traffic coming from/going to Ellsworth AFB? Question #3: What is the amount of Exit 61 traffic that enter/exits the Rapid City Regional Airport? Camera Locations Origin Destination Exit 61 EB on-ramp Exit 63 EB off-ramp Exit 63 WB on-ramp Exit 63 EB off-ramp Outbound Ellsworth AFB at Main, Patriot and Commercial gates Exit 61 exit ramps (from I-90) Airport Exit Exit 61 WB off-ramp Inbound Ellsworth AFB at Main, Patriot and Commercial gates Exit 63 WB on-ramp Airport Entrance Exit 61 entry ramps (onto I-90) Page 2-4

32 Figure 2-2. Existing Traffic Volumes Page 2-5
33 Figure 2-3 shows the corridor travel patterns for the origin-destination pairs described in Table 2-1. Starting with question #1 on the amount of Exit 63 traffic with an origin or destination to an Exit 61 ramp, the data showed the following: 13 percent of the traffic on the eastbound Exit 63 off-ramp had an origin of the Exit 61 eastbound on-ramp. 20 percent of the traffic on the westbound Exit 63 on-ramp had a destination of the Exit 61 westbound off-ramp Concerning question #2: The study showed that overall about 70 percent of traffic using the Exit 63 ramps is traffic related to Ellsworth AFB. In addition, based on traffic counts at gate access points it is estimated that about 57 percent of Ellsworth AFB traffic uses the Exit 63 interchange. Concerning the usage of gates by Ellsworth AFB personnel, the study captured the following information: Of inbound Ellsworth AFB traffic that uses Exit 63, nearly half enter the base via the Main Gate and about one-third enter via Commercial Gate. Outbound Ellsworth AFB traffic that uses Exit 63 does not show the same pattern of gate usage as the inbound traffic. The data show that 40 percent use Commercial Gate, 36 percent uses Patriot Gate, and only 24 percent uses the Main Gate. Concerning question #3 about the use of Exit 61 by Rapid City Regional Airport related traffic, the data show only seven percent of total Rapid City Regional Airport traffic used the Exit 61 interchange. 2.5 Traffic Operations Existing traffic operations were analyzed along mainline I-90, at ramp merge/diverge points, and at intersections. All operational analyses were completed using the analytical procedures of the Highway Capacity Manual (HCM) 2010 (Transportation Research Board, 2010). Table 2-2 outlines the HCM 2010 analysis procedures that require the certain use of parameters and assumptions concerning these parameters: Table 2-2. Traffic Parameters for Operational Analyses Traffic Parameter I-90 Freeway Ramp Terminal Intersections Percent Heavy Vehicles Determined from recorded vehicle class on I-90 5 percent Existing Peak Hour Factors Future Peak Hour Factors Based on existing counts Based on existing counts and calculated as the PHF for each approach Free-flow Speed 75 N/A Terrain / Area Type Level Non-CBD Saturation Flow Rate n/a 1,800 vehicles per hour per lane Cycle Length n/a 100 Seconds 0.90 Page 2-6

34 Figure 2-3. Corridor Travel Patterns Page 2-7
35 Figure 2-4 shows existing traffic conditions along I-90 and at study intersections. The following sections provide a summary of the major findings of the operational analysis Intersection Level of Service This study presents operations at stop and signal controlled intersections as a LOS. The LOS ranges from A to F, based on the average delay of all vehicles using the intersection. LOS A, the best or the least congested grade, has minimal or no vehicle delay, while LOS F indicates failure because the vehicle demand exceeds the available capacity. The figure on the left provides a general graphical representation of LOS at intersections. In this study, the primary mobility goal was a LOS C or better for overall signalized intersection operations, ramp terminals, mainline freeway, ramp merge/ diverge areas and weaving segments. At stop-controlled intersections, it is understood that there might be some instances where minor street LOS is LOS E or LOS F, in these cases the volume-to-capacity ratio and 95 th percentile queue lengths where considered in the assessment of intersection operations. In general, existing intersection and turn movement operations at study intersections was found to be at LOS D or better during the peak hours. The following sections discuss key findings and existing operational issues determined in the analysis. Elk Vale Road / I-90 Ramp Terminal Intersection: Currently the overall LOS of the ramp terminal is LOS C in both the AM and PM peak hours. This analysis removes the off-ramp rightturn movements to Elk Vale Road since vehicles in these movements essentially bypass the traffic signal at the ramp terminal. When assumed to operate under stop-sign control, the eastbound right-turn movement to southbound Elk Vale Road operates at LOS C in the AM Page 2-8
36 peak hour and LOS D in the PM peak hour. The westbound right turn movement to northbound Elk Vale Road currently operates at LOS A during both peak hours. Elk Vale Road / S. I-90 Service Road: This intersection operates with stop control on the service road approaches. As expected on a heavy-travelled road, vehicles turning from the service road to Elk Vale Road experience high delay and LOS F conditions. Elk Vale Road / Mall Drive: As expected the stop controlled approaches of Mall Drive and the driveway access on the east side of the intersection operate at LOS F during the PM peak hour. County Highway 1416 / Radar Hill Road: Like most intersections along County Highway 1416 the intersection is split between the eastbound and westbound directions. The Radar Hill Road approach to the eastbound County Highway 1416 lanes is showing LOS F conditions during the AM peak hour. This indicates Radar Hill Road traffic is having difficulty crossing the eastbound lanes of County Highway 1416 but the LOS A conditions at the westbound County Highway 1416 intersection indicate Radar Hill Road traffic can easily access the westbound lanes upon crossing the eastbound lanes. It should be noted that geometric improvements and signalization planned at this intersection would eliminate current operational concerns. County Highway 1416 / Ellsworth Road: The eastbound County Highway 1416 intersection the Ellsworth Road approach is currently experiencing LOS F conditions. This is primarily due to the heavy traffic volumes from eastbound to northbound I-90 Freeway Level of Service Like at-grade intersections, freeway mainline and ramp merge/diverge operations are quantified by a LOS. Unlike at-grade intersections the LOS is not based on delay but based on density, which is a measure of the number of vehicles calculated per mile per lane. Table 2-3 shows the LOS criteria for mainline freeway operations. Mainline I-90 Operations Table 2-3. Mainline I-90 LOS Criteria LOS Maximum Density for LOS Maximum Service Volume (Vehicles per hour per lane) for LOS Maximum AADT 2-way I-90 Volume for LOS (4-lane I-90) A ,560 B ,001 40,040 C ,363 54,520 D ,616 64,640 E ,785 71,400 F variable Variable Variable Figure 2-4 and Table 2-4 show mainline I-90 existing LOS. As shown, all mainline segments of I-90 currently operate well at LOS B or better during the peak hours. Page 2-9

37 Figure 2-4. Existing Traffic Conditions Page 2-10
38 Table 2-4. Year 2017 Mainline I-90 Traffic Operations I-90 Segment Existing Operating Conditions AADT LOS- AM Peak LOS PM Peak West of Exit 61 32,650 B B East of Exit 61 29,800 B B East of Exit 63 13,350 A A East of Exit 67 8,200 A A I-90 Ramp Merge / Diverge Operations Table 2-5 and Figure 2-4 show existing ramp merge/diverge levels of service. Again, all ramp merge/diverge points currently operate well. Table 2-5. Interchange Ramp Merge/Diverge Level of Service On-Ramps Off-Ramps Interchange Direction AM Peak PM Peak AM Peak PM Peak Direction Hour Hour Hour Hour EB A B EB B B Exit 61 WB B B WB B B Exit 63 WB B B EB B B EB (SB) A A EB A A Exit 67 EB (NB) A A WB A A WB A A 2.6 Safety SDDOT currently maintains a GIS crash database designed to monitor crash trends. As part of this corridor study, crash data were compiled for a 5-year period to identify significant crash patterns within the study area. The analysis was conducted for all crashes reported between 2011 and Crash Summary For summary and analysis purposes, I-90 was divided into: Segment 1 between Exit 61 and Exit 63 and Segment 2 between Exit 63 and Exit 67. Further site-specific evaluation along the I-90 corridor occurred at the Exit 63 westbound on-ramp and Exit 67 interchange. Crash data were also compiled by surface street intersection. Table 2-6 provides an overall summary of reported crashes in the study area. Page 2-11
39 Table 2-6. Reported Crash Summary Location Total PDO INJ FAT I-90 Segment I-90 Segment Exit 63 WB On-Ramp Exit 67 Interchange County Highway 1416/West Gate County Highway 1416/Radar Hill County Highway 1416/Commercial County Highway 1416/Ellsworth Elk Vale/Mall Elk Vale/I-90 Service Road Elk Vale/I-90 Ramp Terminal Elk Vale/Edward Street Safety Analysis Safety Performance Functions (SPFs) provide an estimate of the normal or expected crash frequency and severity for a range of annual average daily traffic (AADT) among similar roadway segments or intersections. The SPFs facilitate the calculation of Level of Service of Safety (LOSS). The concept of LOSS uses qualitative measures that characterize safety of a roadway segment in reference to its expected performance and severity. If the LOSS predicted by the SPF represents a normal or an expected number of crashes at a specific level of AADT, then the degree of deviation from the norm can be stratified to represent specific safety levels. LOSS I LOSS II LOSS III LOSS IV Indicates low potential for crash reduction Indicates low to moderate potential for crash reduction Indicates moderate to high potential for crash reduction Indicates high potential for crash reduction For this analysis, SPFs from the Highway Safety Manual (HSM) (AASHTO, 2010) were used to calculate LOSS for the corridors and intersections. Table 2-7 provides the LOSS for the total number of crashes and the severity of crashes for each roadway segment and intersection analyzed. It should be noted that the County Highway 1416 intersections in this analysis are two intersections in one. At these intersections, the wide median creates two intersections with each direction of County Highway 1416 that effectively operate as independent intersections with separate stop controls. There is not an SPF that is truly comparable to the Page 2-12
40 split intersections and as such the calculated LOSS may not be an accurate representation of the true safety of the intersection because the separate directions were analyzed as a single intersection. Table 2-7. Levels of Service of Safety Location Total PDO I-90 Segment 1 III II I-90 Segment 2 III I Exit 63 WB On-Ramp N/A N/A Liberty Interchange N/A N/A County Highway 1416/West Gate II II County Highway 1416/Radar Hill III III County Highway 1416/Commercial III III County Highway 1416/Radar Hill II I Elk Vale/Mall II/III I Elk Vale/I-90 Service Road III III Elk Vale/I-90 Ramp Terminal I I Elk Vale/Edward Street II II In the study area, there were no segments where the LOSS rating for total crashes reached LOSS IV. In total, there were six locations where the rating was LOSS III, indicating there is some potential for crash reduction. The following sections provide more crash detail for the locations with a LOSS III rating and with a relatively high total number of crashes. I-90 Segment 1 Segment 1 extends from Exit 61 to Exit 63 along I-90. As shown in Table 2-6, the section of I-90 had 59 crashes during the study period with eleven of these crashes resulting in injuries. The pie chart to the right breaks down the crashes by type. As shown, the predominant crash type is fixed object with over half the total crashes. Fixed Object 31 53% Other 6 10% Sideswipe Same Direction 3 5% Wild Animal 9 15% Rear-End 4 7% Angle 6 10% Page 2-13

41 Crash patterns were analyzed using the expected crash patterns in the HSM to calculate crash types that appear more frequently than would be expected in a corridor of this type. Based on the crash pattern analysis, there are more angle crashes than would be expected. Two of the six crashes occurred when there were poor roadway conditions, which was likely a factor. I-90 Segment 2 Segment 2 extends from Exit 63 to Exit 67 along I-90. As shown in Table 2-6, the section of I-90 had 39 total crashes during the 5-year study period with six of the crashes resulting in injuries and one fatal crash. The fatality was a pedestrian type crash that occurred on westbound I-90 just east of the West Gate Road bridge. The chart to the right shows the breakdown of crashes by type. As shown, the Fixed Object 20 51% predominant crash type is fixed object with approximately half the total crashes; however, none of the crash types were statistically significant in this segment of the I-90 corridor. Other 3 8% Rear-End 2 5% Sideswipe Same Direction 2 5% Wild Animal 9 23% Overturning 3 8% I-90 Exit 63 Westbound On-Ramp Although this section did not have a LOSS III rating, it did show a high number of crashes. According to the crash data, this ramp had 23 total crashes during the study period with five of the crashes resulting in injuries. As shown in the chart the predominant crash type is fixed object with 87 percent of the total crashes. Overturning 1 4% Wild Animal 2 9% There are no typical crash patterns for an on-ramp to use Fixed Object 20 87% as a basis to analyze crash patterns. However, there seems to be a very high number of off-road crashes due to the number of fixed object crashes. Of the 21 fixed object and over-turning crashes, 13 occurred on poor roadway conditions. The large curve in the on-ramp likely contributed to the high frequency of off-road crashes as did poor roadway conditions. Page 2-14
42 County Highway 1416 / Radar Hill Road The intersection of County Highway 1416 with Radar Hill Road had 46 crashes during the study period. Of those 46 crashes, 23 resulted in injuries. As shown in the chart, the predominant crash type was angle crashes with 74 percent of the crashes. Jackknife 1 2% Fixed Object 3 7% Rear-End 8 17% The crash pattern analysis for the intersection of County Highway 1416 with Radar Hill Road showed that angle crashes occurred more frequently than expected. In addition, there was a high frequency of injury crashes. This is probably related to the high frequency of angle crashes as those tend to be more severe. Of the 34 angle crashes, 21 occurred on eastbound County Highway 1416 and 13 were on westbound County Highway Stop control treatments done at other County Highway 1416 intersections to address safety issues at this intersection are not feasible as Radar Hill Road is a major roadway to the south and would result in poor operations for the intersection. Therefore, current plans to eliminate the median and signalize the intersection should continue to be the preferred course of action to address the angle crashes occurring at this intersection. Angle 34 74% County Highway 1416 / Commercial Gate Drive The intersection of County Highway 1416 with Commercial Gate Drive had 18 crashes during the study period. Of those 18 crashes, six resulted in injuries. As shown, the predominant crash type at this intersection was angle crashes; half of the total crashes. A crash pattern analysis at this intersection shows that angle crashes are occurring more frequently than expected. Of the nine angle crashes, eight occurred on westbound County Highway This intersection has stop control on westbound County Highway Angle 9 50% Head-On 1 6% Fixed Object 2 11% Rear-End 6 33% Page 2-15

43 Elk Vale Road / Edward Street The intersection of Elk Vale Road with Edward Street only had a LOSS II rating. It has been included in this discussion because six of the total eleven crashes at this intersection resulted in injuries. Furthermore, the chart shows that the predominant crash type at this intersection is angle crashes with almost threequarters of the total crashes. The crash pattern analysis shows that angle crashes occurred more frequently than expected. In addition, there is a high frequency of injury crashes, which is likely related to the high frequency of angle crashes as those tend to be more severe. Of the eight angle crashes, six were caused by a westbound vehicle either turning left or going straight through the intersection and not yielding to through vehicles on Elk Vale Road. Improvements that could help reduce crashes at this location include: Consider restricting the west leg to right-in/right-out. This leg connects to Eglin Street to the south, which provides access to Elk Vale Road at a signalized intersection. Consider connecting the east leg through to Cheyenne Boulevard to the south. Adding a through connection makes it possible to restrict this movement to right-in/right-out. Alternatively, consider restricting the east leg and creating locations where U-turns are possible somewhere to the north and south of the intersection. 2.7 Intelligent Transportation Systems (ITS) Infrastructure The study area is characterized by overall low population density adjacent to I-90. The corresponding lower traffic volumes have resulted in ITS deployments that focus on traveler information and management of roadway closures (due to weather conditions) and deemphasize technologies such as vehicle detection and video surveillance that typically target more congested travel conditions Angle 8 73% Fixed Object 1 9% Sideswipe Same Direction 2 18% Figure 2-5 provides an overview of the locations and types of devices within and adjacent to the study area. The following text provides additional detail for each device type. Page 2-16
 in study area I-90 eastbound, approximately 950 feet west of Lowry Lane (MRM 61.")
44 Figure 2-5. Current ITS Infrastructure Dynamic Message Signs (DMS) Locations There is one DMS in the study area, with two additional installations immediately adjacent. Locations are: I-90 westbound, approximately 700 feet east of 146 th Avenue (MRM ) in study area I-90 eastbound, approximately 950 feet west of Lowry Lane (MRM ) immediately adjacent to study area Elk Vale Road northbound, approximately 1,100 feet south of Cheyenne Boulevard (Elk Vale Road is I-90 Exit 61) immediately adjacent to study area Physical Description All three signs are Daktronics Galaxy models mounted on monopoles approximately 20 feet above ground level. Pole-mounted cabinets are used to house sign controller and communications equipment. All signs are single-sided with amber-on-black displays. Walk-in cabinets are used to permit servicing of sign components from behind the display and to protect workers while accessing sign components. Page 2-17
45 Communications All signs use an SDDOT-owned 900 MHz-band spread spectrum data radio system. Each sign is equipped with a radio that connects to a base station transceiver located at the SDDOT facility in Rapid City on Eglin Street. This system also makes use of a single, tower-mounted repeater to improve the coverage of the radio system. The base station radio is connected through the local building LAN to the SDDOT WAN, which allows for any connected office site to access the signs with appropriate software and authorization. Control Both local SDDOT personnel and those located in other offices can monitor and post messages on the signs. The Daktronics Vanguard software is used in all cases to control the sign displays. Usage DMS signs are used for common traveler information cases, including roadway closures, construction information, incident information, and amber alerts. SDDOT does not currently use any DMS for Public Service Announcement or other non-roadway-management applications Road Weather Information Systems (RWIS) RWIS provide key meteorological data from sensors mounted in compact, roadside installations called Environmental Sensor Stations (ESS). This data is commonly used to provide traveler information and to support winter maintenance decisions. Locations There is one RWIS site in the study area on I-90 westbound at mile 65.2, near County Road 214. Physical Description ESS are truss-style towers approximately 20 feet tall with an attached cabinet and various meteorological sensors. No in-pavement sensors for temperature or ground condition (wet, ice, etc.) are in use at this site. A dome-style camera is also installed on the tower, which captures still images from pre-defined pan-tilt-zoom settings. Communications A cellular modem is used to send the data from the sensors and images from the camera to a central database and image repository. Control There is no active control of the devices on the ESS. Data is automatically reported to a central database and distributed via a web interface to travelers and other users at Usage Travelers use RWIS information to make informed decisions about travel in areas that may be affected by weather. SDDOT personnel utilize RWIS data to support maintenance (plowing and anti-icing material application) decisions to ensure the road is properly serviced in an efficient fashion. Page 2-18
46 2.7.3 Automatic Traffic Recorder (ATR) ATRs detect vehicles at a specific point on a roadway, providing a continuous count of traffic volumes. ATRs may also record speed and vehicle classifications. Locations There is one ATR site in the study area on I-90 (both directions) at mile Physical Description The ATRs consist of an equipment cabinet mounted on a short (approximately 3-foot) pole on the eastbound side of I-90 and pairs of in-pavement inductive loops in each lane on I-90. Communications Data is stored in the ATR s controller at the site and is periodically retrieved using a dial-up telephone connection. Control There is no active control of the ATR s operation. Data collection is automated and no interaction with the site is generally needed after initial configuration. Usage Traffic data collected by the ATR is used by the SDDOT Division of Planning and Engineering to create travel forecasts and plan for pavement life cycle management. This ATR site is also capable of providing vehicle classification data Closed-Circuit Television (CCTV) There are no CCTV installations in the study area that provide motion video; however, an RWIS and a DMS site are equipped with cameras. Locations The DMS on Elk Vale Road and the RWIS station on I-90 have cameras installed. Physical Description The cameras consist of small dome-style outdoor camera housings containing an outdoor-rated network camera with a pan-tilt-zoom mount to enable the camera to observe various points along the roadway. The cameras encode video digitally, enabling either video or still images to be transmitted over network links. Communications The cameras share the communications method with their co-located devices: the data radio network in the case of the Elk Vale Road DMS and a cellular link for the RWIS site. Control The cameras are programmed to move to a specific location and transmit a single still image on a periodic basis. Although the cameras are capable of streaming motion video, they are not used in this way due to communications bandwidth constraints. Page 2-19
47 Usage Images from the cameras are sent to a central data server where they are made available on the safetravelusa.com web site Road Closure Gates and Signs Road closure gates are used to prevent travelers from entering a roadway during dangerous weather conditions. Locations There are two road closure gates, one on the on-ramp from Liberty Boulevard to eastbound I-90 and one on the I-90 mainline to force travelers to exit onto Liberty Boulevard. A total of four road closure warning signs are installed in or near the study area, all of which are on eastbound I-90. Two (one shoulder, one median mounted) are located approximately 0.7 mile east of Liberty Boulevard, with an additional two just outside the western limit of the study area (approximately 900 feet west of Lowry Lane). Physical Description Signs: The sign installations consist of static black-text-on-white-background signs with a pair of 12-inch yellow beacons mounted in housings with black visors surrounding the beacons. Signs are mounted on I-beam supports with the bottom edge approximately 8 feet above the roadway surface. The signs are activated by using a manual switch located at the base of one of each pair of signs. No external activation or status monitoring is included. Gates: Road closure gates are manually operated with cable-winch mechanisms. No remote operation or status monitoring is available with these installations. Communications Road closure signs and gates are manually operated by SDDOT staff at the sites. No external communications are used. Control Signs and gates are operated by SDDOT staff at each device site. No remote operation is available. Usage Gates are used to prevent travelers from proceeding on eastbound I-90 when weather conditions may make travel unsafe, generally due to snow or ice. The signs are upstream of the gates and provide warning that the roadway is closed and the driver will have to exit at or before Liberty Boulevard Traveler Information (safetravelusa.com) Overview Traveler information in the study area is provided by the safetravelusa web site ( This site provides comprehensive information, including roadway conditions, roadwork, incidents, and commercial vehicle restrictions. In addition, access to the images captured by the cameras at the RWIS site and Elk Vale Road DMS are viewable through the web interface. Page 2-20

48 Description Safetravelusa.com is operated by Iteris, Inc. and provides web-based traveler information for three states. The user interface presents a map, with extent/zoom controls and a legend with selectable items that can be toggled on and off as the user desires. Clicking on a roadway will present a condition summary in the bottom pane of the page. Clicking on an icon will display more detailed information about the roadwork or blockage. Camera icons will present the still images collected from the camera in the bottom pane of the window. If a user clicks on an individual image, a larger version will appear in a new window, with a location description and weather data, if available. The user interface is shown on Figure 2-5. Figure 2-5. Statewide Traveler Information Traveler Information (511) Overview Mobile traveler information is provided through the 511 telephone number for voice-based information and the 511 mobile application. The data available through these channels is the same as through the safetravelusa.com website. Description The 511 traveler information system is operated by Iteris, Inc. that provides similar service for nine states. The telephone-based system provides a voice-prompt menu that allows users to select specific roadways of interest. The mobile applications provide a similar experience to the web site, with an interface optimized for smaller displays and touch-based interfaces. The mobile application is available for Android and Apple ios platforms and can be obtained through the Google Play store or the Apple itunes store. Page 2-21
49 2.7.8 Traffic Signals There are two intersections within the study area that are currently signalized; the intersection of Elk Vale Road with I-90 ramps at Exit 61 and the Liberty Boulevard/Tower Road intersection north of Exit 67 in the City of Box Elder. Both signals include emergency vehicle preemption. The Exit 61 ramp terminal intersection is under actuated control with video detection while the Liberty Boulevard/Tower Road intersection is pretimed ITS Needs Review of the existing ITS infrastructure in conjunction with an understanding of current operational and safety needs yielded the following list of needs and/or limitations which new or additional ITS infrastructure could assist in addressing: Safety concerns, including: Observed pattern of crashes along the WB Exit 63 on-ramp to I-90 Observed pattern of intersection-related crashes along County Highway 1416 The need for personnel to manually operate road closure gates/flashers Limited remote detection of roadway conditions, hampering the ability for emergency responders to reach incidents and/or maintenance forces to address concerns Multiple communications paths for ITS devices CCTV only supplying still images Lack of unified control interface for devices/cameras Page 2-22
50 3.0 ENVIRONMENTAL OVERVIEW An environmental overview has been completed for the environmental study area identified on Figure 3-1. As the I-90 Exit 61 to Exit 67 Corridor Study represents an early stage in the overall transportation planning process, the environmental overview has been structured to provide preliminary insight (presence or absence) into the environmental resources potentially impacted by potential future corridor solutions. Impacts have not been quantified at this stage to determine the level of impacts to each identified resource. In accordance with the corridor study scope of work, the overview of environmental resources was conducted within an environmental study area encompassing approximately 1000 feet along either side of the mainline I-90 alignment. A review of resources within the larger study area was also conducted to provide a broader context for preliminary environmental resource consideration, given the nature of the projects proposed in this report. All environmental screening has been completed using currently available geospatial databases with field verification of resources and a planning-level of conceptual design and, as a result, there may be situations where environmental resources have not been identified during this screening process. Further evaluation of each potential corridor solution will require individual environmental clearance and permitting processes. Figure 3-1 provides a map-based depiction of the environmental resources evaluated as a part of the overview. Figure 3-1. Overall Resource Map Page 3-1
51 The following resources were not evaluated in the environmental overview because they were not applicable to the environmental study area or not applicable at this point in the evaluation: Air Quality Greenhouse Gases Energy Wild and Scenic Rivers Soils and Geology Construction Water Quality Water Resources Archaeological Resources Paleontological Resources Visual Resources The environmental resources included in the overview were selected based on the characteristics of the study area, as well as input received from area resource agencies. The resources considered are generally consistent with NEPA, its implementing regulations, and FHWA guidelines. The following sections summarize resources that are considered red flag environmental resources with separate regulatory drivers, such as the Endangered Species Act (ESA) or Clean Water Act (CWA), or are typically resources of concern for the general public. For each resource, the following text and graphics describe the resource category, regulatory background, the data sources used for the screening process, existing conditions, and next steps. 3.1 Floodplains Floodplains are the lands on either side of a waterway that are inundated when a channel exceeds its capacity. Regulatory. The following regulatory requirements apply to floodplains: Executive Order (EO) 11988, Floodplain Management (1977), directs federal agencies to "provide leadership and take action to reduce the risk of flood loss, to minimize the impacts of floods on human safety, health and welfare, and to restore and preserve the natural and beneficial values served by floodplains." This EO assists in furthering the NEPA, the National Flood Insurance Act of 1968 (amended), and the Flood Disaster Protection Act of Code of Federal Regulations (CFR), Title 23 Highways, prescribes the policies and procedures that FHWA is directed to implement in the location and hydraulic design of highway encroachments on floodplains. CFR, Title 44 Emergency Management and Assistance, contains the basic Federal Emergency Management Agency (FEMA) policies and procedures to regulate floodplain management and to analyze, identify, and map floodplains for flood insurance purposes. For projects within the floodplains, local jurisdictions typically require floodplain development permits. Methodology. The 100-year floodplains and floodways were identified using FEMA digital GIS data and digital hardcopy Flood Insurance Rate Maps. Page 3-2
52 Existing Conditions. The main floodways and floodplains within the study area are those associated with Box Elder Creek and its tributaries (Figure 3-2). All floodplains within the environmental study area have been classified as Floodzone A, the area covered by a 100-year flood. Base flood elevations and flood hazard factors have not been determined. Figure 3-2. Existing Floodplain Conditions Next Steps. If, during further project-level planning processes, mitigation of impacts to floodplains becomes necessary, Box Elder Creek and its tributaries would be the most sensitive to any changes in the floodplain. These areas would require a Conditional Letter of Map Revision (CLOMR) and Letter of Map Revision (LOMR) from FEMA. Floodplain modeling would be required to assess significant changes. Some relatively small changes may be incorporated in the floodplain without triggering the CLOMR/LOMR process. Floodplain modeling would be required to assess significant changes. Engineering design should take into account the floodplain and floodway issues, as well as the location of bridges and bridge piers within the floodplain and floodway. Piers located within the floodway would require a specialized hydrologic assessment and approval by FEMA. The placement of piers within the active channel of Box Elder Creek and its tributaries will be avoided or placed in a position to reduce impacts on the stream channel, stream habitat, and biota. These mitigation strategies are not exhaustive and all listed strategies may not be appropriate for each project; further environmental study should be completed to identify specific courses of action to mitigate impacts. Page 3-3
53 3.2 Historic Resources Historic resources consist of buildings, structures, railroads, archaeological sites, and other man-made features and remains of past human activity, typically 45 years and older (constructed in 1971 or older). Historic resources are those sites that are listed or may be eligible for inclusion on the National Register of Historic Places (NRHP). Regulation. In accordance with Section 106 of the National Historic Preservation Act of 1966 (Section 106), historic resources must be identified and considered during planning for federally assisted transportation projects. Historic resources are also afforded protection under Section 4(f) of the Department of Transportation Act of Historic resources are first evaluated by defining significance, which is based on a set of four eligibility criteria outlined by the NRHP as specified in 36 CFR If a potential resource meets at least one of the four eligibility criteria, then the resource is assessed for integrity, which is the physical ability of a resource to convey its historic significance. There are seven aspects of integrity, including location, design, setting, materials, workmanship, feeling and association. Resources considered eligible to the NRHP must retain most of these seven aspects of integrity to convey significance. Integrity can be compromised if a property has been substantially altered from its historic form. Methodology. Information for this section was collected from a variety of sources, including the following: List of properties (with year constructed) from Pennington County Assessor s Office property information files; Historic and contemporary US Geological Survey topographical quadrangle maps from the Box Elder and Rapid City East quadrangle maps (1953, 1968, 1972, 1978, 1986, 2012, 2015); List of NRHP properties in Pennington County, South Dakota; Visual reconnaissance conducted through aerial photographs and an on-the-ground windshield survey; Additional records and reports from the South Dakota State Historic Preservation Office (SHPO). Existing Conditions. To provide a comprehensive record of historic properties, previously identified and potential historic sites within the study area were compiled. Previously Identified Historic Properties. For purposes of this study, only properties officially eligible for the NRHP are listed as previously identified historic sites. These sites were provided by SHPO and either deemed eligible for the NRHP or have not yet been evaluated. There are four previously identified properties including the Rapid City, Pierre, & Eastern (RCPE) Railroad, and three potential archeological sites as shown on Figure 3-3. More information is presented in Table 1 of Appendix E. Page 3-4
54 Figure 3-3. Potential Historic Properties Potential Historic Properties. Since most properties along the I-90 corridor between Exit 61 and Exit 67 have not been evaluated for historic eligibility in the past, it is important to thoroughly identify all potential historic sites along the project corridor. Potential historic sites include: Properties that have been previously evaluated but not given an official determination of eligibility by SHPO; Properties over 45 years of age that have not yet been surveyed but are based on a visual reconnaissance, appear to possess architectural qualities that may make them eligible for the NRHP under Criterion C for architectural, engineering, or artistic significance, since those are qualities of historic significance that can be visually assessed. There are approximately 70 properties identified as potentially historic most of which are houses and farms. Table 2 in Appendix E identifies which sites have the highest likelihood of being potentially historic properties along the project corridor. Next Steps. Sites identified here as potential historic resources should be evaluated for NRHP eligibility to determine historic status. Design solutions should seek ways to avoid or minimize impacts to historic resources in any way possible. For alternatives with significant impacts, provide a discussion of practicable alternatives or mitigation. Page 3-5
55 3.3 Hazardous Materials This section identifies recognized and potential environmental conditions in the environmental study area that could adversely affect any future project(s) along this segment of I-90. Regulation. Resource Conservation and Recovery Act (RCRA) (42 United States Code [USC] 6901 et seq.) This amended statute gives the U.S. Environmental Protection Agency (EPA) the authority to control hazardous waste from the "cradle-to-grave." This includes the generation, transportation, treatment, storage, and disposal of hazardous waste. RCRA set forth a framework for the management of non-hazardous solid wastes. The 1986 amendments to RCRA enabled the EPA to address environmental problems that could result from underground tanks storing petroleum and other hazardous substances. Comprehensive Environmental Response, Compensation and Liability Act (42 USC 9601 et seq.) This 1980 statute commonly referred to as Superfund established prohibitions and requirements concerning closed and abandoned hazardous waste sites, provided for liability of persons responsible for releases of hazardous waste, and established a trust fund to clean up when no responsible party could be identified. Methodology. Potential and recognized environmental conditions were evaluated using information from the EPA s Facility Registry Service (FRS). Information and site locations from the EPA s FRS were imported into a GIS map to review sites within and adjoining the environmental study area. Due to the nature of this corridor study, the environmental study area has the potential to change; therefore, hazardous material sites within a reasonable proximity of the study area were also evaluated. Sites determined to have a potential to impact future construction activities along the corridor were evaluated during a windshield survey on September 12, 2016, by Kate Oberleas and Keith Hidalgo. Existing Conditions. The highest density of development and consequently the highest potential for hazardous materials sites is located around the Elk Vale Road interchange (Exit 61). This area was almost exclusively industrial activity but has developed some commercial and residential areas over the past two decades. The industrial activity around the interchange includes oil refinery and storage, automotive repair, and a scrap yard. This area also contains a wide array of niche commercial businesses that have the potential to produce hazardous materials such as environmental services, ammunition retailer, trenchers and plows retailer, ATV retailer, auto brokers, truck equipment retailer, barricade business, appliance repairs and services, and several others. Exit 63 and Exit 67 are located in areas with significantly less development than Exit 61. Both areas are predominantly residential with light amounts of industrial and commercial activity such as auto dealers, auto repair shops, bar casinos, and gas stations. Located on the southern side of I-90 is the RCPE Railroad. Based on historical and current uses of railroad tracks, soil and groundwater contamination may exist along the railroad corridor due to undocumented events and an accumulation over time of drips, leaks, spills, and hydrocarbon exhaust residues from rail traffic. Page 3-6
56 Locations sourced from EPA s FRS data and from the on-site survey are presented in Table 3 in Appendix E and identified on Figure 3-4. The table provides a site name and address, location relative to the study area, and a description discussing why the site is a potential hazardous material concern. Figure 3-4. Hazardous Materials Sites Next Steps. Should any hazardous waste be generated during the implementation of solutions proceeding from this corridor study, the generator must abide by all applicable hazardous waste regulations found in Administrative Rules of South Dakota 74:28 and 40 CFR Part 262. If any contamination is encountered during potential construction activities, the contractor, owner, or party responsible for the release must report the contamination to the Department of Environment and Natural Resources. Any contaminated soil encountered must be temporarily stockpiled and sampled to determine disposal requirements. Felsburg Holt & Ullevig (FHU) does not assume any liability for information that has been misrepresented to use or for items not visible, accessible, or present in the project area at the time of the visual reconnaissance. FHU cannot warrant or guarantee that not finding indicators of hazardous materials means that hazardous materials do not exist within the project area. No investigation is thorough enough to preclude the presence of materials in the project area, which presently, or in the future, may be considered hazardous or may require management as a regulated material. Page 3-7
57 3.4 Wetlands & Waters of the US Wetlands in the Exit 61 to Exit 67 Study Area are primarily associated with natural drainages, ponded sites, and irrigation and roadside ditches. Regulation. Wetland resources are protected under Section 404 of the CWA (33 USC 1344). They are also protected under EO Protection of Wetlands (USEPA, 1977) when federal funding is used or where resources are located within highway right-of-way. The CWA requires coordination with the United States Army Corps of Engineers, resource agencies such as the United States Fish and Wildlife Service (USFWS), and SHPO when impacts occur to wetlands. SDDOT has incorporated this and other FHWA environmental guidance into its Environmental Procedures Manual (SDDOT, 2015), which emphasizes efforts to avoid and minimize wetland impacts. Methodology. A desktop review of available wetland mapping provided by the USFWS's National Wetland Inventory (NWI) (2016), and a review of aerial imagery was conducted. The aerial imagery was retrieved from Google Earth, which had been updated September 12, These three methods of identifying wetland features found several possible wetlands within the study area. A limited site reconnaissance of the study area examined previously identified wetlands and potential wetland areas in September Existing Conditions. Wetlands identified within the corridor by NWI or through a review of aerial imagery are riverine, freshwater pond, freshwater forested/shrub, or palustrine emergent, with most occurring along existing waterways and drainages and in roadside ditches. Most of these roadside and irrigation ditch wetlands were considered low quality wetlands due to low vegetative diversity and predominance of invasive species. The exception is wetlands associated with Box Elder Creek, which, depending on existing riparian conditions, provide a moderate quality wetland value due to higher levels of vegetative diversity and predominance toward native plants. The possible wetlands within the study area identified by the NWI were either riverine or palustrine. Palustrine wetlands can be either natural or artificially made. Riverine wetlands can be larger perennial features, like Box Elder Creek, or smaller intermittent irrigation or runoff ditches. Potential wetlands were identified through the NWI, a review of aerial imagery available, and a windshield survey. Fifty-six (56) potential wetlands were identified along the I-90 corridor, while 15 were identified along the County Highway 1416 corridor. These potential wetlands were not delineated. These sites would need to be formally delineated to meet permitting requirements dependent on the project s design. Figure 3-5 shows the identified wetlands. Page 3-8
58 Figure 3-5. Identified Wetlands Waters of the US. Box Elder Creek could be considered a waters of the U.S. (WOUS) within the CWA jurisdiction (as defined by 33 CFR Part 328). Box Elder Creek connects to Cheyenne River to the east, which then flows into the Missouri River. The specific WOUS indicators include Relatively Permanent Waters (RPWs) that flow directly or indirectly into a Traditional Navigable Water (TNW) and wetlands directly abutting RPWs that flow directly or indirectly into a TNW. Any wetlands identified directly abutting these RPWs would likely be considered jurisdictional as well. Next Steps. A wetland delineation should be conducted during the NEPA phase of the project to ensure that all areas preliminarily identified here actually contain all three requirements of a wetland. When wetland impacts cannot be avoided through design, adequate time must be built into the design schedule to allow for a wetland delineation and consequent permitting and mitigation. 3.5 Wildlife/Threatened and Endangered Species Wildlife is an important natural resource that warrants consideration during federally funded projects and is documented during the NEPA process. Regulation. Various federal laws have been established to protect wildlife, including the ESA, the Migratory Bird Treaty Act and the Bald and Golden Eagle Protection Act. Page 3-9
59 Methodology. Details and characteristics of wildlife resources in the study area were identified using existing GIS data and field verified (September 2016). Additional inventory details about the resources, such as protection status and presence of species were obtained from accessing the USFWS Information, Planning, and Conservation website, the South Dakota Game, Fish, and Parks (SDGFP) website, and the South Dakota Wildlife Action Plan in September Information on the project ecoregion was obtained from the United States Forest Service Ecosystem Provinces website. Research was centered on utilizing the most current version of information available online. Existing Conditions. The study area is located along the existing I-90 corridor just to the east of Rapid City. Generally, the study area is within the Great Plains Palouse Dry Steppe Province ecoregion. This region is characterized by rolling plains and tablelands of moderate relief, and the plains are noticeably flat with occasional valleys, canyons, and buttes. The study area consists of open fields, grazing pastures, and residential/ industrial/commercial developments throughout the corridor. There are numerous drainages throughout the study area, including Boxelder Creek and multiple unnamed drainages. Additionally, there is one park (Boykin Park) located within the study area. The existing roadways and the pockets of urban development significantly limit the habitat potential for wildlife. However, wetlands, streams, ponds, ditches, and other drainages provide low to medium habitat potential for wildlife habitat. The vegetation would be considered a shortgrass prairie, which is a formation class of short grasses usually bunched and sparsely distributed, and there are scattered trees and shrubs, primarily in riparian areas. Special Status Species. A complete list of federal and state-listed species, including state species of special concern that can be found in Pennington County (USFWS, 2014; SDGFP, 2016; South Dakota Wildlife Action Plan, 2014), is presented in Table 4 of Appendix E. Threatened and Endangered Species. There are numerous threatened and endangered species with potential suitable habitat in the study area. Federal and state threatened and endangered species were identified to have potential habitat present in the project area or provide water downstream to other important habitat for the following species: northern long-eared bat, swift fox, peregrine falcon, longnose sucker, and sturgeon chub. The primary drainages that were identified from the field survey and which contained suitable habitat for these species include Boxelder Creek and multiple unnamed drainages. Migratory Birds, Including Raptors. No nests were noted during the brief field survey conducted in September Next Steps. A detailed survey recommended for the species listed above to identify the presence or absence of these species in the study area. Although no nests were noted during the brief field survey conducted in October 2016, it is probable that migratory bird and raptor nests are present within the study area. Suitable habitat is present within the study area, particularly along drainages and under bridges and culverts, for numerous migratory birds and raptors; therefore, detailed migratory bird and raptor surveys would be required prior to construction of the project. Page 3-10
60 3.6 Section 4(f) Section 4(f) resources include publicly owned parks, recreational facilities, wildlife and waterfowl refuges, and public and private historic sites. Regulation. Section 4(f) stipulates that FHWA and other United States Department of Transportation (DOT) agencies cannot approve the use of land from publicly owned parks, recreational facilities, wildlife and waterfowl refuges, or public and private historic sites unless there is no feasible and prudent alternative to the use of the land and unless the action includes all possible planning to minimize harm to the property resulting from use. Methodology. A Google search was performed to determine if any parks and recreational areas or wildlife and waterfowl refuges were located within the environmental study area. Agency websites were consulted and compared with Google Maps. Websites consulted included the following: South Dakota Game Fish and Parks: National Park Service Bureau of Land Management US Forest Service Rapid City Municipal Parks Existing Conditions. Two park properties, Boykin Park and the Box Elder Ballpark, were discovered within or adjacent to the environmental study area. They are depicted on Figure 3-6. Page 3-11
 Resources Boykin Park is a publicly owned park, located in a")


61 Figure 3-6. Section 4(f) Resources Boykin Park is a publicly owned park, located in a residential neighborhood at the intersection of Tuscany Drive and Tanglewood Lane just east of West Gate Road and north of I-90. The park includes green space, basketball courts, picnic shelter, and a playground. Box Elder Ballpark includes four baseball fields and is located south of County Highway 1416 South along Ellsworth Road. Boykin Park is a Section 4(f) resource Box Elder Community Park and Ballfields Page 3-12
62 Next Steps. If, during the project development processes, parks, trails, or open space are impacted, the next steps of the Section 4(f) process require evaluations of publicly owned parks, trails, and open space lands to be conducted to determine if there are any properties that qualify for protection under Section 4(f). The law says that FHWA (and other DOT agencies) cannot approve the use of land from publicly owned parks, recreation areas, wildlife refuges, or historic sites unless there is no feasible and prudent alternative to the use and the action includes all possible planning to minimize harm to the property. The substantive provisions of Section 4(f) apply only to agencies within the USDOT. A Section 4(f) evaluation would be required for the conversion of any publicly owned parks, trails, or open space lands for transportation improvements. 3.7 Section 6(f) Section 6(f) of the Land and Water Conservation Act requires that the conversion of lands or facilities acquired with LWCF Act funds be coordinated with the Department of Interior. Usually replacement in kind is required. Regulation. The LWCF Act of 1965 established a federal funding program to assist states in developing outdoor recreation sites. Section 6(f) of the Act prohibits converting property acquired or developed with these funds to a non-recreational purpose without the approval of the NPS. Evaluation of Section 6(f) properties is completed for the following reasons: To preserve the intended use of public funds for land and water conservation; To comply with several legal mandates that pertain to the LWCF and Section 6(f). Section 6(f) of the Act assures that once an area has been funded with LWCF assistance, it is continually maintained for public recreation use unless the NPS approves a substitute property of reasonably equivalent usefulness and location and of at least equal fair market value. Methodology. Information from SDDOT was referenced to identify Section 6(f) properties potentially located near the study area. The Section 6(f) properties identified were crossreferenced with Google Earth to identify the Section 6(f) properties located within the study area. Existing Conditions. According to SDDOT information, two 6(f) properties are located within or adjacent to the environmental study area. One property is located at the northeast corner of Ellsworth Road and I-90. This parcel appears to be vacant land. No other information was available at the time of this report. Further investigation is recommended to determine if this parcel qualifies as a Section 6(f) property. Box Elder Ballfields are located adjacent to the environmental study areas at the southwest corner of County Highway 1416 and Ellsworth Road is a Section 6(f) property. LWCF funding was used to construct the ballfields. Figure 3-7 depicts these properties. Page 3-13
63 Figure 3-7. Section 6(f) Properties Next Steps. For Section 6(f) properties located in the areas of the improvements, alternatives should be designed to avoid a conversion of these properties. If a conversion of land cannot be avoided, efforts will be made to mitigate effects to these properties. SDDOT, in cooperation with the local government landowner, must identify replacement land of equal value, location, and usefulness before a transfer of property under Section 6(f) can occur. 3.8 Noise Construction and routine operation of transportation projects can affect noise levels. Highway traffic noise is a major contributor to overall transportation noise. When established noise limit thresholds are exceeded from road improvements, noise abatement measures may be necessary. Regulation. Transportation improvement projects with a federal nexus must comply with noise regulations of the relevant federal agency. For this project, the applicable agency is FHWA and the noise regulations are contained in CFR Title 23 Part 772. SDDOT has adopted and implemented those regulations for South Dakota through the Noise Analysis and Abatement Guidelines (SDDOT, 2011). Methodology. The study corridor was reviewed for noise-sensitive receptors within 300 feet of concern from the primary project roads (I-90, Elk Vale Road, Liberty Boulevard). The identified receptors are those expected to have outdoor activity areas that receive frequent human use; i.e., yards, playgrounds, trails, dining patios, etc. The results below do not mean the receptors are or will be impacted by noise; rather, these are areas that should receive attention Page 3-14

64 during the project development and may be candidates for avoidance/minimization actions. SDDOT s Noise Abatement Criteria are presented in Table 1. Existing Conditions. Locations of noise sensitive areas are shown on Figure 3-8 and presented in Table 2 of Appendix E. Figure 3-8. Noise Sensitive Areas Ellsworth AFB, located just north of the project area has developed an AICUZ study. The AICUZ is intended to identify and restrict land uses in locations that might obstruct or otherwise be hazardous to airfield operations and identify land areas which are exposed to health, safety, or welfare hazards due to airfield operations. The AICUZ identified noise zones and compatible land uses within those zones. Next Steps. A full evaluation of traffic noise following the Guidelines (Figure 1) will likely need to occur later in the project development process because some improvement(s) ultimately recommended through the corridor study likely will be Type I and require a traffic noise analysis. Depending on project location, coordination with Ellsworth AFB may be required. Page 3-15
65 3.9 Environmental Justice EJ is the fair treatment and meaningful involvement of all people regardless of race, color, national origin, or income, with respect to the development, implementation, and enforcement of environmental laws, regulations, and policies. Regulation. In compliance with EO 12898, SDDOT is required to promote the fair treatment and meaningful involvement of minority and low-income populations in the decision-making process for transportation programs and projects. The EO requires federal agencies to achieve EJ by ensuring that minority and low-income communities receive an equitable distribution of benefits from transportation activities without suffering disproportionately high and adverse effects. Methodology. Details addressing how minority and low income populations are identified are included in the following sections. Minority Populations. As defined in FHWA Order A (2012), a minority is a person who is Black, Hispanic or Latino, Asian American, American Indian or Alaskan Native, or Native Hawaiian or Other Pacific Islander. In accordance with Council on Environmental Quality s (CEQ) EJ guidance (1997), minority populations must be considered for EJ where either: the minority population of the affected area exceeds 50 percent, or the minority population percentage of the affected area is meaningfully greater than the minority population percentage in the general population. This analysis is completed using US Census Bureau data. Low Income Populations. Low income populations, as defined in FHWA Order A (2012), occur where any readily identifiable group of low income persons live in geographic proximity. Areas in which the percentage of low income families exceeds the countywide percentage are considered specifically in EJ analysis. Identification of low income populations is completed using Department of Health and Human Services poverty guidelines, Housing and Urban Development income limits, and US Census Bureau data. Existing Conditions. Results of the analysis to identify minority and low-income populations in the study area are presented in the following sections. Minority Populations. Within and around the study area, the concentrations of minority populations range from about 5 to 47 percent based on 2010 Census data. Because the Census data does not demonstrate a minority population exceeding 50 percent, a comparison to the general population is used for this analysis. The State of South Dakota has a 14 percent minority population and Pennington County has a 16.4 percent minority population. About onehalf of the study area contains minority population concentrations that exceed 16.4 percent. Based on that finding, an evaluation of potential project impacts to minority populations would be necessary. Figure 3-9 shows these minority populations. Page 3-16

66 Figure 3-9. Minority Populations Low Income Populations. In terms of low income populations, the percent of people living below the poverty level in Pennington County was about 17 percent between 2009 and This percentage serves as the threshold by which Census Block Groups are compared. During that same time period, low income percentages ranged from 14 to 96 percent at the Census Block Group level within and around the study area. Most of the Census Block Groups that intersect the study area contain higher percentages of families living below the poverty level. Only one Census Block Group at the very western edge of the study area and south of I-90 does not exceed the low-income threshold of 17 percent. The areas north of I-90 and most areas south of I-90 do contain percentages of low income families that would warrant further EJ analysis. Based on that finding, an evaluation of potential project impacts to low income populations would also be necessary. Figure 3-10 illustrates these low-income populations. Page 3-17

67 Figure Low-Income Populations Next Steps. Census blocks with a higher percentage of minority and low-income populations should be evaluated for disproportionately high and adverse effects and selected for outreach and engagement in implementing a given project. Impact analysis may include but not be limited to considering whether the following impacts might occur: Displacement of community facilities and public services (e.g., schools, places of worship, community centers, and grocery stores) important for maintaining community cohesion Relocations of residences and businesses in low-income and/or minority areas and/or displacement of businesses that provide jobs in minority and/or low-income areas Changes in the natural and man-made environment that would have an impact on minority and/or low-income populations According to the SDDOT s Environmental Procedures Manual (2015), the following steps occur in the preconstruction phase of a project: Identify existing minority or low income populations Determine if there is an adverse impact on the population Evaluate avoidance, minimization and mitigation alternatives Document in project file and applicable NEPA document Page 3-18

68 Additionally, the opportunity for EJ populations to participate fully in the decision-making process must be provided Cumulative Impacts A cumulative impact analysis was conducted for most of the evaluated environmental resources encompassing the study area and surrounding neighborhoods as shown in the map below. The identified areas of particular concern within the study area were land use (growth), wildlife, wetlands, and historic properties and districts. The following summarizes the cumulative impacts analysis. Regulation. NEPA and its implementing regulations require federal agencies to identify and analyze the direct, indirect, and cumulative impacts of a proposed action in sufficient detail to make an informed decision. Cumulative impacts result when the impacts of an action are added to or interact with the impacts of other actions in a particular place and within a particular time. It is the combination of these impacts, and any resulting environmental degradation, that is the focus of the cumulative impact analysis. While impacts can be differentiated by direct, indirect, and cumulative impacts, the concept of cumulative impacts takes into account all disturbances because cumulative impacts result in the compounding of the impacts of all actions over time. The cumulative impacts of an action can be viewed as the total impacts on a resource, ecosystem, or human community of that action and all other activities affecting that resource no matter what entity (federal, non federal, or private) is taking the action. Methodology. The methodology for the cumulative impacts analysis is summarized in 5 steps as follows: 1. Define the geographic limits of the analysis the community study area for the cumulative impacts analysis is presented above. The community study area includes neighborhoods adjacent to and near the project area. 2. Define the temporal limits of the analysis The starting point for the analysis is 1942 when Ellsworth AFB was constructed. I-90 was constructed nearly 20 years later in Page 3-19
69 The construction of the AFB and I-90 affected the composition of the community and its resources regarding land use. The future horizon year is 2040, which is based on the 2040 Rapid Trip Report. 3. Identify past, present, and reasonably foreseeable future actions The current and reasonably foreseeable projects that were considered for cumulative impacts are presented in Tables 7 and 8 of Appendix E. 4. Determine the resources affected by the actions Key resources to be considered as part of the cumulative impacts analysis were identified on the basis of the direct and indirect impacts of the Proposed Action and the potential for impact of other actions on the resources. The key resources include: Land Use EJ Noise Wetlands Historic Wildlife Land Use. Settlers arrived in the Rapid City area around 1874 when gold was discovered in the Black Hills. In the early twentieth century, the Study Area mostly contained small farming or mining communities. Population growth and increased water availability contributed to the expanding development that occurred throughout the 1940s and 1950s as communities began to devote more agricultural land to residential and employment uses. Ellsworth AFB was constructed in 1942 and grew to be among the largest employers in the area. Construction of I-90 then followed in the early 1960s. By the time the final segment was completed in 1968, low-density, suburban residential development was expanding outward from major city centers along the highway. Expansion of I-90 helped spur development along the corridor and contributed to land use change in the years that followed. Predominant land uses within the study area are agricultural, residential, military and commercial. Land uses along the Exit 61 to Exist 67 study area vary from predominantly agricultural land in the north and south to suburban commercial, retail, and residential uses along I-90. The Rapid City area has seen a moderate amount of growth, which is forecasted to remain steady as the economy continues to grow. While residential development has been proposed and approved, municipalities along the corridor are planning for a mix of land uses along the I-90 corridor. Based on the near-term planned development, it is expected that the general pattern of urbanization will continue along the Exit 61 to Exit 67 study area and more agricultural land will be converted for employment and residential uses. This pattern of growth is expected to occur regardless of whether the improvements considered in the Exit 61 to Exit 67 study area are implemented. It is likely that major impacts resulting from development are increased impervious surfaces (for example, roads, driveways, rooftops, parking lots), loss of agricultural lands, loss and fragmentation of wildlife habitat, degradation of air and water quality, loss of wetlands and aquatic resources, and stress on infrastructure, water availability, and water supply. Page 3-20
70 If none of the proposed projects are constructed, anticipated development along I-90 would continue based on market forces and in accordance with city and county plans. Conversion of agricultural and open lands into urban uses will continue regardless of whether the proposed improvements are implemented or not. The construction of the proposed alternatives will not contribute noticeably to cumulative land use impacts in comparison to what is already anticipated through land development projects and other roadway improvements. Preliminary conclusions will be further assessed and confirmed in the future during NEPA analysis. EJ. Over half of the neighborhoods in the community study area generally have larger proportions of minorities and larger proportions than the State of South Dakota as a whole. Only one neighborhood in the study area is not considered low-income. The investment in transportation facilities will improve traffic operational performance, decrease the probability of crashes, and improve mobility within the community study area, which would benefit transit-dependent populations and provide more convenient and faster transit access to employment opportunities and services throughout the Rapid City region. The proposed projects and other local transportation projects could require the additional displacement of minority owned businesses and businesses that provide goods and services to the local neighborhoods. Noise. The overall ambient noise at a given location depends on the noise from multiple sources. However, noise impacts decrease with distance so that the closest major sources often predominate. Noise concerns and monitoring have emerged relatively recently; therefore, it is difficult to establish how noise levels may have changed over the last several decades. Traffic has increased on highways and local streets, but vehicles have become quieter over time. In addition, noise from other sources, such as industrial sites, may have changed over time as site uses have changed. Overall, proposed projects are not expected to have an adverse cumulative impact on noise within the community study area because of the localized nature of noise impacts. Additionally, traffic noise barriers could be constructed in certain areas in the community study area if warranted by future noise studies. Increases in transportation and development resulting in an increase in noise would occur at some locations within the area regardless of whether the potential projects are constructed. Major noise sources that exist currently or will occur in the future are based on land use patterns. Improvements or changes in operations at Ellsworth AFB will affect noise in neighboring areas. Wildlife. Past actions affecting wildlife distribution and movement corridors in the Exit 61 to Exit 67 study area include commercial and residential development, road construction, and mining. These activities have directly displaced wildlife habitat, increased habitat fragmentation, and altered wildlife movements. In general, the amount and connectivity of wildlife habitat have declined in the regional study area since the twentieth century. Page 3-21
71 Land uses that provide habitat for wildlife include agriculture, open space, parks, surface water areas, and vacant lands. Residential and commercial land uses are less likely to provide habitat for wildlife because they are more developed. Lands protected or enhanced for wildlife would help to offset some of the impacts of overall habitat loss. General wildlife habitat in the Exit 61 to Exit 67 study area would be expected to decline with highway expansion, residential and commercial development, and the decrease of open lands used for agriculture. Residential and commercial development also will contribute to habitat fragmentation and further reduce open areas used as movement corridors by wildlife. The proposed projects would widen and extend culverts and bridges. While widening would facilitate wildlife movement, extending the length of a culvert or bridge would lengthen the distance wildlife would have to travel to cross I-90 and surrounding areas. Planned transportation and development actions would contribute to further loss and degradation of wildlife habitat within the Exit 61 to Exit 67 study area. This would occur regardless of whether the proposed projects are implemented, resulting in cumulative impacts on wildlife, wildlife habitat, and other biological resources in the Exit 61 to Exit 67 study area. Wetlands. Wetlands in the Exit 61 to Exit 67 study area are primarily associated with natural drainages, seep areas, ponded sites, and irrigation and roadside ditches. Although there is no concise inventory of historical wetlands in South Dakota, national estimates, taken from data collected by the NWI in conjunction with status and trends reports, have shed some light on wetland loss and degradation. Rapid urbanization, mining, and agriculture have had a great impact on wetlands in the regional study area since Planned development is likely to result in further direct and indirect impacts on wetland communities. If none of the proposed Exit 61 to Exit 67 projects are constructed, wetland degradation and loss are anticipated to continue as growth and development continue to occur in undeveloped areas. The proposed projects would have a direct impact on wetlands and other waters of the US. Impacts on any jurisdictional wetlands would be mitigated on a onefor one basis, resulting in no net loss of jurisdictional wetlands. Historic. In the early twentieth century, most of the Exit 61 to Exit 67 study area was used for agricultural and coal mining purposes. As the automobile and tractor started replacing the horse and carriage, roads were built. Road access facilitated additional development. Much of the new development was auto related with service stations and restaurants built to serve the motoring public. Small settlements established throughout the region served as supply and social centers, as well as produce shipping points for dispersed farms. The 1940s to 1960s brought the construction of I-90, Ellsworth AFB and more commercial and residential development. These developments put pressure on many of the roads that were never envisioned to carry the amount of traffic generated by larger scale development. As land becomes more valuable for development, farmers are increasingly pressured to sell or develop their land. Page 3-22
72 If none of the proposed projects are constructed, the conversion of the remaining historic farmsteads into urban development would continue in accordance with local development plans. Traffic and congestion within the study area would continue to increase and would result in an increase in noise, air emissions, and visual obstructions affecting historic properties and districts. Planned growth within the I 90 corridor would result in more traffic through some historically smaller communities. Cumulative impacts on historic properties and districts have occurred and will continue to occur in the study area due to the conversion of agricultural lands and farmsteads to urban land uses and limited local historic preservation regulations. Planned transportation and development actions will, over time, result in the additional loss of historic properties and will alter the historic character of small farming communities. These impacts will occur regardless of whether proposed projects are implemented. The construction of the proposed projects would not contribute to cumulative impacts on historic resources in comparison to what is already anticipated through land development projects and other roadway improvements. 5. Assess the cumulative impacts of the actions Based on information identified during the Exit 61 to Exit 67 process, it not anticipated that the proposed projects would substantially contribute to cumulative impacts when combined with other past, present, and reasonably foreseeable projects. Page 3-23
73 This page intentionally left blank. Page 3-24
74 4.0 YEAR 2045 TRAFFIC CONDITIONS The land in the study area is relatively undeveloped and could experience new development in coming years. The City of Box Elder, which has jurisdictional control over most of the land in this area, is expected to continue to see residential growth that will be complemented by new activity in commercial and light industrial uses. 4.1 Future Roadway Network The City of Box Elder recently completed the BESTPlan (Box Elder Strategic Transportation Plan) that identifies a series of potential new roads and connections to support future development and to create a more integrated transportation system network. The Year 2040 RCAMPO Fiscally Constrained Plan that identifies transportation projects in the MPO area does not include new roadway connections in the study area. However, the City of Box Elder continues to leverage development opportunities to build new roadway connections. The City is currently developing plans to extend Mall Drive east and connect to the North I-90 Service Road. If constructed, the Mall Drive extension would provide a continuous surface street roadway connection that parallels I-90 between West Gate Road and Elk Vale Road. 4.2 Growth Projections Figure 4-1 shows land use forecasts in the study area. These forecasts are developed by the RCAMPO and are considered the adopted land used forecasts for the area. As shown, regionwide households are expected to increase by about 40 percent and employment is expected to increase by about 70 percent. However, in the study area more robust growth is forecasted. Households are expected to more than double by the forecast Year of 2045 and employment is expected to increase by a factor of 3.6. Page 4-1

75 Figure 4-1. Year 2045 Land Use Forecasts Page 4-2
76 4.3 Projected Traffic Conditions The basis for projected traffic volumes is the Year 2045 land use forecasts. These totals were paired with the Fiscally Constrained roadway network (existing roadways plus cost-feasible projects included in RapidTRIP 2040) and the TransCAD computer modeling software was run to produce raw Year 2045 traffic volume forecasts. Following the methods outlined in National Cooperative Highway Research Program Publication 765, these raw forecasted traffic volumes from the model were adjusted up or down based on the relationship between current traffic counts and base year (2013) model estimates. Further adjustments were made to balance traffic volumes through corridors and to ensure that all roadway segments grow by a reasonable amount Corridor Traffic Forecasts Two alternate future growth scenarios were developed for consideration: one scenario assumes that zero growth will occur in Ellsworth AFB population, and the other assumes that current base population roughly doubles by the Year Ellsworth AFB personnel indicated that the base is equipped to accommodate growth of this magnitude and it is reasonable to anticipate such growth. Using these two growth scenarios, Year 2045 daily traffic volume forecasts were developed using the methodology described above. Figure 4-2 and Table 4-1 depict Year 2045 daily traffic volumes for the two Ellsworth AFB growth scenarios alongside current traffic levels. These forecasts represent a corridor no action scenario wherein no projects beyond the RapidTRIP 2040 Fiscally Constrained plan are included in the model. As shown, the highest growth factors in the study area occur along Elk Vale Road and Liberty Boulevard. Forecasts on these roads range are 2.5 to 3.1 times higher than current traffic levels. Growth throughout the rest of the study area varies, with most roadway daily traffic volumes anticipated to grow by approximately 20 to 70 percent without Ellsworth AFB growth and 40 to 90 percent with Ellsworth AFB growth. The purpose in adjusting Ellsworth AFB personnel was to understand the impact of the base on future traffic volumes. The analysis shows that doubling of Ellsworth AFB personnel does not significantly change forecasts for roadways that do not directly access the base such as Elk Vale Road and I-90 east of Exit 63. However, for roadways that feed directly or indirectly to base gates, forecasts are shown to be 20 to 30 percent higher on roadways such as Ellsworth Road, Liberty Boulevard, and County Highway Based on these findings, the SAT gave direction to base all Year 2045 forecasts on the Ellsworth AFB Growth Scenario. Page 4-3
77 Figure 4-2. Corridor Traffic Forecasts Page 4-4
78 Table 4-1. Traffic Growth by Roadway Roadway Existing Year 2045 No Ellsworth AFB Growth Growth Factor from Existing Year 2045 Ellsworth AFB Growth Growth Factor from Existing Difference Between Ellsworth AFB No Growth and Growth Elk Vale Road North of I-90 5,600 15, , Elk Vale Road South of I-90 17,500 40, , I-90 Between Exit 61 and 63 29,800 42, , I-90 Between Exit 63 and 13,350 22, , Exit 67 County Highway ,300 17, , Ellsworth Road 6,380 9, , Liberty Boulevard 4,115 10, , External Roadway Connection Scenarios In addition to understanding the impact of Ellsworth AFB on long-range traffic forecasts, the project team was interested in knowing the impact of new roadway connections to key study area roadways. A total of eight external roadway connections were evaluated independently of each other scenario. In other words, proposed future connections were not combined with other connections in evaluating the impact of new external roadways. Figure 4-3 shows a series of daily traffic forecasts with different roadway connections. Findings from this analysis include the following: Along I-90 between Exit 61 and 63 the traffic forecast for most external connection scenarios is within 10 percent of the base model forecasts. The exception to this general finding was the scenario with the removal of Exit 63. The Cheyenne Boulevard connections reduce traffic forecasts on Elk Vale Road by about 5 to 10 percent and on County Highway 1416 by 10 to 35 percent. All external connections have a minimal impact on forecasts for Ellsworth Road and Liberty Boulevard. This analysis shows that external connections do not have significant impacts to forecasts for I-90, Elk Vale Road, and County Highway In addition, the base model traffic forecasts are the highest for these key study roadways. In conclusion, the base model and model runs for alternatives will not include any new roadway connections unless the roadway connection is an integral part of an interchange alternative. Page 4-5

79 Figure 4-3. External Roadway Connections Scenarios Page 4-6
80 4.3.3 Year 2045 No Action Traffic Volumes Based on these analyses of the Ellsworth AFB growth and external roadway connections, Year 2045 No Action traffic volumes were developed at study intersections and along mainline I-90. Figure 4-4 depicts No Action Year 2045 forecasts. As shown, I-90 daily traffic forecasts are 47,000 to 48,000 vpd west of Exit 63 and are 50 percent lower east of Exit 63. With I-90 forecasts only approaching 50,000 vpd, it suggests that widening to six lanes is not necessary by Year County Highway 1416 daily forecasts are over 20,000 vpd west of Commercial Gate, suggesting County Highway 1416 should remain four lanes. East of Commercial Gate daily traffic forecasts drop to 14,400 vpd. Along other roadways in the study area, forecasts are much higher than existing traffic volumes. For example, Liberty Boulevard forecasts are more than three times existing traffic volumes, Ellsworth Road forecasts are nearly double existing traffic, and Elk Vale Road forecasts south of I-90 are more than double existing traffic volumes. 4.4 Projected Year 2045 No Action Traffic Operations Using 2045 No Action peak hour volumes LOS s were evaluated at study intersections and along mainline I-90. Figure 4-5 provides a summary of Year 2045 No Action traffic operations in the study area with the following sections describing key findings I-90 Mainline Operations In general, I-90 mainline operations are anticipated to be LOS C or better during the peak hours. Table 4-2 lists LOS s for I-90 segments between interchanges and with four general purpose lanes, the mainline levels of service are LOS C or better on every I-90 segment in the corridor. Table 4-2. Year 2045 Mainline I-90 Operations Year 2045 No Action Operating Conditions I-90 Segment (note: LOS is lowest rating of either direction) AADT LOS- AM Peak LOS PM Peak West of Exit 61 48,100 C C East of Exit 61 46,500 C C East of Exit 63 24,000 B B East of Exit 67 14,950 A A Page 4-7

81 Figure 4-4. Year 2045 No Action Traffic Volumes Page 4-8

82 Figure 4-5. Year 2045 Projected Level of Service Page 4-9
83 4.4.2 I-90 Ramp Merge / Diverge Operations Table 4-3 and Figure 4-5 show Year 2045 No Action ramp merge/diverge levels of service. Similar to the mainline operations, all ramp merge/diverge points are expected to operate at LOS C or better during the peak hours. Table 4-3. Year 2045 Interchange Ramp Merge/Diverge Level of Service On-Ramps Off-Ramps Interchange Direction AM Peak PM Peak AM Peak PM Peak Direction Hour Hour Hour Hour Exit 61 EB B B EB B C WB C B WB C C Exit 63 WB C C EB C C EB (SB) B B Exit 67 EB A A EB (NB) B B WB B B WB A A Intersection Level of Service In general, signalized intersections are anticipated to operate at LOS D in the peak hour although a few individual movements may operate at LOS E or F. At stop-controlled intersections, it can be expected that turn movements from the stop-controlled approach will operate at LOS F in the peak hours. In these cases, either a change in traffic control or the implementation of turn restrictions would address the LOS F conditions. The following sections discuss key findings in relation to potential operational issues and possible mitigation measures. Elk Vale Road / I-90 Ramp Terminal: The overall LOS of the ramp terminal is expected to be LOS D in AM and LOS E in the PM peak hours for the future Year This analysis removes the off-ramp right-turn movements to Elk Vale Road since vehicles in these movements essentially bypass the traffic signal at the ramp terminal. These right-turn movements have yield control but since the HCM does not have a methodology for evaluated yield control, these movements were analyzed with stop-control in this analysis. In using this approach, it was found that in Year 2045 the eastbound right-turn movement from the ramp to southbound Elk Vale Road is anticipated to operate at LOS F during both peak hours. Recommended mitigation: Northbound and southbound exclusive right turn lanes with signal timing improvements by Year These improvements would improve the Year 2045 intersection operations for the PM peak hour from LOS E to LOS D. The Year 2045 AM peak hour LOS would still be LOS D. Southbound lane added on Elk Vale Road beginning at the westbound off-ramp and extending to Cheyenne Boulevard by Year This would facilitate the free movement of eastbound to southbound traffic and mitigate the anticipated LOS F conditions. Page 4-10
84 Elk Vale Road/South I-90 Service Road: This intersection operates with stop control on the service road approaches. For both existing and future Year 2045 conditions, vehicles turning left from the service road to Elk Vale Road experience high delay and LOS F conditions in both peak hours. In addition, left-turn movements from the service road present a safety issue with potential broadside crashes. Recommended mitigation: Restrict the intersection to right turns only. Based on existing conditions this improvement should be implemented in the near term. Elk Vale Road / Mall Drive: By Year 2045 the stop controlled approaches of Mall Drive and the driveway access on the east side of the intersection operate at LOS F during both peak hours. Recommended mitigation: Signalization of the intersection when traffic volumes meet signal warrants. It is likely signalization would be needed when the City of Box Elder extends Mall Drive east from Elk Vale Road. New intersection lanes needed include dual northbound left turn lanes, and a second southbound through lane, and a free right-turn movement from westbound Mall Drive to southbound Elk Vale Road. Assuming the Mall Drive connection is realized in the next five to ten years, then these improvements are anticipated to be needed by Year The intersection with these new intersection lanes would result in LOS C conditions in Year 2045 for both peak hours. County Highway 1416 / Radar Hill Road: Planned geometric improvement to eliminate the median and signalization allows this intersection to operate at LOS B during both peak hours in Year County Highway 1416 / Ellsworth Road: Stop-controlled movements at the eastbound and westbound County Highway 1416 intersections at Ellsworth Road are expected to experience LOS F conditions in Year This is primarily due to the heavy left-turn movement moving from eastbound to northbound. Recommended mitigation: Eliminate the median area on County Highway 1416 to create a single intersection similar to the planned improvements at Radar Hill Road. Signalize the intersection when signal warrants are met. It is anticipated that these improvements will be needed by Year 2035 and would result in LOS B conditions in Year 2045 for both the AM and PM peak hours Page 4-11
85 This page intentionally left blank. Page 4-12
86 5.0 SOLUTIONS Chapter 5 describes the alternative analysis for the study of interchange configurations at Exit 63. The SAT developed interchange alternatives to provide full access to I-90 for the Exit 63 interchange and evaluated these alternatives using screening criteria that included two levels of screening. This chapter describes the study approach, alternatives development, and alternatives screening. 5.1 Description of Solutions Process Project Scoping The SAT conducted a project brainstorming session as an initial step in alternative development. Building on previous planning efforts such as the BESTPlan and the SDDOT Decennial Study and on existing and future traffic conditions, the brainstorming session focused on local issues associated with transportation in the study area. In this half-day brainstorming session, the SAT expressed the following themes related to transportation and communityrelated issues. Improve traffic flow and safety along Elk Vale Road Provide for the continuous flow of Ellsworth AFB traffic to and from I-90 Provide a full movement interchange at Exit 63 Improve safety in the study area both at intersection and along I-90 Consider AICUZ compliance in evaluation of alternatives Maintain sufficient capacity along the I-90 corridor Project Solutions Process In response to transportation deficiencies and project needs, the SAT developed a comprehensive list of improvement solutions to target the transportation and community related issues identified during project scoping. The process for categorizing and identifying potential solutions is represented by the process shown on Figure 5-1. The process began with developing a comprehensive list of corridor solutions and categorizing these into groups for further study and evaluation. As shown, solutions were categorized into the following groups of solutions. I-90 Mainline: SDDOT plans to reconstruct the pavement of I-90 between Exit 61 and Exit 63 by the year Solutions were based on the need to evaluate different approaches to the pavement reconstruction effort to accommodate the potential for widening between Exit 61 and Exit 63. Exit 63 Reconstruction: The current Exit 63 interchange is not a full movement interchange. Solutions were based on the basic need to provide full movement access at Exit 63 to I-90, either at the existing Exit 63 location or at a nearby cross street. ITS Components: Various ITS devices exist in the I-90 corridor. Solutions focused on enhancing this existing system and addressing safety issues in the corridor. Page 5-1

87 Figure 5-1. Solutions Process Other Projects: Based on Year 2045 traffic volumes there will be other deficiencies in the transportation system. Other project solutions are traffic control and capacity improvements at intersections to mitigate these future deficiencies. External Scenarios: These are new roadway connections and network enhancements that are independent of solutions in the other groups of solutions but, if implemented, would impact traffic operations along I-90 and at study intersections. Page 5-2
88 5.1.3 Screening Criteria The development of solutions primarily applied to the Exit 63 reconstruction as the focus was to evaluate different interchange alternatives that provided full movements to and from I-90. To evaluate the feasibility of interchange alternatives, a set of screening criteria was established to evaluate the performance of each alternative relative to the other alternatives. Table 5-1 describes the screening criteria used to evaluate Exit 63 alternatives that were generally organized around the following categories: Ellsworth AFB impacts Physical impacts Compatibility with Existing Plans Construction Phasing and Implementation Design Criteria Public Comment Table 5-1. Alternative Evaluation Categories and Criteria Category Ellsworth AFB Impacts Accident Protection Zone Conflicts Facilitates Movements to Ellsworth AFB Physical Impacts Environmental Private Property and Right-of-Way Compatibility with Existing Plan Accommodates Approved Plans Compatibility with JLUS Construction Phasing and Implementation Constructability Implementation Design Criteria Connectivity to Existing Infrastructure Criteria What is the proximity of the alternative to the Ellsworth AFB accident protection zone? Does the alternative facilitate the movement of Ellsworth AFB personnel to and from Commercial Gate Road? Alternatives with the fewest number of turns received higher scores but increases in the number of inbound turns scored lower. What are the impacts to known environmental receptors including floodplain, noise and impacts to minority and low-income populations? The higher the score the less impact but alternatives impacting minority and low-income populations scored lower overall. What is the impact to private property parcels in relation to buildings, land, and access to adjacent roadways? The more parcels impacted, the higher the score. Include approved plans such as the Box Elder Transportation Plan and the planned and funded improvements at the County Highway 1416 / Radar Hill Road intersection. Does the alternative abide with Ellsworth AFB's AICUZ Include criteria such as complexity of construction, construction impacts to roadways and access and, construction phasing. Includes material only costs but not right-of-way, property, or design costs. Does the alternative use the existing road network and improve connectivity? Page 5-3
89 Category Driver Expectancy Design Criteria Control of Access Public Perception Public Comment Criteria Does the interchange configuration meet the expectation and experience of drivers? For example, simple diamond interchanges will be the most familiar to drivers. How well does the alternative meet 600 foot spacing between ramp terminals, have a grade of no more than 6 percent on the cross street and meets roadway geometric criteria? How many accesses and roads are closed due to control of access requirement? What was the public reaction and comment to the alternative? 5.2 Alternative Development and Screening Exit 63 Level 1 Alternatives and Screening Level 1 development and screening of Exit 63 alternatives established the framework of alternatives for the entire screening process. The Level 1 development and screening process focused on considering a broad range of alternatives to determine the types and location of new Exit 63 interchanges that would address purpose and need and satisfy the transportation and community related issues established through the project scoping effort. In total, eleven Level 1 alternatives were developed for the reconstruction of the Exit 63 interchange. These alternatives are generally described in Table 5-2 and an image of each alternative is provided in the alternatives screening appendix. In summary, interchange configurations were grouped around these cross streets with I-90: West Gate Road, County Highway 1416, Radar Hill Road, Commercial Gate Road, and Bennett Road. Table 5-2. Level 1 Alternative Descriptions Alternative # Alternative 1 Alternative 2 Alternative 3 Alternative 4 Alternative 5 Alternative 6 Alternative 7 Alternative 8 Alternative 9 Description Diamond Interchange at Westgate Road Diamond Interchange at Westgate Road with a direct access to eastbound County Highway 1416 Diamond Interchange at Westgate Road that uses the existing Exit 63 west ramps and has new east ramps. The eastbound on-ramp is a loop. Diamond Interchange at an extension of County Highway 1416 west over I-90. Diamond Interchange at Radar Hill Road Diamond Interchange at Radar Hill Road with braided ramps to Commercial Gate Drive Split Diamond Interchange with Radar Hill Road and Commercial Drive Split Diamond Interchange with Radar Hill Road and Commercial Drive but with exclusive ramps to serve Ellsworth AFB Diamond Interchange at Bennett Road Page 5-4
90 Alternative # Alternative 10 Alternative 11 Description Split Diamond Interchange with Radar Hill Road and Commercial Drive but no overpass of I-90 at Radar Hill Road Remove Exit 63 ramps and dead-end County Highway 1416 at Westgate Road Each of these alternatives were screened against the criteria of Table 5-1. The results of this screening effort are summarized in Table 5-3 by how well each alternative met the specific requirements of the evaluation criteria. Alternatives that best met the screening criteria are shown as green and blue while alternatives that least met the screening criteria are shown in orange and red. It is clear from the analysis that Alternatives 1 through 4, which are those alternatives at the current Exit 63 location, best met the criteria. On the other hand, alternatives at Radar Hill Road and Commercial Gate Road generally were alternatives that least met the criteria. Table 5-3. Level 1 Alternatives Screening Results Evaluation Criteria Alt. # Address Purpose and Need APZ Conflicts Facilitates Movements to Ellsworth AFB Environmental Impacts Private Property Right-of-Way Accommodates Approved Plans Compatibility with JLUS Constructability Implementation Connects to Existing Infrastructure Driver Expectancy Design Criteria Control of Access Carry Forward to Level 2? NA Y 1 Y 2 Y 3 Y 4 Y 5 N 6 N 7 N 8 N 9 N 10 N 11 Y Most Meets the Criteria Least Meets the Criteria Page 5-5
91 As shown in Table 5-3 alternatives at the Radar Hills Road and Commercial Gate Road were not carried forward for further evaluation. In addition, the alternative at Bennett Road was also not carried forward. Compared to the alternatives near the existing Exit 63, these alternatives least met the criteria and typically scored poorly in the following areas: Impacts to low-income and minority populations Implementation Property impacts Table 5-3 shows that Alternatives 1 through 4 plus Alternative 11 were carried forward to Level 2 screening. These alternatives were recommended to be carried forward as they typically had the following characteristics: Fewest impacts to property Best accommodates current long-range planning efforts Most compatible with Ellsworth AFB and Box Elder land planning Best utilizes existing infrastructure Alternative 11 scored well in these areas but also scored well in many other criteria in that this alternative does not involve any new infrastructure construction. The potential fatal flaw with this alternative is that removing the existing Exit 63 interchange does not meet the purpose and need of the project, which is to make Exit 63 a full movement interchange. Despite this, the SAT decided to advance this alternative to the next round of screening. In total, five alternatives plus the No Action alternative were advanced to Level 2 screening. Figure 5-2 through Figure 5-6 show the conceptual layout of these five alternatives and the reasons these alternatives were advanced to Level 2 screening. Page 5-6


92 Figure 5-2. Alternative 1. Interchange at West Gate Reasons for Advancing: Fewer Property Impacts Simplicity of Configuration Figure 5-3. Alternative 2. Interchange at West Gate Road with Direct Access to Eastbound 1416 Reasons for Advancing: Facilitates movements to Ellsworth AFB Simplicity of configuration Uses existing infrastructure Page 5-7


93 Figure 5-4. Alternative 3. Interchange at West Gate Road with Existing West Ramps and New East Ramps Reasons for Advancing: Facilitates movements to Ellsworth AFB Maintains N. Service Road access Uses existing infrastructure Provide desired ramp spacing Figure 5-5. Alternative 4. Diamond Interchange at County Highway 1416 Reasons for Advancing: Provides desired ramp spacing Fewer property impacts Simplicity of configuration Minimal impact to property access Maintains N. Service Road access Page 5-8

94 Figure 5-6. Alternative 11. Exit 63 Removal at County Highway 1416 Reasons for Advancing: No property impacts Low implementation cost Maintains N. Service Road access Exit 63 Level 2 Alternatives and Screening The remaining five alternatives plus the No Action were screened again using many of the same criteria as the Level 1 screening. The purpose of this round of screening was to conduct a relative comparison among these remaining alternatives to identify interchange solutions to carry forward into a more detailed feasibility analysis. In Level 2 some screening criteria were not evaluated as these remaining alternatives had the same score in the Level 1 screening. For example, the APZ conflicts and the compatibility with JLUS criteria were not considered in this evaluation. The public comment criterion was not considered in the Level 1 screening effort but was included in the Level 2 screening effort, since public comment had been received on these remaining alternatives prior to conducting the Level 2 screening. Table 5-4 shows that Alternatives 1 and 4 were to be carried to the next level of analysis. Alternative 1 scored well for driver expectancy because of its diamond configuration, constructability as it could be largely constructed off-line, and implementation as it had the lowest cost. Primary reasons Alternative 4 was carried forward were driver expectancy, fewest property impacts, meeting design criteria, meeting control of access standards, and it was well received by the public. Alternative 2 was not carried forward due to property impacts and the control of access could not be achieved, making the alternative not feasible. Alternative 3 was not carried forward due to property impacts and it scored the lowest on driver expectancy. Page 5-9
95 Table 5-4. Level 2 Alternatives Screening Results Evaluation Criteria Alt. # Address Purpose and Need Facilitates Movements to Ellsworth AFB Environmental Impacts Private Property Right-of-Way Constructability Implementation Connects to Existing Infrastructure Driver Expectancy Design Criteria Control of Access Public Comment Carry Forward for Further Evaluation? NA NOT SCORED DOES NOT MEET PURPOSE AND NEED 1 Y 2 N 3 N 4 Y 11 N Most Meets the Criteria Least Meets the Criteria Page 5-10
96 5.2.3 I-90 Corridor Solutions In addition to the need to develop Exit 63 feasible interchange options, there is also a need to consider future widening options of I-90. SDDOT plans to rebuild the pavement of I-90 between Exit 61 and Exit 63 by the year Since this improvement is expected to have a many decade life-span, the planned pavement rebuild should be constructed to accommodate the Exit 63 interchange reconstruction and the potential need to widen I-90 to six lanes. The SAT considered several widening options between Exit 61 and Exit 63. Options considered were: Widening to the outside of I-90 Widening to the inside of I-90 Holding the south pavement edge and widening to the north In evaluating these different options, it became clear there were corridor conditions and constraints that prevented a single approach to the widening effort. These conditions and constraints are described below with some shown on the proposed widening exhibit on Figure 5-7. Year 2045 traffic volumes did not warrant the need for a six-lane I-90. The widening needed to match the existing lane alignment under the Elk Vale Road overpass. Due to the railroad right-of-way, it was best to have all widening occur to the north. The widening needed to utilize the existing bridges south of Exit 63. Given these conditions and constraints the SAT developed the proposed I-90 widening solution shown on Figure 5-7. Since four general purpose lanes are sufficient to accommodate Year 2045 traffic projects, the SAT decided that any new travel lanes on I-90 should be auxiliary lanes between Exits 61 and Exit 63. Also, all widening should occur to the north but avoid impacts or modifications to existing structures. In addition, the existing median width should be maintained. Finally, in terms of phasing it is likely that the pavement rebuilding project of Year 2023 will not completely construct these auxiliary lanes but will put in place the grading needed to accommodate these new lanes. Figure 5-8 provides another perspective on the proposed I-90 solution. It compares the existing I-90 typical section to the future typical section with auxiliary lanes. As shown, the south pavement edge does not change and that all new lanes shift to the north. The outside lane in both directions is the proposed auxiliary lane. Page 5-11

97 Figure 5-7. I-90 Future Widening Plan Page 5-12
98 Figure 5-8. Existing and Future Typical Section ITS Solutions Based on the ITS needs assessment and discussion among the SAT, the project team developed a listing of seven ITS solutions to be considered for future implementation along the I-90 corridor, summarized in Table 5-5. Each potential solution would leverage available technologies to achieve particular goals within the corridor. Table 5-5. ITS Solutions ITS Solution Description Goal/Potential Benefits 1 Roadway condition warning/ anti-icing for existing WB Exit 63 on-ramp to I-90 1 Use sensors and signs and/or sprayers to reduce crash risk Improve safety 2 Intersection conflict warning for County Highway 1416 intersections 3 Remotely operated intelligent gates 4 Additional vehicle detection and surveillance on I-90 5 Fiber optic trunk along I-90 to connect devices to unify communications 6 Control software to unify DMS, CCTV, detection and other operations Use detection and flashers to alert drivers approaching conflicting traffic Allows current manual closure gates to be operated remotely Allows data collection and monitoring of trouble spots, reducing response time and improving awareness Enables reliable communications and full-motion video. Places all devices on one high performance network Enables monitoring, data collection and control from a single interface. Reduces training time and IT workload Improve safety Improve safety and staff efficiency Improve mobility and efficiency Improve mobility and efficiency Improve efficiency Page 5-13
99 ITS Solution Description Goal/Potential Benefits 7 Variable speed limit (VSL) signs Uses hybrid active signs to display speed limits that vary based on conditions Improves safety 1 This solution applies to a condition under which the existing WB Exit 63 on-ramp to I-90 would remain in place. Any Exit 63 alternative that alters this ramp configuration would require reconsideration of the safety need. With the exception of Solution 1, which is specific to the current WB Exit 63 on-ramp, the ITS solutions could be implemented independently or alongside any of the other feasible corridor scenarios. These solutions should also be considered within the broader context of statewide ITS planning and/or initiatives such as installation of fiber optic line or pilot implementations of ITS strategies such as VSL. 5.3 Feasible Scenarios Feasible scenarios are the Exit 63 interchange alternatives advancing from the Level 2 screening combined with the I-90 and ITS recommendations. As presented in previous sections, the following two Exit 63 interchange alternatives were recommended for further evaluation. Alternative 1: In this alternative, a diamond interchange would use the existing West Gate Road overpass. Alternative 4: In this alternative, County Highway 1416 would extend west to a new bridge over I-90. At this new bridge, ramps with a diamond configuration would be constructed east and west of the bridge. These two alternatives were further refined and designed to provide the lanes and intersection improvements needed to provide an acceptable LOS. Pedestrian accommodations were incorporated into the conceptual design of both alternatives and detailed cost estimates of program costs were prepared. The future I-90 auxiliary lanes were also incorporated into the conceptual designs Feasible Option 1: Alternative #1 - Westgate Diamond Intesection Geometry The conceptual design of Feasible Option 1 is shown on Figure 5-9. To accommodate the main movement of traffic through this option, which is a Z-movement from west I-90 to west County Highway 1416, West Gate Road and the West Gate bridge will need widening. Major geometric features of this option include the following: At the westbound ramp terminal, dual left turn lanes are needed for the northbound to westbound turn movement. These left turn lanes should extend through the eastbound ramp terminal intersection. At the eastbound ramp terminal, dual right turn lanes are needed for the eastbound to southbound turn movement. At the West Gate Road / County Highway 1416 intersection southbound dual left turn lanes and westbound dual right turn lanes are needed. Page 5-14
100 Evaluation Results Evaluation Parameter Result Parcels Impacted 13 Area of New Right-of-Way Needed 5.84 Acres Construction Costs $11.3 million Maintenance of Traffic During Construction Easiest Compared to Feasible Option 2 Traffic Operations It is anticipated that ramp terminal intersections and the West Gate Road / County Highway 1416 intersection will be signalized. As shown on Figure 5-10, ramp terminals and the West Gate Road / County Highway 1416 intersection, given the turn lanes provided at these intersections, will operate well at LOS B or better during the peak hours Feasible Option 2: Alternative #4 - County Highway 1416 Diamond The second feasible option is Alternative 4, which is the extension of County Highway 1416 over I-90 to a new diamond interchange. The SAT also requested that for Alternative 4, a diverging diamond interchange (DDI) be evaluated. Intesection Geometry Diamond Interchage Figure 5-11 shows the conceptual design of Feasible Option 2. Feasible Option 2 is more equipped to accommodate the main movement of traffic through this interchange than Feasible Option 1. In Option 2, the Z-movement is eliminated as the major traffic movement is accommodated between I-90 and County Highway 1416 with only one movement. Major geometric features include the following: At the westbound ramp terminal, westbound dual left turn lanes are needed. These westbound left turn lanes are extended through the eastbound ramp terminal. Single eastwest through lanes are needed. At the eastbound ramp terminal, a free right turn to County Highway 1416 is provided to accommodate the high peak hour volumes expected to make this turn. Page 5-15
101 Figure 5-9. Feasible Option 1: Westgate Road Diamond Interchange Page 5-16

102 Figure Feasible Option 1: Traffic Conditions Page 5-17
103 Figure Feasible Option 2: County Highway 1416 Diamond Interchange Page 5-18
104 Intesection Geometry Diverging Diamond Interchange (DDI) The conceptual design for the DDI is shown on Figure Major geometric features of this option include the following: At both ramp terminals, at least two through lanes are provided even though only one is needed for capacity. The second lane is intended to help keep through traffic flowing in the event of a breakdown in one of the lanes. At the westbound ramp terminal, an exclusive left turn lane and a through-left lane is provided to accommodate the high westbound left turn movement. At the eastbound ramp terminal, vehicles turning to eastbound County Highway 1416 are forced to stop to allow pedestrian movements across this approach. The movement is projected to experience a high peak hour flow and dual lanes are needed to provide an acceptable LOS. Evaluation Results Evaluation Parameter Result Diamond Diverging Diamond Parcels Impacted 5 5 Area of New Right-of-Way Needed acres 9.1 acres Construction Costs $17.1 million $23.8 million Maintenance of Traffic During Construction Hardest Compared to Feasible Option 1 Hardest Compared to Feasible Option 1 Traffic Operations It is anticipated that ramp terminal intersections and the West Gate Road / County Highway 1416 intersection will be signalized. As shown on Figure 5-13, ramp terminals for the diamond alternative are expected to operate at LOS B while the diverging diamond ramp terminals are anticipated to operate at LOS A. In both interchange configurations, the West Gate Road / County Highway 1416 intersection will operate well at LOS B or better during the peak hours. Page 5-19

105 Figure Feasible Option 2a: County Highway 1416 Diverging Diamond Interchange (DDI) Page 5-20

106 Figure Feasible Option 2: Traffic Conditions Page 5-21
107 This page intentionally left blank. Page 5-22

108 6.0 IMPLEMENTATION PLAN The I-90 Exit 61 to Exit 67 Corridor Study provides: A recommended ultimate I-90 typical section and alignment to ensure that actions taken with the grading and surfacing project planned for the Year 2023 can be compatible with and advance the future ultimate plan for the corridor. Feasible design options for reconstructing the Exit 63 interchange (which serves the City of Box Elder and Ellsworth AFB Commercial Gate) to provide for all movements/ directions, thereby satisfying current FHWA Interstate Access Policy, and addressing the potential relocation/reconfiguration of the interchange. ITS Strategies that address identified needs within the study area. Figure 6-1 provides a series of next steps related to each of the recommendations proceeding from the Corridor Study. The graphic provides initial steps for each recommendation in green, all of which are focused on the mainline I-90 grading and resurfacing project (currently identified for Year 2023 implementation) that presents an opportunity for accommodating and advancing a number of the recommendations in the study. Figure 6-1. Recommended Actions Next Steps Page 6-1
109 Actions recommended to occur beyond the Year 2023 are identified in orange/red on Figure 6-1. For mainline I-90, widening to six travel lanes should occur when mainline LOS becomes substandard, anticipated to occur after the Year Reconstruction of the Exit 63 interchange should occur also when triggered by LOS conditions or the condition of the existing Exit 63 westbound on-ramp structure over I-90. This structure is currently in acceptable condition and the remaining service life could extend another 10 years or more into the future. This Exit 63 interchange reconstruction effort should be identified approximately 5 to 10 years prior to construction, at which time the NEPA environmental evaluation and Interchange Modification Justification Report (IMJR) process would formalize a preferred alternative and provide a basis for agency clearance, upon which the design and construction process would proceed. The ITS solutions provided in the corridor study should be considered for individual implementation sooner than the I-90 mainline or Exit 63 efforts, as ITS projects provide independent utility to the corridor and implementation of ITS projects can occur without the need for formalized NEPA or IMJR actions. ITS solutions can be implemented within smaller project budgets, providing positive benefits for lesser investment. Figure 6-1 shows projects likely to affect conditions within the study area that would likely proceed independent of any formal SDDOT action. Each action should consider the outcomes of the corridor study so all efforts in the area can complement and work toward a common vision for the future of I-90. Page 6-2
110 APPENDIX A PUBLIC MEETING SUMMARIES Appendix A
111 APPENDIX B METHODS AND ASSUMPTIONS Appendix B
112 APPENDIX C TRAFFIC COUNTS Appendix C
113 APPENDIX D EXISTING CONDITIONS LOS WORKSHEETS Appendix D
114 APPENDIX E SUPPORTING INFORMATION ENVIRONMENTAL OVERVIEW Appendix E
115 APPENDIX F 2045 NO ACTION LOS WORKSHEETS Appendix F
116 APPENDIX G ALTERNATIVES, EVALUATION MATRIX, FEASIBLE OPTIONS, COST ESTIMATES Appendix G
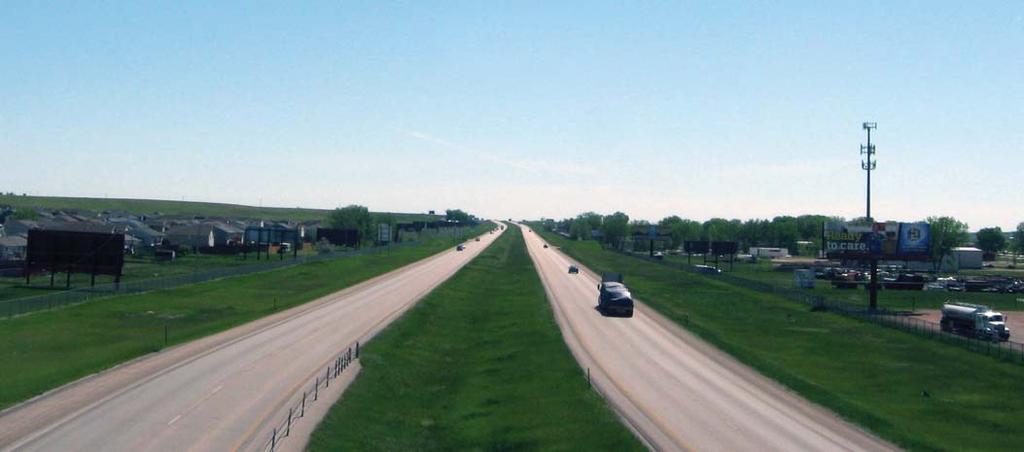
117