The Public Sector Takes a Fresh Look at Railroads
|
|
|
- Brittney Berry
- 5 years ago
- Views:
Transcription

1 The Public Sector Takes a Fresh Look at Railroads Mark E. Yachmetz Associate Administrator for Railroad Policy and Development, U.S. DOT Presentation to Rail Transportation and Engineering Center University of Illinois-Urbana-Champaign April 1, 2011
2 Summary In the United States, the public sector, in particular the Federal and State governments, have generally treated railroads different from other forms of transportation. Highways, aviation, inland waterways and transit have been viewed from the perspective of public works deserving of public investment. Railroads on the other hand, have been viewed from a commerce perspective requiring public regulation, with limited exceptions in times of crisis, arrangements driven by political compromise, or in efforts to preserve some minimal level of service. The Obama proposes a significant shift, with a stronger role for rail transportation supported by levels of public investment on a par with other forms of transportation. The seminar will review the background on this policy shift and discuss the strategic approach proposed by the President to expand the role of high-speed intercity passenger rail transportation in the U.S., and some of the challenges this proposal will face on the track to success. 2

3 Outline Introduction Some observations on changes in the rail industry Why rail interests public policy decision makers today Obama s approach to rail transportation Challenges Questions 3
4 Introduction 4

5 FRA Overview 5


6 Office of Passenger and Freight Programs 6

7 Office of Policy National Rail Plan A Progress Report 7


8 Office of Research and Development - Disciplines Track & Rail Infrastructure Human Factors Signal & Train Control Vehicle/Track Interaction Motive Power & Equipment Hazardous Materials 8
9 Observations on Changes in the Rail Industry 9
10 What is Meant By Commerce vs. Public Works 10
11 Rail Industry and Regulation Before Rate Regulation Regulatory lag Difficult to cover inflation Marketing innovations discouraged No flexible pricing to meet competition Abandonment Public interest outweighed cost of service Restructuring very difficult Collective Ratemaking Rate bureau structure prevented independent action Rate competition discouraged Joint rate revenue shares often non-compensatory 11
12 Rail Industry and Regulation Before 1980 Nine major carriers bankrupt Low industry return on investment Falling market share Rising rates 12


13 Rail Travel Decline 13
14 Rail Crisis and Congress Reaction(s) 1 Rail Passenger Service Act of Emergency Rail Services Act of Regional Rail Reorganization (3R) Act of Railroad Revitalization and Regulatory Reform (4R) Act of Milwaukee Road Restructuring Act of Rock Island Railroad Transition and Employee Assistance Act of Staggers Rail Act of Northeast Rail Services Act of
15 Railroad Crisis Issues In Retrospect 1 Over Built 2 Over Reliant on Out-of-Date Business Model 3 Over Regulated 15
16 Rail Industry Before and After Staggers Class I number of employees was reduced from 488,000 in 1975 to 164,000 in 2008 Class I capital expenditures rose dramatically from $1.8 billion in 1975 to $10.2 billion in 2008 Class I return on investment climbed significantly from 1.2% in 1975 to 10.7% in 2008 Class I miles of track declined from 311,000 in 1975 to 161,000 in
17 Class I Railroad Capital Expenditures ($ billions)
18 U.S. Railroad Net Investment & Train Accident Rate Before and After Staggers Train Accident Rate net investment cumulative in billions of $ accident rate per million train miles 0 18
19 Intermodal Growth: TOFC/COFC Association of American Railroads Railroad Facts (2010 preliminary from AAR Weekly Railroad Traffic, 2010 Annual Summary Loadings in millions of units 19
20 Index of Railroad Rates After Inflation Base Year 1972= Year Sources: U.S. Dept. of Labor, Bureau of Labor Statistics, Producer Price Index of Line-Haul Operating Railroads; U.S. Dept. of Commerce, Bureau of Economic Analysis, Implicit Price Deflator for Gross Domestic Product 20
21 Rail Industry Today Why Rail Interests Public Policy Decision Makers 21
 Total")
22 Safety 2008 fatality comparison between modes. Fatalities (per billion ton miles) Total Fatalities 22


23 Energy Efficiency Oil Consumption Americans consume twice as much oil per capita as E.U. citizens Source: U.S. Energy Information ; CIA World Factbook Oil Dependency 13.8m barrels/day for transportation alone Source: U.S. Energy Information Climate Change +14% GHG emissions ( ) Source: U.S. Environmental Protection Agency Source: U.S. Energy Information 23


24 Fuel Consumption More efficient methods of transportation will reduce greenhouse gas (GHG) and other harmful emissions. BTUs per Passenger Miles Ton Miles per Gallon 24

 Freight Rail has")
25 Freight Transportation Mode Share Tons Ton miles Rail 15% Water 3.50% Pipeline 5.60% Truck 29% Pipeline 20% Truck 75% Rail 39% Water 12% Trucks move more tons (mostly over short distances) Freight Rail has the largest share of freight per ton mile 25


26 Top Intermodal Corridors Top 10 State to State Bi Directional Intermodal Flows California California Washington New Jersey Pennsylvania Ohio Texas California California California Illinois Texas Illinois Illinois Illinois Illinois Illinois Tennessee Kansas Arkansas **This map depicts linkages between mega regions to show intermodal rail movement, not the actual routes. 26


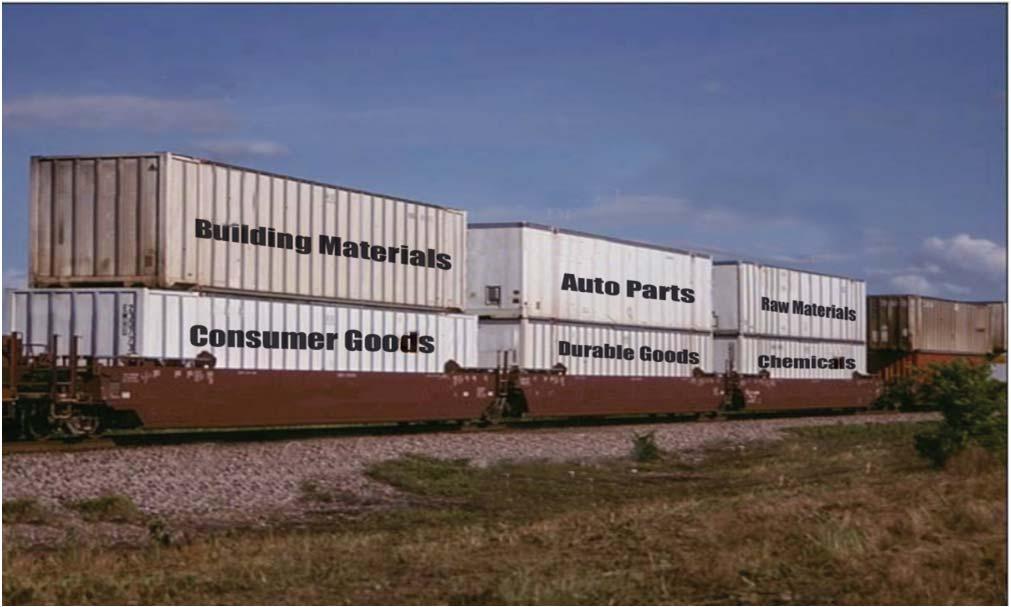
27 Rail s Potential Freight (billion ton miles) Passenger (billion passenger miles) 27
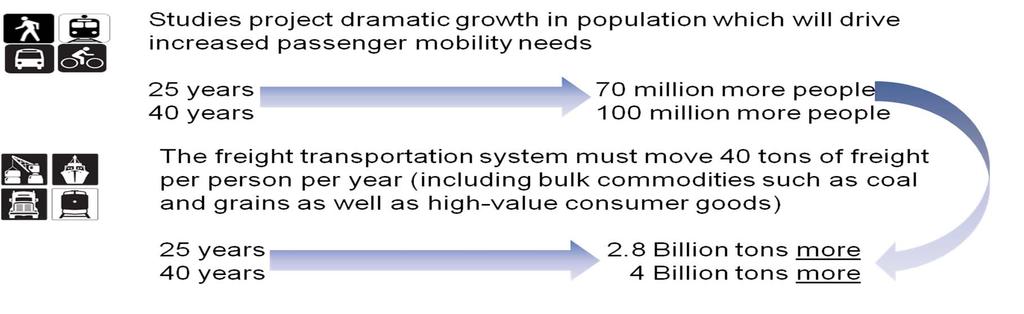

28 Population and Freight Growth 28

29 U.S. Mega Regions 29


30 Mega - Regions By 2050, population projected to grow by 158 million people; 86% of new residents will live in one of mega regions below. pop. growth, >100% % <80% 30
31 DOT Strategic Goals Safety State of Good Repair Economic Competitiveness Livable Communities Environmental Sustainability 31
32 The s Vision 32

33 Vision for Freight Rail Support the current freight rail market share and growth. Support the current freight rail market share and growth. GOALS Develop strategies to allow railroads to attract a greater share of freight traffic to intermodal rail. 33

34 Modal Shift Projection % of Market Share 34

35 Vision for High Speed Rail Provide at least 80% of Americans convenient access to high speed rail network in 25 years Connect large urban areas up to 500 miles apart with 2 3 hour, electricpowered rail service Balance the transportation network and provide complementary service between modes. Boost manufacturing and economic activity. Maximize the identified HSR corridors and stations as centers for new or revitalized economic and community development. 35


 Emerging Connect")
")


36 Three Tiers of Passenger Rail Service Core Express Connect large urban areas up to 500 miles apart within 2 3 hours on electrified, dedicated track ( mph) Regional Connect mid sized urban areas up to 500 miles apart with service on dedicated and shared track (90 125mph) Emerging Connect smaller communities with service on shared track (up to 90mph) Community Connections Connect the passenger rail system to communities by building intermodal stations linked to transit and other modes 36
37 Key Milestones in the High Speed Rail Program Substantial progress in just two years 2008 / Oct 2008: PRIIA passed Feb: ARRA passed Apr: High Speed Rail Strategic Plan released June: NOFA issued for ARRA funds Aug/Oct: Applications received for ARRA funds Jan: ARRA selections announced Apr: First ARRA funds distributed Apr/July: NOFAs issued for FY10 funds May/Aug: Applications received for FY10 funds Oct: FY10 selections announced Feb: President s FY12 budget released Mar: NOFA issued for $2.4 billion in ARRA and FY10 funds 37
38 HSIPR Applications Strong Interest Throughout the U.S. WA 391 applications submitted by 38 States and DC requesting $65 billion NH MT ND VT MN ID ME OR WY SD WI MI NY RI MA CT CA NV UT CO NE KS IA MO IL IN OH PA WV VA NJ DE MD D.C. KY AZ NM TX OK AR MS TN AL GA SC NC LA Application(s) Submitted AL FL Includes all applications submitted on August 24, 2009, for Track 1 (ARRA Projects), Track 3 (Planning), and Track 4 (FY09 Approps Projects); applications submitted on October 2, 2009, for Track 2 (Corridor Programs); applications submitted on May 19, 2010, for FY 2009 Residual projects and FY 2010 Planning projects; and applications submitted on August 6, 2010, for FY 2010 Service Development Programs and Individual Projects 38
 $283 Million for Emerging HSR (up to 90 mph) $1.")
39 HSIPR Program Selections (all funding rounds) $3.5 Billion for Core Express HSR (125 mph+) 136 Applications from 35 States + D.C. $2.9 Billion for Regional HSR ( mph) $283 Million for Emerging HSR (up to 90 mph) $1.2 Billion for Corridor Upgrades $67 Million for Planning Corridor Development Program Projects Setting Stage for HSR Corridor Planning Federally Led Multi State Corridor Planning 39
40 Project Development and Delivery Development Individual Projects Corridor Programs Planning SDP C Service NEPA A PE / Project NEPA FY 2010 Planning Solicitation FY 2010 Individual Projects Solicitation Final Design D B Construction FY 2010 Corridor Programs Solicitation Agreements Delivery Financials Delivery Host Railroads Operator Others (States, Users, Property) Risk Management Organizational Capacity Implementation & Procurement Safety & Security Operating Forecast Capital Program Financing Strategy 40
41 Critical Success Factor: Railroad Stakeholder Agreements Guiding principles for railroad agreements: 1 World-class freight rail system must be preserved & improved 2 Grants must benefit existing or future intercity passenger rail and fund the improvements needed to ensure a high-level of performance 3 Must achieve necessary balance to protect both private & public interests 4 Grants must achieve and maintain quantifiable performance outcomes, including: Operating slots/frequencies Trip times Reliability (to the extent it is under a party s control) 41


42 A Comprehensive Approach to Winning the Future Infrastructure Stations Reinvestment Equipment National High Performance Rail System Amtrak Capacity Maintenance Within 25 years, our goal is to give 80 percent of Americans access to high speed rail. President Barack Obama, January 25,

43 How We Plan to Implement the Program 43
44 What can be Done in 20 Years ***Trip times in Europe were reduced by an average of 1:38 in just 20 years according to the European Union *** 7:12 6:00 4:48 3:36 2:24 1: :00 44

45 6-Year Investment Relatively Modest Versus our Competitors 45
46 FY 2012 Budget Proposal for Passenger Rail Programs Category FY 2010 Enacted ($M) FY 2012 Request ($M) Mission Network Development $2,500 $4,000 High Speed Corridor Development 2,418 3,137 Station Development U.S. Rail Equipment Development Capacity Building & Transition Assistance Develop infrastructure, stations, and equipment for new or upgraded corridors; build institutional capacity; provide transitional operating support System Preservation & Renewal $1,565 $4,046 Amtrak Operating & Capital 1,280 0* Public Asset Backlog Retirement 285 2,982 National Network Service Maintain publicly owned assets; eliminate SGR/ADA backlog; provide support for national service priorities (e.g. long distance trains) State of Good Repair & Recapitalization TOTAL $4,065 $8,046 46


47 Network Development Program ($4B) High-Speed Corridor Development Core Express Connect large urban areas up to 500 miles apart within 2-3 hours on electrified, dedicated track ( mph) Regional Connect mid-sized urban areas up to 500 miles apart with service on dedicated and shared track. (90-125mph) Emerging Connect smaller communities with service on shared track (up to 90mph) Station Development Link the passenger rail system and other transportation modes to communities through modern intermodal stations U.S. Rail Equipment Development Establish a standardized and interoperable rail fleet, which will lower costs and stimulate domestic manufacturing Capacity-Building & Transition Assistance Develop the rail industry s capacity and expertise, and assist new corridors and existing State-supported services with transitional operating support 47
 Public Asset Backlog Retirement Eliminate the backlog of maintenance needs on publicly-owned and controlled assets, including the vital Northeast")

48 System Preservation & Renewal Program ($4.046B) Public Asset Backlog Retirement Eliminate the backlog of maintenance needs on publicly-owned and controlled assets, including the vital Northeast Corridor, and bring all stations served by Amtrak into ADA compliance National Network Service Support the continued operations of long-distance services and maintain national passenger rail facilities and systems State of Good Repair & Recapitalization Ensure public assets are functioning as designed to provide safe and reliable passenger rail service, and replacing those assets at the end of their useful life 48
49 Next Steps 1. 1 Short-Term: Launch Get ARRA and FY10 projects underway Recompete $2.4 billion in ARRA and FY10 funds 2. 2 Mid-Term: Refine President s FY 2012 budget request Surface Transportation Reauthorization National, regional, and state planning process 3. 3 Long-Term: Sustain Technical assistance Capacity building Long-range planning 49
50 Challenges 50
51 Challenges - Technical 1 Ability to provide high quality, reliable service on infrastructure shared with high axle load freight service 2 Safety 3 Capacity 4 Ride quality 5 Engineering a green field route 6 Accessing our urban cores 7 Translating overseas experience to North American conditions 8 Developing the technology that will support a U.S. manufacturing base 51
52 Challenges Programmatic Expectation Management. -What is high-speed rail anyway? -When will I see a high-speed train in my town? -Passenger rail not a priority of freight railroads -Are improving freight and improving passenger competing priorities? New Relationships Capacity Building The dependability of the Federal Government as a partner 52
53 Challenges Political What is the role of the Federal Government in transportation and how are we going to pay for it? 53


54 Questions? US Department of Transportation Federal Railroad 54