Truck GPS Data for Freight Performance Measurement and Planning: Applications, Issues, and Opportunities
|
|
|
- Britney Thompson
- 5 years ago
- Views:
Transcription
1 Truck GPS Data for Freight Performance Measurement and Planning: Applications, Issues, and Opportunities presented to Florida Model Task Force, Freight Committee presented by Abdul Pinjari - University of South Florida Jeff Short, Dave pierce, Lisa Park, Dan Murray ATRI Vidya Mysore & Frank Tabatabaee FDOT Aayush Thakur, Anissa Irmania, Akbar Zanjani, Jonathan Koons - University of South Florida December 6, Orlando, Florida. Project Objectives Project Objectives Investigate the use of ATRI FPM data for freight performance measurement and planning in Florida. Use the data for the following applications Derive freight performance measures (speeds) for Florida s highways Convert the GPS data into a database of truck trips Derive tuck trip OD flow tables for the Florida Statewide Model Other Assess the data its coverage of freight truck traffic in Florida Exploratory analysis of the use of data for different applications Note: All the work was done using data from year
2 Freight Performance Measurement On Florida s SIS highways Freight Performance Measurement Average speeds on Florida s SIS highways ATRI data used to measure average truck speeds on the entire SIS network Speedsmeasured for different time of day periods for each 1 mile segmenton the SIS network (half mile segments in urban regions) AM peak PM peak Mid day Off peak Daily average Speeds measured based on 3 months of data in year


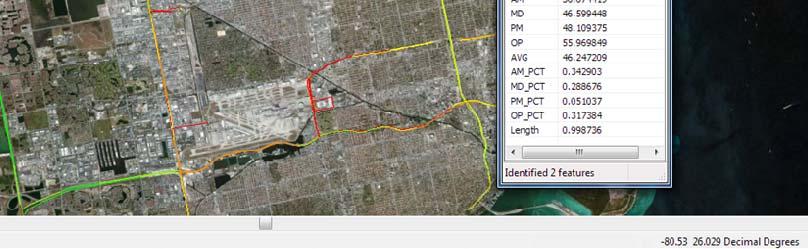
3 12/10/2012 PM Peak Period Speeds on Florida s SIS Highways Miami PM Peak Period Speeds on Florida s SIS Highways 3
4 Project Objectives Project Objectives Investigate the use of ATRI FPM data for freight performance measurement and planning in Florida. Use the data for the following applications Derive freight performance measures (speeds) for Florida s highways Convert GPS data into a database of truck trips Derive tuck trip OD tables for the Florida Statewide Model Other Assess the data, and its coverage in Florida Exploratory analysis of the use of data for different applications Convert GPS Data into Truck Trips Algorithms to convert raw GPS data into a truck trips database Two types of algorithms for two types of data Algorithm for data with spot speeds Algorithm for data without spot speeds Algorithm for data without spot speeds Both algorithms attempt to identify valid stops (Origins &Destinations) Not all stops are valid pick up/delivery stops Stops of smaller duration (e.g., < 5mins) likely to be traffic stops Not all stops of larger duration are pick up/delivery stops Gas station stops Stops due to insignificant movements (e.g., within a large warehouse) Rest stops (e.g., for water, restroom, food) Stops mandated by federal law on hours of service (HOS) Not all stops of smaller duration are insignificant either!! especially in urban areas 4
5 The algorithms were refined based on a variety of validations Comparison of trip outputs with manual tracking of trucks on Google Earth Checking the validity of trip end locations in Google Earth Discussionswith ATRI and FDOT Sample validation results Plotted the origins and destinations of random sample of trips on Google Earth 10% origins and/or destinations were fond to be either in rest stops, or on roadways or on empty lands Summary of Trips Extracted From 4 Weeks of GPS Data 1 week in March week in April week in May week in June 2010 From Data w/ Spot Speed From Data w/o Spot Speed # raw GPS Records 1.62 Million 3.77 Million # of trucks in the data 4,276 14, # trips extracted that start and/or end in FL 30,832 52,233 Average trip length (miles) 138 miles 228 miles # raw GPS Records 1.66 Million 2.55 Million # of trucks in the data 4,333 18,801 # trips extracted that start and/or end in FL 31,001 48,047 Average trip length (miles) 143 miles 215 miles # raw GPS Records 1.72 Million 3.16 Million # of trucks in the data 4,297 17,069 # trips extracted that start and/or end in FL 31,537 47,249 Average trip length (miles) 142 miles 218 miles # raw GPS Records 1.70 Million 3.38 Million # of trucks in the data 4,288 12,667 # trips extracted that start and/or end in FL 32,462 45,258 Average trip length (miles) 136 miles 222 miles 5


6 Characteristics of Trips Extracted for 1 Week in May 2010 Trip Length distribution For trips extracted from 1 week of data (without spot speeds) in May 2010 Trip Length distribution For trips extracted from 1 week of data (with spot speeds) in May


7 Cross tabulation between Trip Length and Trip Duration For trips extracted from 1 week of data (with spot speeds) in May 2010 May Trip Duration (in minutes) Trip Length (in miles) > 400 % of Total % % % % % % % % % % % % % % % > % % % of Total 7.08% 6.51% 10.95% 6.22% 3.98% 5.61% 10.68% 6.94% 7.20% 7.74% 5.49% 7.77% 4.08% 9.75% % Distributions of Trip Speeds and Stop Durations For trips extracted from 1 week of data (with spot speeds) in May 2010 Note: Trip Speed computation does not consider intermediate stops longer than 45 minutes These distributions are for only those trips that started and/or ended in Florida 7
8 Convert GPS Data into Truck Trips Next steps Generate OD tables from all the trips derived from the raw datasets For the Florida Statewide Model For different model regions within Florida Analyze other trip characteristics Time of day profiles Weekday vs. weekend trips Issues Inference of trip ends can benefit from detailed land use information Whichtrucks carry freight vs. which are non freightcommercial vehicles? How to separate intra urban CMV movements from inter regional freight movements? The generated OD tables will not represent all the truck flows in the state. The data represents a sample of truck flows, but not all truck flows Project Objectives Project Objectives Investigate the use of ATRI FPM data for freight performance measurement and planning in Florida. Use the data for the following applications Derive freight performance measures (speeds) for Florida s highways Algorithms to convert GPS data into truck trip flows Derive tuck trip OD tables for the Florida Statewide Model Other Assess the data, and its coverage in Florida Exploratory analysis of the use of data for different applications 8

 What proportion of freight")

9 How Much/What Freight-Truck Traffic in Florida is Covered by the ATRI Data? Visual illustration of network and geographical coverage of the ATRI data (produced by ATRI) What proportion of freight truck flows in Florida are captured in the ATRI data? FDOT Telemetric Traffic Monitoring Stations (TTMS count stations) TTMS Vehicle Traffic Count Stations SIS Highway Network 9

 Results (see next")
10 Compared the truck counts from ATRI data with FDOT TTMS counts (assumed to be ground truth) for one week period (May 9 15, 2010) Procedure Among all the trips derived from the raw GPS data, select only those trips that that started and/or ended in Florida For each trip, the number of times it crosses each TTMS site was counted using the network analyst tool in ArcGIS The resulting total truck traffic counts (crossing TTMS sites) from ATRI data were validated against manually counting (using the raw data) of the number of times trucks were crossing a few counting stations The ATRI truck traffic counts were compared to the truck traffic counts from the TTMS vehicle classification counts (at each counting station) Results (see next slides) 10
11 Percentage of Heavy Truck Counts from TTMS Data represented by ATRI s GPS Data at TTMS Count Stations in FL (for 160 count stations) Percentage of heavy truck counts represented by ATRI s Number of TTMS Stations for total GPS Number of TTMS Stations for total GPS GPS data data (class 8 13) data (class 9 13) 0% 0 0 < 5% % % % 4 32 >50% 1 10 Total Aggregate percentage coverage by facility type No. of ATRI TTMS truck TTMS truck % coverage assuming ATRI data comprises % coverage assuming ATRI data comprises count Facility Type stations truck counts counts for Class 8 13 counts for Class 9 13 trucks of class 8 13 trucks of class 9 13 Freeways & Expressways (1) ,608 1,063, , % 12.8% Divided Arterials (2) 64 30, , , % 14.8% Undivided Arterials (3) 52 6, ,066 53, % 12.9% Collectors (4) 8 5,127 42,164 32, % 15.7% TllF Toll Facilities (9) 7 9,291 80,493 60, % 15.5% 5% Total ,467 1,621,279 1,221, % 13.4% 11
12 Summary ATRI data shows about 13% coverage of the truck traffic in Florida, if we assume the data comprises class 9 13 trucks Next steps Similar analysis is being conducted for a week in 2012 to assess the increase in the truck traffic captured by the ATRI data Origin Destination (OD) Matrix Estimation methods for estimating the full OD tables of truck flows in Florida Project Objectives Project Objectives Investigate the use of ATRI FPM data for freight performance measurement and planning in Florida. Use the data for the following applications Derive freight performance measures (speeds) for Florida s highways Algorithms to convert GPS data into truck trip flows Derive tuck trip OD tables for the Florida Statewide Model Other Assess the data, and its coverage of freight truck traffic in Florida Exploratory analysis of the use of data for different applications Analysis of truck kflows from ports Analysis of truck routes 12
")


13 Other Applications: Truck Flows From Ports Two illustrations Analysis of trucks flows from Blount Island (Jacksonville) Analysis of trucks flows from Port Everglades Procedure Take all trucks that had a nexus with the port during a period in 2010, Follow them from when they leave the port for a maximum of 11 hrs, Terminate trips after exhibiting little to no movement for >2 hours. NOTE: The analysis uses only part of ATRI s truck GPS database Results in the next slides Blount Island 13
 251")


 171")


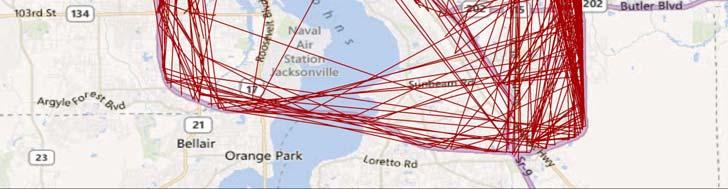
14 Other (NW) 251 Trips 3.3% I 95 N 1,098 Trips 14.6% Other (NE) 652 Trips 8.7% I 10 W 477 Trips 6.3% US 1 N 295 Trips 3.9% Urban 3,485 Trips 46.4% Blount Island 7,520 Trips Total Other (SW) 171 Trips 2.3% SR 200 S 175 Trips 2.3% I 95 S 895 Trips 11.9% Other (SE) 21 Trips 0.3% Blount Island 14


")


")

15 Other (NW) 4 Trips 0.1% US 27 N 60 Trips 1.0% I 75 N 50 Trips 0.9% FL TPK N 1,392 Trips 23.9% I 95 N 2,877 Trips 49.3% Port Everglades Other (NE) 20 Trips 0.3% 5,830 Trips Total Other (SW) 26 Trips 0.4% FL TPK S 29 Trips 0.5% Urban 1,341 Trips 23.0% Other (SE) 31 Trips 0.5% Port Everglades 15


16 Other Applications: Analysis of Truck Routes Research Task: Characterize the movement of trucks before and after they cross the I 75 Ocala Counting Station, specifically focusing on trucks that utilize US 301. Step One: Proof of Concept Test using one week of data (April 26 May 2, 2010) Research Task: Characterize the movement of trucks before and after they cross the I 75 Ocala Counting Station, specifically focusing on trucks that utilize US 301. Step One: Proof of Concept Test using one week of data (April 26 May 2, 2010) 2,981 unique trips passedthrough Ocala Counting 2,981 unique trips passed through Ocala Counting Station on I 75 16


17 Southbound Analysis Based on 1,568 Trips The portion of the trip occurring before Ocala is shown in light blue. The portion of the trip after Ocala is shown in dark blue I % I % US % I % I % I % Where did southbound trucks come from before passing Ocala on I 75? SR % US % SR % I % CR % US % Ocala Origin 11.4% 17


18 Isolating ONLY trips that used US 301 southbound to get to I 75 southbound near Ocala Southbound Analysis 196 Trips Where did trucks come from that used US 301 southbound to get to I 75 southbound? I % US % I % SR % US % US % I % 18


19 Where did trucks go to that used US 301 southbound to get to I 75 southbound? I % I % FL TPK 9.7% I % I % I % I % Thank you Questions and Discussion 19