Goods Movement Challenges. Opportunities. Solutions. Hasan Ikhrata Director of Planning & Policy Southern California Association of Governments
|
|
|
- Rosamund Pope
- 5 years ago
- Views:
Transcription
1


2 Goods Movement Challenges. Opportunities. Solutions Hasan Ikhrata Director of Planning & Policy Southern California Association of Governments


3 The Regional Planning Agency for Southern California


4 15 th largest economy in the world Shares the characteristics of many nations


5 Experiencing Explosive Growth Population is expected to grow by more than 6,000,000 over the next two decades to 23 million 38% more than today


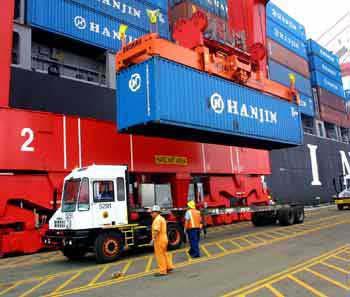
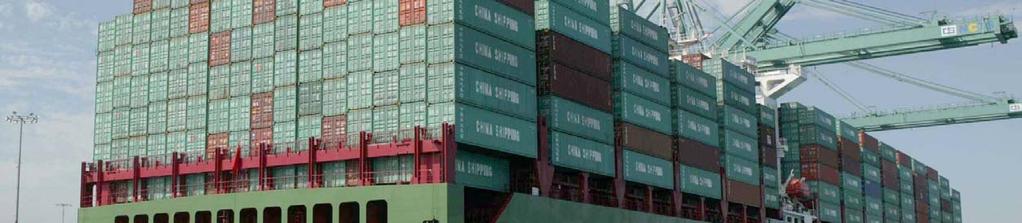
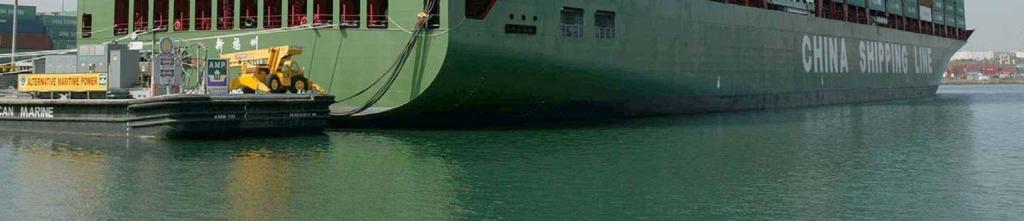
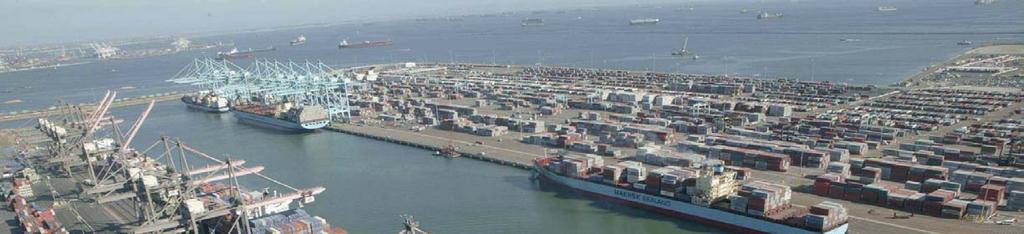
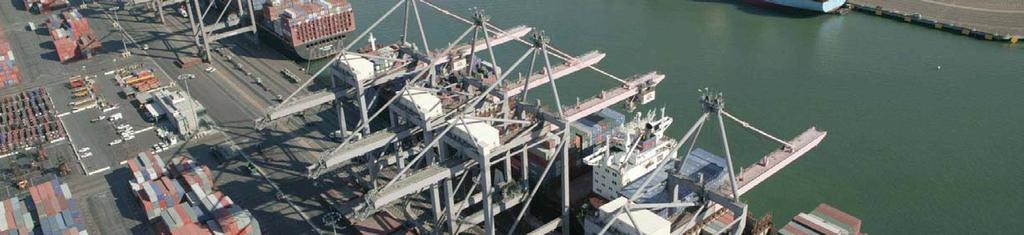
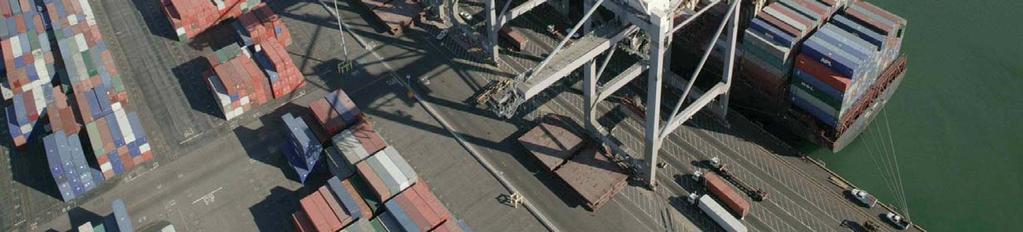
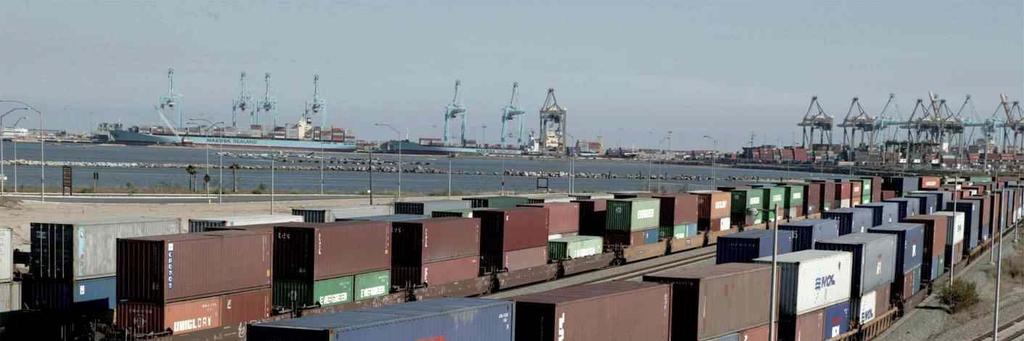
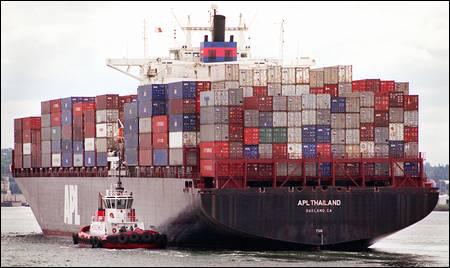
6 9,000 lane miles of freeway Four major airports Hueneme San Pedro Long Beach Nation s Global Gateway for Trade

7 Ports handle one third of all container traffic in U.S. and nearly two-thirds of containers from Asia Over 70% of imports pass through to other markets
8 Total LA/Long Beach Container Growth Projected to Triple in 25 Years In Million TEU s % US Import Market Share % US Export Market Share Revised Est Original 6.9 Estimate Source: POLA, POLB
9 What Does the Logistics Infrastructure and Work Force in the Region Offer Shippers That Other Destinations Don t?


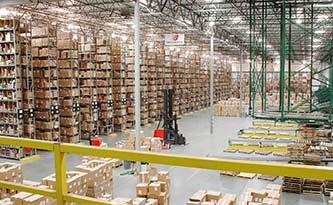
10 Exactly What Shippers Want To Transported Shipped Unloaded To Goods Distribution Arrive And Just Made by in In at Containers Trucks Time our Retailers Centers Trains Asia Ports
11 Just a Couple of Problems

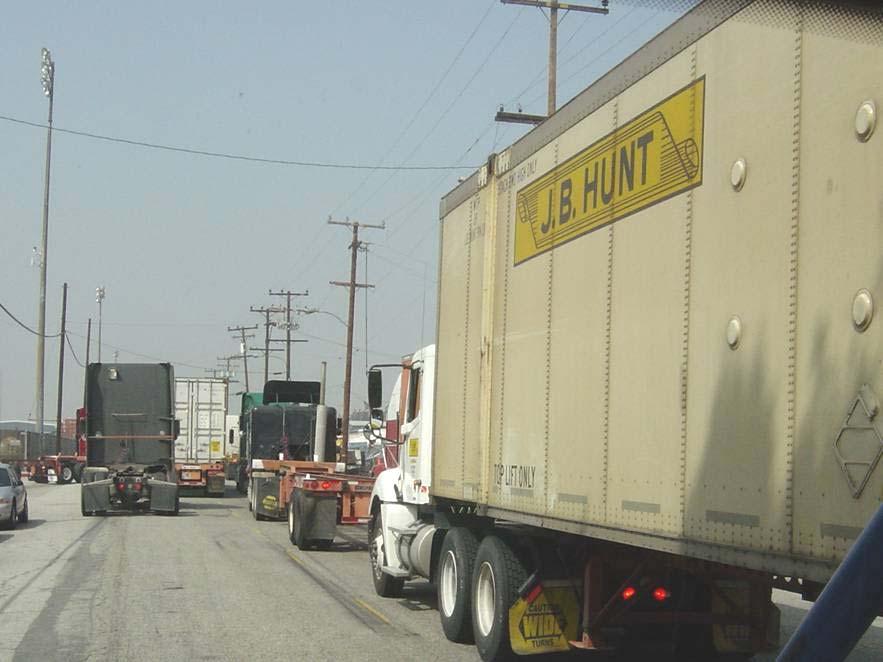
12 Highway Congestion 80% Projected Growth 70% 60% 50% 40% 30% 20% truck travel auto travel population 10% Worst in nation since 1982


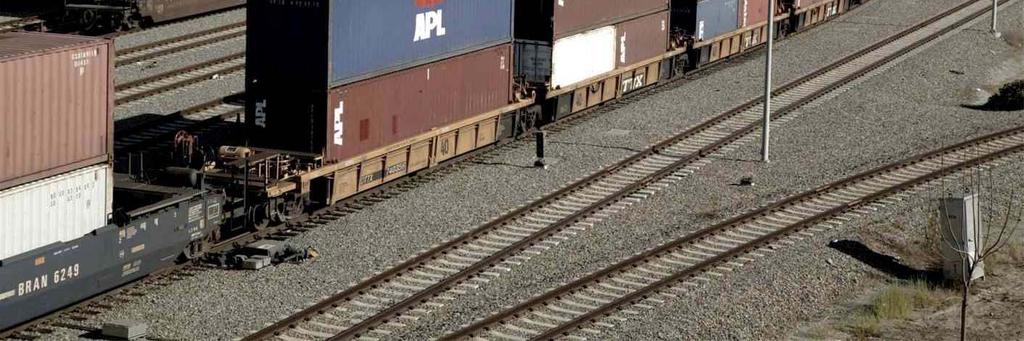
13 Rail Congestion Year Freight Trains per Day % Increase Source: SCAG Los Angeles - Inland Empire Railroad Mainline Advanced Planning Study

14 Estimated Risk of Cancer from Airborne Toxics: Excluding Diesel Cancers per million Source: SCAQMD, Multiple Air Toxics Exposure Study II, March 2000

15 Estimated Risk of Cancer from Airborne Toxics: Including Diesel Over1200 Cancers per million Source: SCAQMD, Multiple Air Toxics Exposure Study II, March 2000
16 What We Need To Do

17 Build Dedicated Truckway System 2 Lanes in Each Direction East/West 37.8 miles I miles I miles

18 Improve Rail Capacity East-West Corridor Barstow LATC Hobart E. LA Pomona Colton Fullerton Atwood Riverside Indio Alameda Corridor 184 center-track miles, 390 daily trains by 2025 Future Improvements

19 Mitigate Environmental Impacts
20 The Cost Dedicated Truck Lanes Additional Rail Tracks Environmental Mitigation $20.2 Billion $6.0 Billion $10.0 Billion $36.2 Billion
21 Can some of the new infrastructure be financed with user fees?
22 LA/LB At what point would fees and tolls used to finance infrastructure divert business elsewhere?

23 Dr. Robert C. Leachman U. C. Berkeley Leachman & Assoc. LLC A Study to determine port demand elasticity September 2005
24 The Elasticity Study Interviewed Importers Steamship Lines Port Terminal Operators Railroads and Trucking companies Logistics companies Analyzed current: trade flows and steamship services steamship, rail and dray rates labor and management practices at ports third party logistics operations Study Conducted by Leachman and Associates LLC, September 2005
25 Most Cargo Coming to LA/LB Ports Passes Through to Other Markets Los Angeles Long Beach Locally consumed or produced 23% Discretionary 77% (52% transloaded)
26 Deep Harbors and Landside Facilities Make LA/Long Beach the Preferred Destination Vancouver, BC Seattle Tacoma Oakland Los Angeles Long Beach Limited landside intermodal capacity Can t accommodate post-panamax ships NY/NJ Brunswick Norfolk Charleston Savannah Houston Post-Panamax ships are TOO LARGE to transit the Panama Canal
27 The Study Analysis Distributed volume for 102 major importers among all regions proportional to their purchasing power Allocated import volumes among ports and modes as to minimize total transportation and inventory costs for each importer Study Conducted by Leachman and Associates LLC, September 2005
28 If Fees on 40-foot Containers Were Applied. At what price point would using the LA/Long Beach ports stop making sense? Study Conducted by Leachman and Associates LLC - Sept. 2005
29 2004 Annual Volume FEUs in millions Fees Imposed with No Infrastructure Improvements Total Volume Trans Loading Volume Fairly inelastic until fees in the $180 range are introduced Much more inelastic than direct shipping $ Container Fee (per FEU) in dollars
30 2004 Annual Volume FEUs in millions Container Fees Used to Finance Congestion Relief Total Volume Trans Loading Volume Congestion relief makes ports more attractive At $200, volume is only 4.3% below No Fee:No Improvement Scenario Trans-load volume is even higher $ Container Fee (per FEU) in dollars
31 Estimated Private Sector Level of Investment Dedicated Truck Lanes Additional Rail Tracks Total Highway & Rail System Total with Environmental Mitigation ($10B) $60 - $70 per FEU plus $0.86 per mile $15 - $30 per FEU $120 - $130 per FEU plus $0.86 per mile $160 - $170 per FEU plus $0.86 per mile Investment Levels Fall Within Study Parameters for Acceptable Rate of Return
32 What are speed and reliability worth to users of the system?
33 The Value of Time Trucking Industry Value of time $25 to $200 per hour depending on cargo FHWA Freight Management and Operations: Measuring Travel Time in Freight-Significant Corridors,
34 Travel Time In the Year 2030 AM Peak Travel Planning Time* in Hours LA Business District Ontario Victorville Hours: *
35 Time of Day (non-holiday weekdays) 5 AM 6 AM 7 AM 8 AM 9 AM 10 AM 11 AM 12 PM 1 PM 2 PM 3 PM 4 PM 5 PM 6 PM 7 PM 8 PM 9 PM 10 PM % more time Planning Time in 2030 Index by Time-of-Day Travel Time Buffer Time to ensure on-time arrival for most trips Mobility Monitoring Program Texas Transportation Institute. FHA
36 In the Year 2030 with Truck Lanes AM Peak Travel Planning Time in Hours LA Business District Ontario Victorville Hours:
37 Cash Value of Time Savings with Truck Lanes AM Peak per hour LA Business District Ontario Victorville Value: $103 $232 $305 Extra Trip Potential
38 Railroads Will Receive Great Benefits from Capacity Improvements Colton Crossing Hours Saved En Route Percent Faster Hours Saved In Delay Percent Reduction BNSF Railway % % Union Pacific % % *
39 Time Saved with Rail Capacity Improvements Flow Time Per Train 2010 Baseline 2025 With Improvements From Ports to Colton Crossing Minutes Saved Hours Saved Percent Faster BNSF Railway Union Pacific Minutes Delay Per Train 2010 Baseline With Improvements Minutes Saved Hours Saved 59% 65% Note: Without improvements nothing will be moving in 2025 Percent Reduction BNSF Railway Union Pacific % 93% Leachman & Associates LLC
40 Quick Summary 1. The LA/LB ports offer shippers a competitive advantage 2. Transportation infrastructure improvements would offer rail, truck, and shipping companies significant cost and time savings
41 Good Jobs & Growing Sector
42 Path to Prosperity: The Right Kind of Jobs Tech Dependent On the Job Learning Defined Skill Ladder Good Entry Level Pay Blue Collar Southern California Based
43 Logistics Jobs In 2003 Wholesale Trade Truck Transportation Transportation Support Couriers General Warehousing Air Transportation Rail Transportation Water Transportation 352,373 54,504 52,662 30,090 28,442 25,466 2,952 1,789 Source: Quarterly Census of Employment Wages, CA EDD, 2004 Total 548,278
44 Share of SCAG Jobs % SCAG Jobs 16% 14% 12% 10% 8% 6% 1 out of 12 jobs in % 4.8 2% 0% Motion Other Picture Services Constr. Financial Activities Logistics Leisure and Hosp. Educ. & Health Services Manf. Prof. & Bus. Services Gov t.
45 Logistics Pay Annual In 2003 Rail Transportation Air Transportation Transportation Support Wholesale Trade Water Transportation General Warehousing Truck Transportation Couriers $55,344 $51,655 $49,829 $46,892 $40,988 $37,938 $37,449 $34,049 Source: Quarterly Census of Employment Wages, CA EDD, 2004 Total $45,314 Weighted Average
46 Compared to Other Sectors $ Weekly Pay $1600 $1400 $1200 $1000 $800 $600 Average weekly pay for all industries is $749 $718 $777 $811 1 of highest paying $843 $847 $866 $1194 $1353 $400 $200 $400 $413 0$ Leisure and Other Services Educ. & Health Hospitality Services Constr. Prof. & Bus. Services Manf. Logistics Gov t. Financial Activities Motion Picture
47 What Do We Need? Private Sector Leadership Political Leadership Federal Involvement and Support
48 THANK YOU