Welcome to the VRE Gainesville-Haymarket Extension (GHX) Study Community Meeting
|
|
|
- Joan McKenzie
- 5 years ago
- Views:
Transcription
1 Welcome to the VRE -Haymarket Extension (GHX) Study Community Meeting 6:00-6:30 Sign In and Review Display Boards 6:30-7:30 Presentation, Q&A 7:30-8:00 Review Display Boards, Complete Survey
2 Study Area See Enlarged Map Source: GIS Data Prince William County 2015.


3 Project Goals 1. Add capacity to the I-66 corridor 2. Accommodate current and future freight operations 3. Provide cost-effective and reliable mobility options 4. Enhance service on existing line for current and future riders 5. Support local and regional economic development plans


4 Project Schedule We are here JUL AUG SEP OCT NOV Planning Project Activities Environmental Preliminary Design Current Study Final Design Construction Start Up Contingent upon Norfolk Southern approval and funding availability. Project Phase PROJECT DEVELOPMENT PROJECT IMPLEMENTATION REVENUE SERVICE Schedule Schedule as of November as of April 2016
5 Selecting a Preferred Alternative Alternatives Analysis Environmental Review (NEPA)* * Preliminary Engineering Initial Evaluate Alternatives Refined Initial NEPA Publish FONSI** Analysis Alternatives Recommend Final LPA JUL JUL OCT DEC JAN Mid- Fall Fall Evaluate Wide VRE Publish Draft VRE Range Initial Operations Board Environmental Operations Alternatives Recommends NEPA Assessment Board Adopts Alternatives(s) for Recommend LPA Additional Study Draft Locally Preferred We are here Alternative (LPA) * The National Environmental Policy Act of 1969 (NEPA) and its implementing regulations establish a process to assess and disclose the anticipated impacts of proposed federal actions on the human environment. ** A Finding of No Significant Impact (FONSI) is issued when environmental analysis and interagency review during the Environmental Assessment process find a project to have no significant impacts on the quality of the environment.

6 VRE Manassas Line Benefits Economic Development Ridership and Mobility Growth Focused Around VRE Lorton I-66 Corridor Person Throughput (2040) Percent Growth 250% 200% 150% Tract Adjacent to Study Area Broader Area 113% 229% Persons per Hour 25,000 20,000 15,000 General Purpose Lanes Express/HOV Bus Metrorail VRE -Haymarket Extension 100% 10,000 50% 43% 41% 5,000 17% 0% 0 Source: AECOM Analysis, % Population Employment US Bypass Source: Adapted from Transform 66 Outside the Beltway, Tier 2 EA, June US 29 (Centreville) US 50 Route 234/ Nutley Street I-495 Support greater tax revenues Minimize sprawl and conserves open space VRE Manassas Line complements I-66 and US 50/29 for east-west regional travel Additional travel choice is needed in I-66 corridor to provide longterm congestion relief Reduced Traffic and Vehicle Miles Traveled (VMT) Change from Existing Conditions Source: The Cosmopolitan at Lorton Reduction due to having a closer VRE station Reduction by attracting new VRE riders Broad Run (Relocated) 2 s 3 s Haymarket 214 1,159 4,566 7,083 8,460 51,834 72,334 79,791 88,702 93,886 Total VMT reduction 52,048 73,493 84,357 95, ,346 Source: AECOM Analysis, Note: VMT figures corrected since December 7 community meeting.
7 Alternatives Analysis Process Service Plan Location Alignment/Route Equipment Storage Facility Screening of Initial Alternatives Refined Alternative Refined Alternative Evaluation of Refined Alternatives We are here Recommended Alternatives for Environmental Review Initial Alternative Screening Criteria and Key Findings Project Element Key Screening Considerations Findings and Recommendations Service Plans Locations Alignment/Route Equipment Maintenance and Storage Facility Norfolk Southern Railway (NS) impacts Ability to attract new riders Operating costs Operate within existing freight railroad operating agreements Physical suitability and access Land use and economic development Environmental considerations Capital costs Minimal disruption to NS operations Ability to attract new riders Physical suitability Minimal disruption to NS operations Environmental considerations Advance Local service option (serve all stations). Increase frequency of VRE service to 20 minutes. For extension alternatives discontinue service to Broad Run station. Recommended sites vary by refined alternative. Analyze different terminus options. End-of-line site identified for each refined alternative.
 Broad Run 14,010 $300 M $36 M Extension & Broad Run (Split Service) 13,680 $550-650 M $48 M Extension 14,720 $550-650 M $45 M")
 2040 Daily Ridership 1 Capital Cost (2016$) 2 Annual O&M Cost (2016$) Diagram Existing Service (16) Broad Run (Relocated) (2 stations) (3 stations)")
.")

8 Initial Alternatives Alternative 2040 Daily Ridership 1 Capital Cost (2016$) 2 Annual O&M Cost (2016$) Diagram Existing Service (16 trains per day) 9, $29 M Enhanced Service Options: 6 additional daily trains (22 trains per day) Broad Run 14,010 $300 M $36 M Extension & Broad Run (Split Service) 13,680 $ M $48 M Extension 14,720 $ M $45 M Extension + Off- Peak Shuttle 15,920 $ M $72 M The best performing alternatives Refined Alternatives advanced for detailed analysis. Alternative (Trains per Day) 2040 Daily Ridership 1 Capital Cost (2016$) 2 Annual O&M Cost (2016$) Diagram Existing Service (16) Broad Run (Relocated) (2 stations) (3 stations) Haymarket 10, $29 M 15,350 $345 M $36 M 15,820 $580 - $633 M $37 M 16,100 $572 - $616 M $40 M 16,340 $ M $40 M 16,460 $ M $45 M 1. VRE/MWCOG Travel Demand Model: Initial Alternatives as of April 2016 and Refined Alternatives as of September Initial alternatives capital cost includes rolling stock and train maintenance and storage facility (MSF). Low range assumes construction of 1 additional track (2 tracks total) and full 100 foot rightof-way (ROW); high range assumes construction of 2 additional tracks (3 tracks total) and full 100 foot ROW. 3. Capital costs associated with existing service TBD. Note: ALX: Alexandria ; BRU: Broad Run/Airport ; GVL: ; HAY: Haymarket ; INV: /Sudley ; MSS: Manassas ; PWS: Prince William ; WAS: Union.
9 Refined Alternatives Ridership Potential ,000 15,000 15, Manassas Line 2040 GHX s 2040 Manassas Line 15,820 16,100 16,340 16,460 Existing Service (16 trains per day) Existing Service Span 5:00 AM - 8:00 PM Trains every 30 minutes during peak period Daily Ridership 12,000 9,000 6,000 10,220 Enhanced Service Options: 6 additional daily trains (22 trains per day) 3,000 Broad Run Relocates Broad Run station 0 Existing Service (16) Source: VRE/MWCOG Travel Demand Model 2016 Broad Run (Relocated) (2 s) (3 s) Haymarket (Relocated) Expands existing yard Capital Cost (2 stations) Realigns Manassas Line to terminus Eliminates Broad Run station New end-of-line yard Realigns Manassas Line to - Prince William terminus Eliminates Broad Run station New end-of-line yard Realigns Manassas Line to - US 29 terminus Total Estimated Capital Cost (2016$) Millions $700 $600 $500 $400 $300 $200 $100 $0 Existing Service (16) $345 Broad Run (Relocated) $580 to $633 M $572 to $612 M (2 s) $592 to $631 M (3 s) $612 to $660 M Haymarket (3 stations) Eliminates Broad Run station Source: VRE cost estimates 2016 New end-of-line yard Operations and Maintenance Cost Haymarket Note: ALX: Alexandria ; BRU: Broad Run/Airport ; GVL: ; HAY: Haymarket ; INV: /Sudley ; MSS: Manassas ; PWS: Prince William ; WAS: Union Realigns Manassas Line to Haymarket terminus Eliminates Broad Run station New end-of-line yard Annual O&M Cost (2016$) Millions $50 $40 $30 $20 $10 $29 $36 $37 $40 $40 $45 $0 Existing Service (16) Broad Run (Relocated) (2 s) (3 s) Haymarket Note: Operating costs based on VRE FY15 average cost per train mile Source: VRE cost estimates 2016

10 Refined and Yard Sites Source: GIS Data Prince William County 2015.

11 Broad Run Constraints Existing Conditions Broad Run Yard Expansion Expansion of existing storage tracks and additional storage tracks needed to accommodate longer and more trains. Floodplain and airport limit expansion of the yard to the west and east. Extension of existing storage tracks for longer trains encroaches on platform. Expansion storage tracks for more tracks eliminates platform altogether. Current Broad Run station and parking closed. New relocated Broad Run station near Godwin Drive and Prince William Parkway. Expansion would accommodate 12 ten-car trainsets plus spares. Source: Google Earth


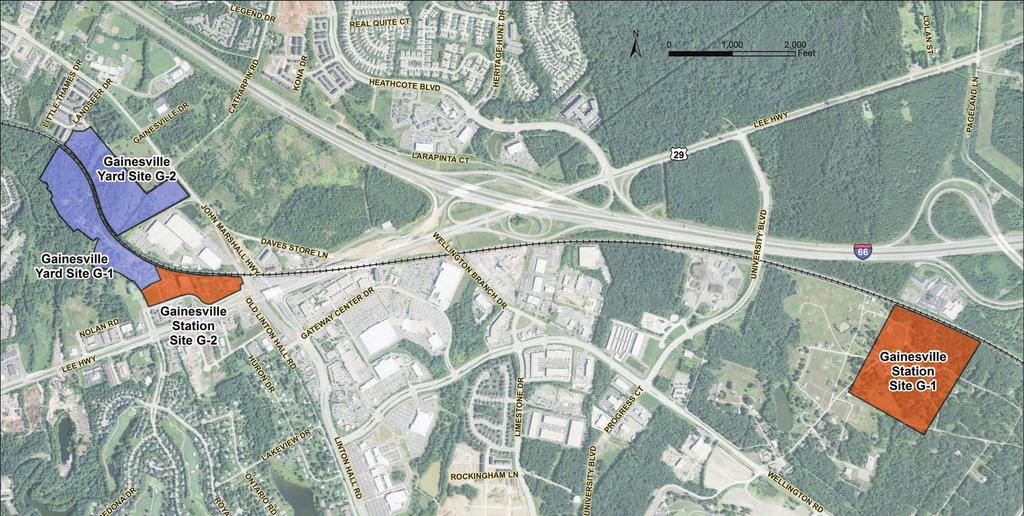
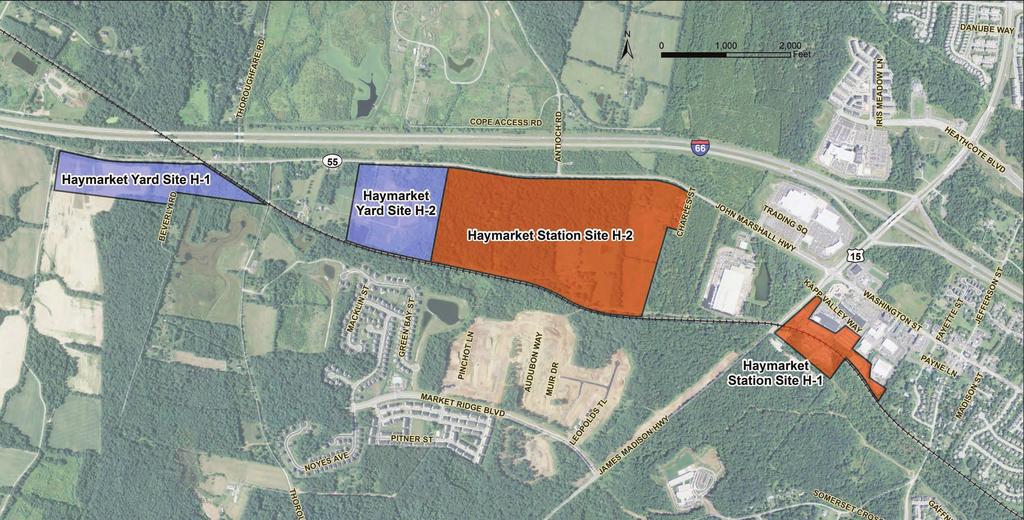
12 Refined and Yard Sites Broad Run (Relocated) (Two Options) Haymarket
13 Refined Alternatives Broad Run (Relocated) Manassas Expand existing Broad Run yard to accommodate 12 ten-car trainsets plus spares Relocated station east of Manassas Regional Airport Vehicular access from Prince William Parkway or Godwin Drive Opportunity for mixed-use station area development Proposed Yard Proposed Manassas Opportunity for mixed-use station area development Requires track realignment for station platform Close Broad Run station and yard Proposed Broad Run Closed Broad Run ; Expanded Broad Run Yard (Two Options) Haymarket Proposed Yard B A/B Proposed (s) Proposed Manassas 2 station option (A) 3 station option (B) Opportunity to anchor mixed-use station development Close Broad Run station and yard Proposed Haymarket Yard Proposed Haymarket Proposed Proposed Manassas Requires track realignment for station platform Pending development proposals limit available land Greatest potential for environmental impacts or yard in Rural Crescent would require a Public Facility Review Close Broad Run station and yard All refined alternatives assume 22 daily trains at 20 minute headways during morning and evening peak periods. Each alternative assumes an end-of-line yard.
14 Cost per Rider Existing Service Broad Run (Relocated) 2 stations 3 stations Haymarket Revenue Trains Daily Riders (2040) 1 10,220 15,350 15,820 16,100 16,340 16,460 Total Capital Cost (2016$) (millions) 2 -- $345 M $580 - $633 M $572 - $616 M $592 - $631 M $612 - $660 M Total Operations & Maintenance Cost (2016$) (millions) -- $36 M $37 M $40 M $40 M $45 M Cost per Rider Operating Cost per Rider ($) 3 $11.31 $9.34 $9.23 $9.98 $9.83 $10.89 Capital Cost per Rider ($) 4 N/A 5 $3.03 $5.44 $5.53 $5.51 $5.80 Total Cost per Rider ($) N/A 5 $12.37 $14.66 $15.51 $15.35 $16.69 Incremental Cost per Incremental Rider vs. Existing Service Incremental Operating Cost per Incremental Rider N/A $5.44 $5.43 $7.68 $7.38 $10.22 Incremental Capital Cost per Incremental Rider N/A $9.06 $15.36 $15.14 $14.72 $15.30 Incremental Total Cost per Incremental Rider N/A $14.49 $20.79 $22.82 $22.10 $ VRE/MWCOG Travel Demand Model September Total capital cost assumes stations, construction of 1 additional track (2 tracks total), equipment maintenance and storage facility, and rolling stock (diesel locomotives, cab cars, can coaches including spares). 3. Operating costs based on VRE FY15 average cost per train mile. 4. Annualized capital cost based on FTA useful life estimates and assume 251 service days/year. 5. Capital costs associated with existing service TBD.