Intermodal Is Leading The Way June 2013
|
|
|
- Elvin Patterson
- 5 years ago
- Views:
Transcription


1 Intermodal Is Leading The Way June 2013 Presented by: Keith S. Stauber, SIOR Regional Managing Director

2 Sensitivity Analysis The correlation between TEUs and industrial real estate occupancy Port-centric real estate markets whose historic warehouse occupancy rates mirror swings in cargo volume are considered sensitive. Goods typically pass through these ports on their way to destinations further inland. In contrast, those markets found not to be sensitive typically support significant population bases and are robust and diverse enough to avoid these fluctuations. Port of Seattle Moderately sensitive 1,855,680 TEU vol percent occupied Port of NY/NJ Not sensitive 5,529,909 TEU vol percent occupied Port of Baltimore Moderately sensitive 677,800 TEU vol percent occupied Port of Tacoma Moderately sensitive 1,711,133 TEU vol percent occupied Port of Virginia Moderately sensitive 2,105,887 TEU vol percent occupied Port of Oakland Moderately sensitive 2,344,392 TEU vol percent occupied Port of Charleston Sensitive 1,514,587 TEU vol percent occupied Port of Savannah Port of Los Angeles Not sensitive 8,077,714 TEU vol percent occupied Port of Long Beach Not sensitive 6,045,662 TEU vol percent occupied Sensitive 2,966,221 TEU vol percent occupied Port of Jacksonville Cargo volume > 4 Million TEU volume < 1 Million TEU volume Seaport sensitivity Sensitive Moderately sensitive Port of Houston Sensitive 1,922,479 TEU vol percent occupied Port of Miami Moderately sensitive 909,000 TEU vol percent occupied Sensitive 923,009 TEU vol percent occupied 1-4 Million TEU volume Not sensitive Source: Jones Lang LaSalle Research Methodology: Data set includes warehouse/distribution and manufacturing facilities, 50,000 square feet and greater, owner occupied and leased within a 15-mile radius of each respective port terminal
3 Inland Port Connections 2 1 Phoenix Casa Grande

4 444 Intermodal Traffic U.S. rail intermodal traffic rose 3.0% (35,790 containers and trailers) in May 2013 over May 2012, the 42 nd straight year-over-year monthly increase. The highest weekly average for any May in history, and it s the 12 th highest weekly average for any month in history for U.S. railroads. Year-to-date intermodal volume on U.S. railroads through May was 5,261,051 units, up 4.1% (207,236 units) over the same period in 2012.
5 Demand Drivers for Inland Ports and Intermodal Facilities Truck driver shortage American Trucking Association (ATA) estimates there currently is a shortage of 20,000 30,000 truck drivers. By 2022 shortage expected to grow to 240,000 drivers Trucking regulations New Hours of Service to take effect July 1, Will remove 3% - 5% of supply chain capacity from the market. Domestic intermodal traffic (same day delivery phenomenon) New products frozen and fresh food 5
6 Intermodal Rail Things to Consider Transportation costs account for 50% of the average distributor s bottom line. Intermodal rail is one-third the cost of trucking. Labor costs in China are nearly on par with Mexico s; Mexico s political environment is more stable than China s. Near-shoring is here to stay. Heavy durable goods (such as furniture) to be increasingly manufactured closer to home. Why? Reduces shipping costs. The break-even point for trucking is presently 1,000 miles. (Revenue exceeds expenses past this mark.) A few years from now, it will be 500 miles. Today s institutional developers and investors are focused on markets with domestic intermodal infrastructure in-place. Markets with intermodal rail usually have the highest rent growth. 6

7 Class I Intermodal Facilities BNSF = 31 US CSX = 40 US NS = 51 US Union Pacific = 32 US Canadian National = 10 US and 13 Canadian Canadian Pacific = 6 Canadian only Total = 164 US, 19 Canadian BNSF Canadian National Canadian Pacific CSX Norfolk Southern Union Pacific Rail 7

8 Class I Intermodal Facilities Number of Locations Rail 8
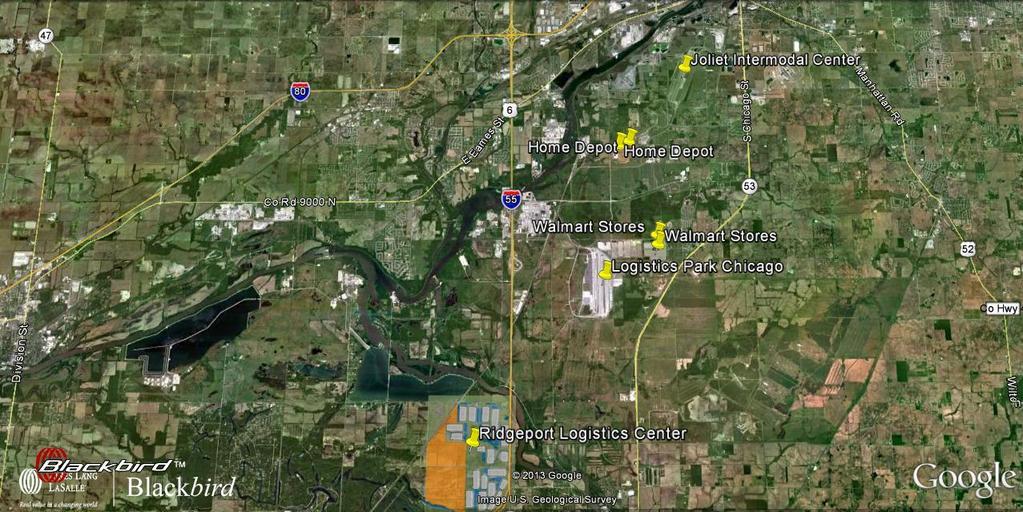
9 Notable Inland Ports Dallas/Ft. Worth Alliance = 9,600 acres (BNSF/Union Pacific) Chicago Logistics Park Chicago = 3,000 acres (BNSF) Joliet Intermodal Center = 3,000 acres (Union Pacific) RidgePort Logistics Center = 1,500 acres (BNSF) Kansas City Logistics Park Kansas City = 1,000 acres (BNSF-new) Memphis RidgePort Memphis = +1,000 acres (CN) 9
10 Inland Ports Keys to Success Access to sea ports Proximity to consumption zones Have products and goods to provide for backhaul Connectivity to multiple interstates 10

11 Inland Port Connections 2 1 Phoenix Casa Grande

12 JLL Port Projects 12

13 JLL Port Projects 13

14 JLL Port Projects 14
15 Why Chicago Succeeds As An Inland Port 1.3 billion s.f. of industrial space in the Chicagoland area 9 million people in the Chicago Metro area All of the major institutional investors have a presence in the Chicago industrial real estate market. Chicago is one on the busiest ports in the US with over 3 million TEU s per year. Compare to LA/Long 14 million TEU s per year. Six Class I railroads converge in Chicago BNSF, Union Pacific, CSX, NSF, Canadian National and Canadian Pacific 15
16 16