I-90 Smart Road: Operational Features. October 18th, 2017 Scott Lee, P.E., TIMS Project Manager, Parsons Amarpal Matharu, P.E.
|
|
|
- Brenda Noreen McDaniel
- 5 years ago
- Views:
Transcription
1 I-90 Smart Road: Operational Features October 18th, 2017 Scott Lee, P.E., TIMS Project Manager, Parsons Amarpal Matharu, P.E., Illinois Tollway
2 Tollway ITS History Up To 2016 Over 1050 CCTV Cameras 45 Dynamic Message Signs 48 PCMS + Contractor Message Signs (40-50) 250 Microwave Vehicle Detection Sensors (MVDS) 486 Vehicles with AVL 16 Roadway Weather Information System Sites 5 Weigh-In-Motion 3 Ramp Queue Detection Systems Travel times - IPASS, RTMS, Bluetooth, and Sensys Integrated to Regional ATIS Gateway alerts to media & Trucking Industry 2

 Approximately 350 new signs")
3 ITS Devices 2016 to 2017 CCTV Additional 90 cameras DMS Increased from 45 to 54 Microwave Vehicle Detection Sensors Increased from approximately 250 to 355 WIM Increased from 5 to 7 Lane Control Signs (ATM) Approximately 350 new signs added 3


4 Communications Network 2016 to IPDC s added 29 new ATM Gantries New Cisco switches IP relays IPDC equipment Generators In addition to existing fiber backbone and new power Frequent access to power and communications 4
5 What s a Smart Road? A road that fulfills mission of safety A road that fulfills goals for efficiency Beyond structural and physical traits Equipped with full complement of monitoring and supportive technologies to support operations and traveler information Equipped with reliable communications and power Provides real-time decision support Provides operational flexibility to meet regional and/or routespecific demands Provides methods to measure and analyze performance on multiple levels Prepared for connected and autonomous vehicle era 5

6 6
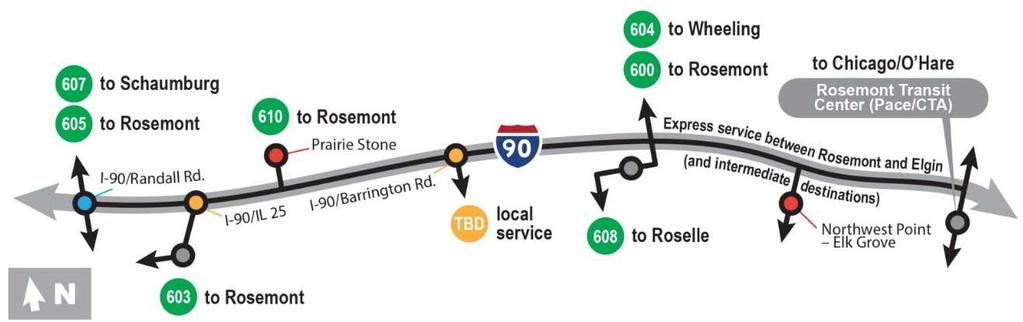
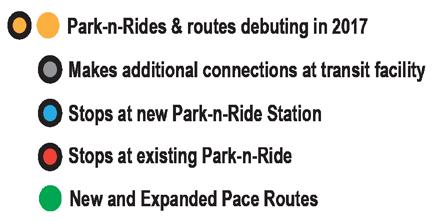
 from Barrington Road to the Kennedy Expressway (near O Hare International")
 Controlled through Active Traffic")
7 What is the I-90 Smart Road? 16-mile route on the Jane Addams Memorial Tollway (I-90) from Barrington Road to the Kennedy Expressway (near O Hare International Airport) Fully equipped to monitor CCTV (120) with hazmat placard legibility Vehicle detection (80) Fully equipped to manage 29 gantries with lane control signals ½-mile spacing 25 gantry DMS 354 Lane Control Signals (LCS) Controlled through Active Traffic Management (ATM) techniques Flex Lane with Pace Suburban Bus Shoulder operations Lane controls Advisory speeds 7

8 Systems Engineering Approach Concept Operations Design Site Visits System Requirements Software Design Software Development Testing and Training Device Integration Turn-on 8
 and Virginia")


9 Design Inputs and Requirements Development Site Visits to Washington (I-5 and I-90) and Virginia (I-66) Validation design concepts Review of operations and procedures Q&A on the tough scenarios Understanding of TOC Staffing, Training and Maintenance ATM roll-out success strategies Reflect on Lessons Learned 9


10 Design Inputs and Requirements Development Video Visualizations Major Incident Stationary Work Zone Partial System Failure Weather Scenario Discussions Incident Management Coordination TIMS Illinois State Police District 15 Pace 10

11 Software Development Keys Clear System Requirements Focus on managing traffic not equipment Flexibility within the design Usable Configurable Smart ATM Interface Mock-up Design Phase 11

12 Operator Actions Clear presentation of Response Plans Consistent workflow Ability to efficiently review and activate Clear Rules Consistent Messaging 12


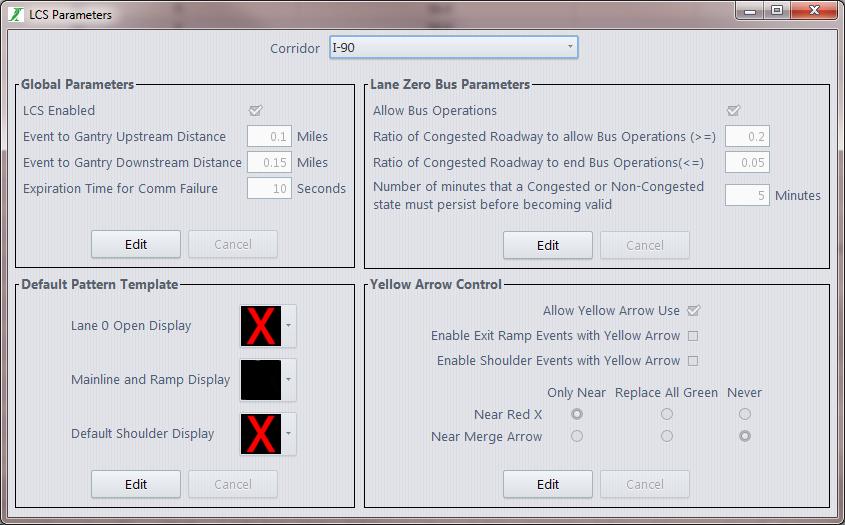
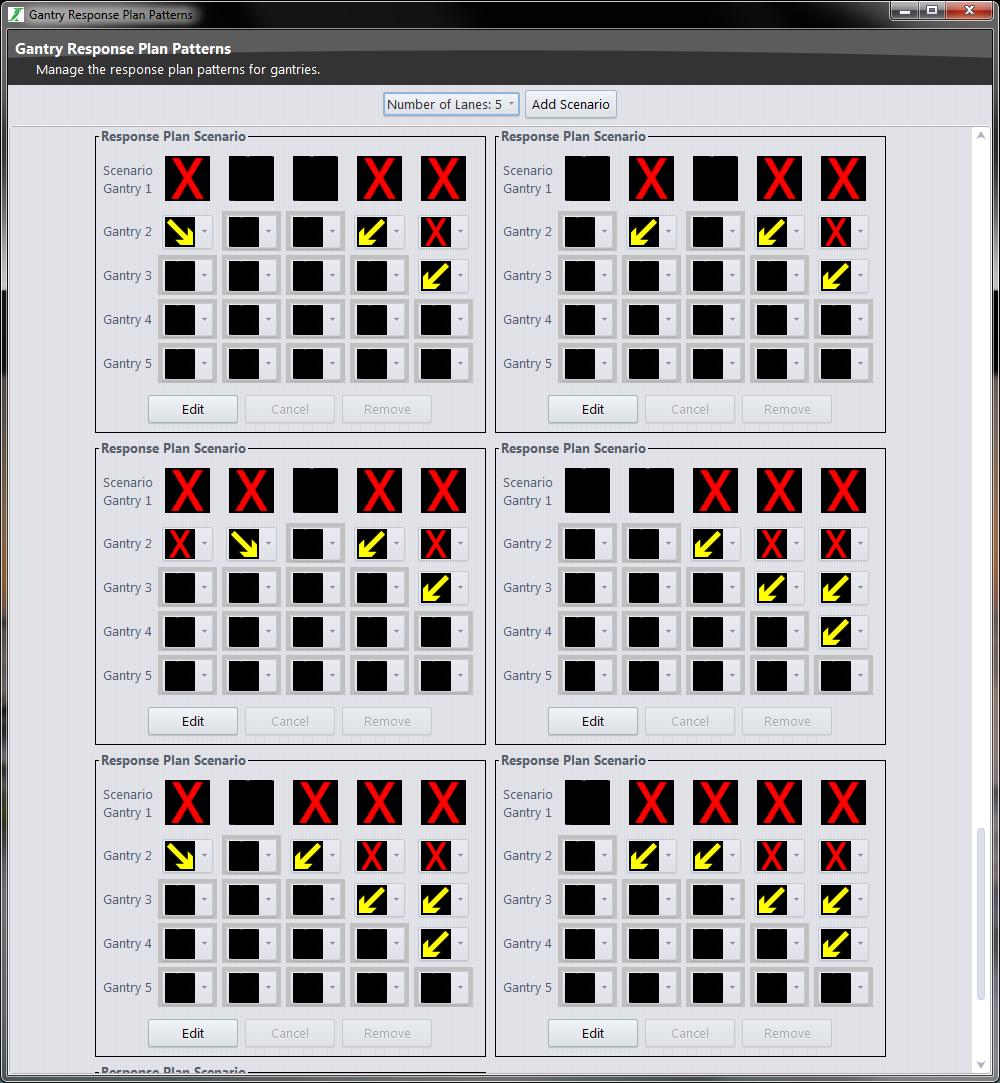
13 Lane Control Signals - Arrows and X s How to apply them to the Gantries - Content - Gantry Selection Default Displays - Desired vs Lessons Learned Consideration for Responders - Yellow arrows and pattern recommendations Approval Process - Operational scenario walkthrus - Graphic content and usage approval FHWA and IDOT coordination - Consistency with outreach efforts 13
14 14

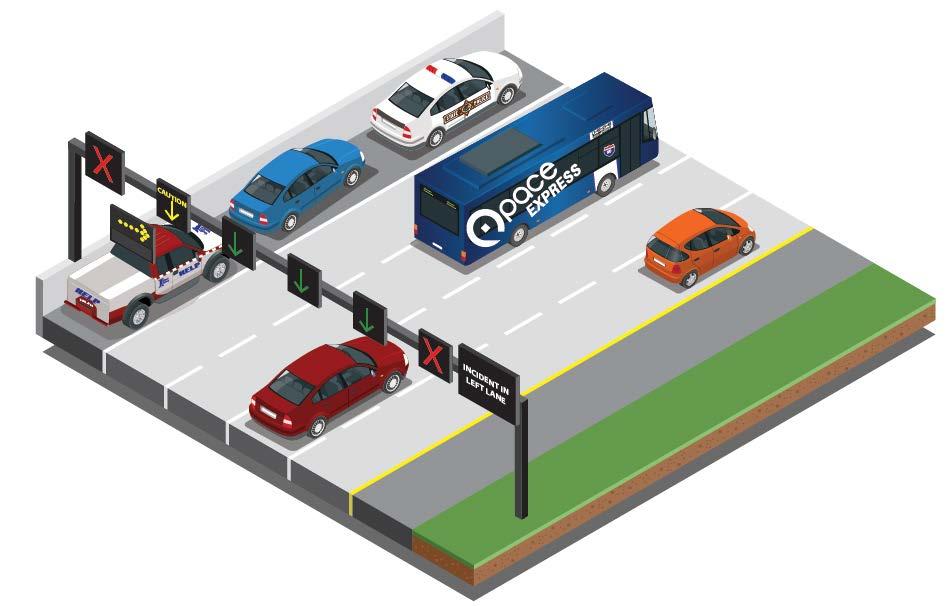
15 Flex Lane Operations Pace agreement discussions Flex Lane use by Pace in times of congestion to provide reliable service Maintaining primary use for maintenance and responder use during all other conditions Sectional control assignments based on Pace routing and interchanges Notifications 15


16 Available for Future Use - Variable Advisory Speeds When to apply? Congestion End-of-queue Special events such as weather Application among multiple gantries Gantry differentials Minimum speeds Automated computations Gantry to nearby conditions analysis Trooping Computational control how many cycles? Testing data! Ability to evaluate in real time 16

17 Testing and Training Integration - Test Gantry - Formal Testing and Acceptance Messaging and Equipment Operational Scenarios Demonstration System Live Scenarios Coordinated operational tests with Pace 17

18 Day 1 - September 5 th! Flex Lane (left shoulder) for use by Pace Suburban Bus - Congestion conditions - 3 Sections: , , MP Use of arrows and Xs for lane controls - Lane blocking events - Shoulder operations o Scott s Law - Opening of either shoulder to general purpose traffic - Availability of variable speeds 18
19 Summary of Corridor Operations Events Managed Bus Lane Events* Total Response Plans Total Lane Blocking September October (thru 9 th ) September October (thru 9 th ) September October (thru 9 th ) EB WB total *Congestion based Pace Events Primarily EB AM Eastern Section (near Tri-state) Primarily WB PM Central Section near I-290/Roselle) 19


20 September Distribution Response Type Eastbound Westbound Wrong Way Driver 0% ATM Manual 0% Stall 32% Roadwork 1% Accident 3% Bus Lane Manual 1% Bus Lane 2% Debris 3% Police Activity 55% Fire 0% Med. Emergency 0% Pedestrian 1% Other 2% Accident ATM Manual Bus Lane Bus Lane Manual Debris Fire Med. Emergency Other Pedestrian Police Activity Roadwork Stall Wrong Way Driver 20
21 Opening of Flex Lane I-90 EB Crash Two right lanes blocked 21

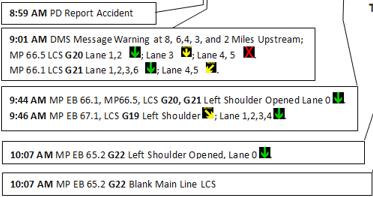

22 Event Timeline 22

23 Speed Profile EB traffic flow ROSELLE EXIT ROSELLE ENTRANCE TIME 23

24 Open Flex Lane 1 minute before flex Lane Open to 2 minutes after demonstrates use of the lane <Play Video Here> 24
25 Summary of Key Metrics Measure With Flex Lane Traditional Ops* Queue Length (miles) 2 miles 4.5 miles Delay (veh-hours) <100 >400 Cumulative Vehicles Clearance Time (min) all lanes open Delay Clearance Time (min) return to normal operations *estimated Event Time 25
26 Current Corridor Activities LCS Maintenance Activities - Monitoring of device performance - Network activities - Polling consistency and device errors - Metrics Response Plan Edits - How often? - Entrance ramp handling - Exit ramp handling Flex Lanes for General Purpose Traffic - Local to event vs. within the queue - Multi-lane response time with Flex Lane Video Analysis 26
 Routine Reporting - General - Visual Inquiry Reporting - Template Special Provisions Considerations - Interchange installations - Operational")
27 Current Corridor Activities Operator Performance - Consistency - Opportunities for additional training Monitoring of Pace Operations - Considering minor adjustment to west end of central section (past Roselle) Routine Reporting - General - Visual Inquiry Reporting - Template Special Provisions Considerations - Interchange installations - Operational Characteristics 27
28 ITS Maintenance Staff and Smart Road Tollway ITS Deployment Engineer Network Engineer ITS Inventory Manager 2 ITS Technicians (new contract adds one contractor) ITS Network and Maintenance Administration Contract Provides oversight of ITS field device maintenance contract Additional 3 staff to support ITS maintenance ITS Field Device Maintenance Contract Field repairs Traffic Operations Center Increased from 4 to 8 Supported by Traffic and Incident Management System (TIMS) Staff 28
29 Need to Create ITS Maintenance Guidelines Already had existing manuals and requirements documents Already performing ITS maintenance system wide But, adding significantly more devices and Adding a new ATM system NEED to put all assumptions and requirements into writing and to clarify processes NEED to develop a formal work flow decision matrix Process to Create ITS Maintenance Guide Stakeholder input Lessons Learned Assumptions/Decisions Criticality Work Flow 29


30 Stakeholders Many subgroups within Tollway Most Tollway; some consultants or contractors Include Legal and other administrative stakeholders 30
31 Industry Lessons Learned Contacted Washington State DOT Virginia DOT Minnesota DOT Wisconsin DOT Caltrans City of Toronto Main Lessons Learned Need for spare parts inventory Lane closures weekly Mix of contracted and internal staff Mix of priorities and operations Pros/Cons of outsourcing Many stress preventative maintenance 31


32 Key Issues LCS are the only devices that require a lane closure overnight DMS may require a shoulder closure or an outside lane closure which is allowed off peak Warranty issues with LCS for the first 12 months 32
33 Four Levels of Criticality Emergency - 4 hour on site response - Repaired 7 days a week, 365 days a year Critical - 24 hour response time Monday through Friday Standard - 72 hour response time Monday through Friday Preventative - Repair next time you are at the site for other reasons 33

34 Future Concepts Add SmartRoad and Flex Lanes to Central Tri- State Tollway (I-294) Opened to traffic during peak travel times Opened as special-use lanes for connected or autonomous vehicles Extended to local roads to alert drivers of any incidents ahead ented on September 28,
35 Contact Information Amarpal Matharu, P.E. Traffic Operations Manager Illinois Tollway (630) Scott Lee, P.E. Senior Project Manager Parsons (847)
36 THANK YOU