THE SOUTHWEST JOHNSON COUNTY AREA PLAN
|
|
|
- Mary Cunningham
- 5 years ago
- Views:
Transcription


1 KANSAS DEPARTMENT OF TRANSPORTATION JOHNSON COUNTY CITY OF EDGERTON CITY OF GARDNER MID-AMERICA REGIONAL COUNCIL THE SOUTHWEST JOHNSON COUNTY AREA PLAN KDOT PROJECT NO. 046-KA FELSBURG HOLT & ULLEVIG RDG PLANNING & DESIGN CFS ENGINEERS NOVEMBER, 2013
2
3 ACKNOWLEDGEMENTS The Southwest Johnson County Area Plan was developed under the guidance of a Core Team of staff from the Plan Sponsors. The Plan also received significant input from an Advisory Committee, Public Officials and area Stakeholders. STUDY SPONSORS Kansas Department of Transportation (KDOT) Johnson County City of Gardner City of Edgerton Mid-America Regional Council (MARC) CORE TEAM David Gurss Thomas Dow Michael Moriarty Kim Qualls Joel Skelley Jim Pickett Howard Lubliner David Schwartz Dean Palos Cliff Middleton Brian Pietig Geoffrey Vohs Paul Greeley Penny Postoak Ferguson Frank Denning Kevin Cavanaugh Mell Henderson Amy Kynard Tim McEldowney Beth Linn KDOT Project Manager KDOT KDOT KDOT KDOT KDOT KDOT KDOT Johnson County Johnson County Johnson County Johnson County Johnson County Johnson County Johnson County Johnson County MARC City of Gardner City of Gardner City of Edgerton ADVISORY COMMITTEE Glyn Powers Edgerton Council Member Ron Conus Edgerton Planning Commissioner Randy Gregorcyk Gardner Council Member Sheri Barber Gardner Planning Commissioner George Schlagel Johnson County Park and Recreation District Board Member Andy Copeland Area Resident John Toplikar Johnson County Commissioner Roger Mason Johnson County Planning Commissioner J.P. Lefmann Johnson County Township Zoning Board Member Tom Riederer SW Johnson County Economic Development President Janet McRae Miami County Economic Development Director Patrick Robinson NorthPoint V.P. of Development Jerry Williams Attorney Gary Diener Director of Operations, Gardner Edgerton USD 231 James Joerke Johnson County Deputy Director of Heath & Environment CONSULTANT TEAM Felsburg Holt & Ullevig - Omaha, Nebraska Kyle Anderson, Rick Haden, Mark Meisinger, and Steven Marfitano RDG Planning & Design - Omaha, Nebraska Marty Shukert and Pat Boddy CFS Engineers - Topeka, Kansas Dan Holloway and Sabin Yanez i
4 TABLE OF CONTENTS Part One: Introduction 1-1 Purpose of the Plan 1-2 Area of Impact 1-3 Study Approach 1-4 Project Sponsors 1-5 Related Studies 1-5 Previous Land Use Plans 1-5 Transportation Plans 1-6 Natural Resources and Utilities 1-8 Implementation Plan 1-8 Part Two: Land Use: Demand and Absorption 2-1 Base Population Change: Future Base Growth for Gardner and Edgerton 2-3 Growth Related to the Intermodal Facility and Collateral Development 2-4 Land Development Needs 2-6 Summary of Land Development Needs 2-9 ii Part Three: Development Influences: Natural Resources & Utilities 3-1 A Watershed Approach 3-2 How the Watershed Approach Works 3-4 Wetlands and Streams 3-6 Floodplains 3-6 Slopes 3-7 Groundwater 3-7 Hydrologic Soils 3-8 Hydric Soils 3-8 Vegetation 3-9 Resource Extraction 3-9 Composite Mapping 3-10 Development Suitability 3-12 Open Space Preservation 3-13 Green Infrastructure Potential 3-14 Utilities and Urban Infrastructure 3-15

5 TABLE OF CONTENTS Part Four: Land Use Scenarios 4-1 Scenario Variables 4-2 Land Use Scenarios 4-4 Scenario One: Low Industrial Build-Out 4-6 Scenario Two: High Industrial Build-Out 4-10 Scenario Three: Mid-Level Build-Out/Gardner Road Interchange Focus 4-14 Scenario Four: High Build-Out/Northside Development 4-18 Part Five: The Preferred Land Use Plan 5-1 Preferred Future Land Use Plan 5-4 Land Use Types 5-6 Yield Projections 5-8 Transportation Analysis Zones: Assigning Population and Employment 5-10 Development Sequence 5-11 Special Study Areas 5-12 Special Study: Minimizing Impact of Large Warehouses 5-13 Special Study: Mildale Farm and Big Bull Creek Park 5-15 Special Study: An Urban Center at the Gardner Interchange 5-16 Special Study: The Gardner/Edgerton Edge 5-18 Part Six: Transportation 6-1 Introduction 6-2 Functional Classification 6-2 Existing and Committed Street Network 6-4 Existing (2010) Traffic Volumes 6-6 Traffic Forecasting Methodology 6-8 Adjustments to the KDOT 5-County Model 6-9 Future Truck Traffic Generation 6-10 Truck Traffic Generation 6-12 Major Truck Routes 6-13 Total Traffic Assignment 6-14 Traffic Operational Analyses 6-18 U.S. 56/199th Street/Sunflower Road Intersection 6-30 Opening Day Improvements 6-30 iii
6 TABLE OF CONTENTS Interim Improvements 6-30 Ultimate Configuration th Street Improvements 6-34 Design Standards 6-36 U.S. 56 Highway 6-38 Access Management Plan 6-42 Principles of Access Management 6-42 Existing Access Management 6-44 Recommended Roadway Network Improvements 6-46 Comprehensive Arterial Roadway Network Plan (CARNP) Update 6-50 Part Seven: Active Transportation 7-1 Purposes of Active Transportation 7-2 Existing Facilities 7-3 Infrastructure Types 7-4 The Active Transportation Network 7-5 Bicycle/Pedestrian Crossings and Support Facilities 7-10 Regional Active Transportation Connections 7-12 Public Transportation 7-12 Part Eight: Community Engagement 8-1 Public Involvement Goals 8-2 Public Involvement Objectives 8-2 Stakeholder Coordination 8-2 Public Participation Opportunities 8-3 Appendices Appendix A: Appendix B: Appendix C: Appendix D: Appendix E: Appendix F: Successful Site Development- A Watershed Approach Land Use Projections and Concepts Green Infrastructure Transportation Modeling Transportation Public Involvement Documents iv
7 LIST OF FIGURES Figure 1.1: KCIMF and LPKC Location 1-2 Figure 1.2: Major Area Features 1-3 Figure 3.1: Development Suitability Map 3-12 Figure 3.2: Preservation Areas Map 3-13 Figure 3.3: Green Infrastructure Suitability Map 3-14 Figure 4.1: Scenario One Development Diagram 4-6 Figure 4.2: Scenario One Land Use Concept 4-9 Figure 4.3: Scenario Two Development Diagram 4-10 Figure 4.4: Scenario Two Land Use Concept 4-13 Figure 4.5: Scenario Three Development Diagram 4-14 Figure 4.6: Scenario Three Land Use Concept 4-17 Figure 4.7: Scenario Four Development Diagram 4-18 Figure 4.8: Scenario Four Land Use Concept 4-21 Figure 5.1: Preferred Future Land Use Concept 5-5 Figure 5.2: Central Planning Area 5-9 Figure 5.3: Preferred Land Use Scenarios with Transportation Analysis Zones 5-11 Figure 5.4: Opening Day Development Diagram 5-12 Figure 5.5: Midway (year ) Development Diagram 5-12 Figure 5.6: Conservation Based Park Concept 5-15 Figure 5.7: Gardner Interchange Development Concept 5-17 Figure 5.8: Development Concept along the Gardner/Edgerton Edge 5-19 Figure 6.1: Study Area Functional Classification Map 6-3 Figure 6.2: Existing and Committed Street Network 6-5 Figure 6.3: Existing (2010) Traffic Volumes 6-7 Figure 6.4: Southwest Johnson County Traffic Analysis 6-9 Figure 6.5: 2040 Intermodal Facility Truck Distribution 6-12 Figure 6.6: 2040 Warehouse Truck Distribution 6-12 Figure 6.7: 2040 Truck Assignments Preferred Alternative 6-13 v
8 LIST OF FIGURES Figure 6.8: Total Truck Traffic, Preferred Alternative: Opening Day 6-14 Figure 6.9: 2040 Total Traffic, Preferred Alternative 6-15 Figure 6.10: Midway 2025 Total Traffic, Preferred Alternative 6-16 Figure 6.11: 2040 Total Traffic, Scenario 4 Land Use 6-17 Figure 6.12: 2013 Opening Day Levels of Service 6-22 Figure 6.13: 2025 Midway Buildout Levels of Service, Preferred Alternative 6-24 Figure 6.14: 2040 Preferred Alternative Levels of Service 6-26 Figure 6.15: Proposed Interim Improvements at U.S. 56/199th Street/ Sunflower Road 6-31 Figure 6.16: Grade Separated Concept for U.S. 56/199th Street/Sunflower Road 6-33 Figure 6.17: Suggested Four-Lane Typical Section for 199th Street near Mildale Farm 6-34 Figure 6.18: Perspective View of Four-Lane Cross Section Proposed for 199th Street 6-35 Figure 6.19: Roadway Segments Removed by KCIMF 6-51 Figure 6.20: Recommended CARNP Modifications 6-53 Figure 7.1: Proposed Active Transportation Network 7-6 Figure 7.2: Active Transportation Network by Infrastructure Type 7-7 Figure 7.3: Regional Connections 7-13 vi
 and Claimed Jobs 2-5 Table 2.4: Projected Warehouse Development and Household Growth by Area 2-6 Table 2.5: Floor Area Ratios at Comparable Facilities 2-7 Table 2.")
9 LIST OF TABLES Table 2.1: Population Change, Gardner and Edgerton 2-2 Table 2.2: Projected Population Change Based on Metro Growth, Gardner and Edgerton 2-3 Table 2.3: Gross Floor Area (GFA) and Claimed Jobs 2-5 Table 2.4: Projected Warehouse Development and Household Growth by Area 2-6 Table 2.5: Floor Area Ratios at Comparable Facilities 2-7 Table 2.6: Warehouse Land Area, per Build-out Level 2-7 Table 2.7: Required Residential Land Area for Study Area 2-8 Table 2.8: Required Commercial Land Area, Table 4.1: Scenario One Yield 4-8 Table 4.2: Scenario Two Yield 4-12 Table 4.3: Scenario Three Yield 4-16 Table 4.4: Scenario Four Yield 4-20 Table 5.1: Household and Employment Estimating Factors 5-8 Table 5.2: Preferred Scenario - Household and Employment Estimating Factors 5-10 Table 6.1: Existing and Committed Street Network 6-4 Table 6.2: Projected Trips for KCIMF 6-10 Table 6.3: Projected Warehouse/Distribution Center Truck Traffic 6-11 Table 6.4: Level of Service (LOS) Criteria 6-20 Table 6.5: 95% Queue Length Summary with Normal Operation AM/PM Peak Hour 6-28 Table 6.6: East-West Roadways 6-36 Table 6.7: North-South Roadways 6-37 Table 6.8: Committed Roadway Network Improvements 6-47 Table 6.9: 2025 Recommended Roadway Network Improvements 6-48 Table 6.10: 2040 Recommended Roadway Network Improvements 6-49 Table 7.1: Components of Active Transportation Network (Routes 1-5) 7-8 Table 7.1: Components of Active Transportation Network (Routes 6-11) 7-9 Table 7.2: Intersection Conditions 7-11 vii
10 THIS PAGE INTENTIONALLY LEFT BLANK
11 PART ONE INTRODUCTION 1-1

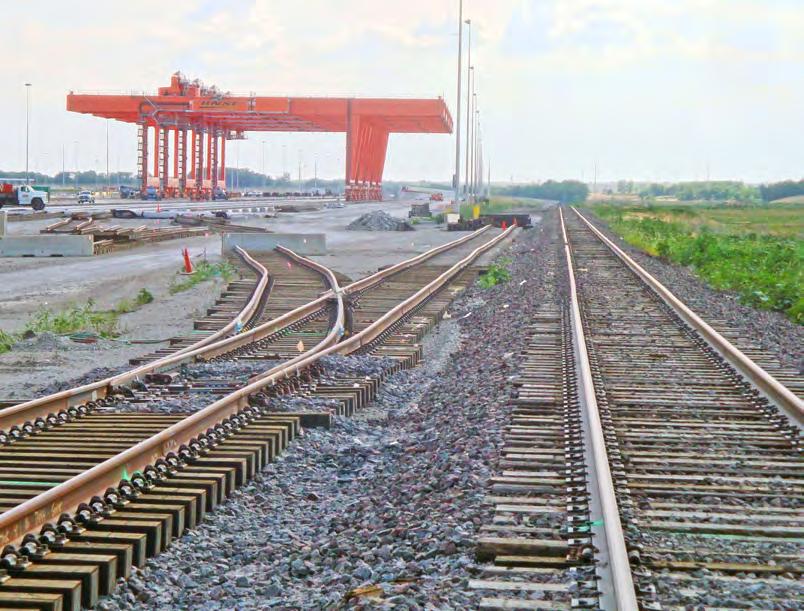
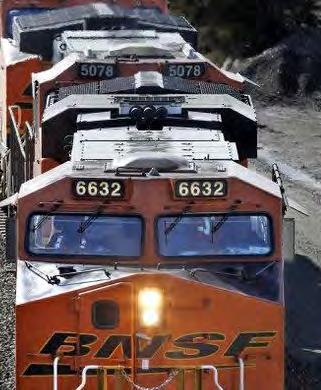
12 INTRODUCTION The construction of the BNSF Kansas City Intermodal Facility (KCIMF) in Southwest Johnson County will have a dramatic impact on how its surroundings develop and on the transportation system necessary to serve this anticipated growth. What was once the edge of the Kansas City metropolitan area will now become a burgeoning center of industry, employment, and accelerated development. At the same time, the Gardner-Edgerton area also contains two quality communities. The overall goal of this document is to create a development Figure 1.1: KCIMF and LPKC Location vision that unites these various and sometimes conflicting forces, and helps the state, county, cities, and other decision makers manage this change in ways that are beneficial to both the economic and natural environments. In addition to the 440 acre KCIMF, NorthPoint Development is also moving ahead quickly with the development of the 560 acre Logistics Park Kansas City (LPKC). Both are projected to open in the Fall of The location of the intermodal facility and LPKC are shown in Figure 1.1. The KCIMF will have electric cranes transferring approximately 0.5 million container lifts between rail cars and trucks per year initially, and ultimately growing to 1.5 million container lifts per year at full build-out. One lift represents one container movement onto or off a rail car. The surrounding LPKC will be able to accommodate up to seven million square feet of distribution centers and warehouse facilities. In addition to the seven million square feet of development within LPKC, market studies indicate the area could draw an additional five to nine million square feet of distribution centers and warehouse facilities once the KCIMF is operating at full capacity. Purpose of the Plan Source: Johnson County AIMS The impact of the intermodal facility and the associated development will result in the need for additional housing and retail development to serve this emerging employment center and the surrounding region. The purpose of this Southwest Johnson County Area Plan is to identify and evaluate potential development scenarios and determine the transportation system necessary to support that development. 1-2
.")
13 INTRODUCTION Area of Impact The study area consists of approximately 21 square miles surrounding the Kansas City Intermodal Facility and the Logistics Park KC (Figure 1.2). The study area limits extend from 175th Street on the north to 215th Street on the south (Johnson/Miami County Line). The western limit of the study area is generally located between Sunflower Road and Edgerton Road. The eastern study boundary limit is located between Gardner Road and Moonlight Road. Figure 1.2: Major Area Features A number of significant physical features and diverse land uses are located within the plan boundaries. The locations of these features are also shown in Figure Gardner Municipal Airport 2 - U.S. 56 Highway 3 - BNSF Railway corridor and KC Intermodal Facility 4 - KC Logistics Park 5 - KCPL Wetlands 6 - Suburban Lawn & Garden Gardner Farm 7 - I-35 and Gardner Road Interchange 8 - I-35 and the new Interchange at Homestead Road 9 - I-35 and Sunflower Interchange 10 - Bull Creek, its tributaries, and associated flood zones 11 - Big Bull Creek Park 12 - Peppertree Lane residential subdivision 13 - The new Big Bull Creek Wastewater Treatment Facility 14 - Hillsdale Lake in Miami County directly south of the Plan area and just south of the Johnson County line 15 - City of Edgerton 16 - Rock Quarry 17 - Gardner Junction Park 18 - City of Gardner 19 - Mildale Farm 20 - Martin Creek Park 21 - Nike School 1-3

 State highway improvements required to support growth. 3) Identification and analysis of issues associated with the potential realignment of U.S. 56 along 199th Street from Edgerton to I-35.")
14 INTRODUCTION 20 Study Approach While the primary purpose of this Area Plan is to identify and evaluate land use scenarios and the transportation network necessary to accommodate the growth, several specific components were identified as outcomes of the study. These key components include: Residential acreage in study area. 1) An update to Johnson County s Comprehensive Arterial Roadway Network Plan (CARNP) with recommendations and capital program phasing for additional transportation system improvements. 2) State highway improvements required to support growth. 3) Identification and analysis of issues associated with the potential realignment of U.S. 56 along 199th Street from Edgerton to I-35. 4) A bicycle/pedestrian trail plan/concept plan for Johnson County Parks District land in the area with connections between Edgerton, Gardner, and Hillsdale Lake in Miami County. 5) A land use component testing alternative land use scenarios using travel demand modeling and highway capacity analysis software to ensure that planned developments will not exceed the capacity of the transportation system. 6) A natural resource component with best management practices (BMPs) from Mid America Regional Council (MARC) Eco-Logical Land Cover Classification to protect Hillsdale Lake and Johnson County Parkland as development occurs. BNSF Intermodal Facility KC 1-4
15 INTRODUCTION Project Sponsors Due to the regional impacts associated with the new intermodal facility and surrounding development, multiple jurisdictions and agencies partnered together for the development of this Southwest Johnson County Area Plan. Project sponsors include: Kansas Department of Transportation Johnson County Mid-America Regional Council City of Edgerton City of Gardner integrating relevant portions of previous planning efforts into a single document. A review of the following plans for their applicability to this current effort was a key first step in the process. Previous Land Use Plans Land development within the plan area is currently governed by three planning documents: Johnson County s Rural Comprehensive Plan The Gardner Community Development Plan The Edgerton Comprehensive Plan A Core Team with representatives from each jurisdiction or agency was established to provide the guidance and direction throughout the study. An Advisory Committee with a cross section of community leaders, elected officials and key stakeholders was also established to provide input and review study findings. In addition, two briefings for public officials took place during the process to provide decision-makers at the County and the two cities with the opportunity to provide input and comments. Two public open houses were also held to gain input on the future vision for the area. This Public Engagement effort is more fully discussed later in this plan. Related Studies An enormous amount of research, studies and plans have been undertaken over the past few years, producing a wealth of data that bears on the growth and development of the southwestern part of Johnson County. One of the initial tasks in developing a viable and cohesive transportation and land use plan involved extracting and The Rural Comprehensive Plan for Johnson County, This plan establishes Land Use Policy Areas for the unincorporated areas of Johnson County. It shows the area outside of the Gardner and Edgerton city limits as Rural Transition or Urban Fringe and does not reflect recent land use changes due to the Kansas City Intermodal Facility and related development. It also refers to the County Arterial Road Network Plan (CARNP). Gardner Community Development Plan, The Community Development Plan serves as Gardner s comprehensive plan. The future land use map designates the area east of Waverly as urban residential and the area north of 183rd Street around the airport as industrial, while retaining remaining areas outside of the KCIMF as rural. The plan also displays extensive park development south of 191st Street and west of Four Corners Road. The Gardner Priority Growth Area Map identifies the KCIMF extending south to 191st Street and indicates the area east of Waverly Road within the future service areas. The Gardner Transportation Mas- 1-5
16 INTRODUCTION ter Plan includes detailed current (2008), 2015, and 2030 land use. In 2013, Gardner will begin the process of developing a new comprehensive plan. City of Edgerton Comprehensive Plan, The Edgerton Future Land Use Plan predates the changes in land development associated with the KCIMF. The plan proposes low density residential development along most of Edgerton Road. This should be analyzed in conjunction with the future road network. Additional plans that provided a land use component included: BNSF Intermodal Facility, The Logistics Park Kansas City schematic plan shows the BNSF multimodal facility paralleling the BNSF tracks north of 191st Street and west of Waverly Road. The rendering also illustrates 385 acres of warehousing and distribution centers south of 191st Street and east of Four Corners Road, with some warehousing east of Waverly Road and north of 183rd Street. Forecasts have included around 7 million square feet of space within the Intermodal Facility, an additional 7 million square feet in the logistics park directly surrounding the multimodal facility and an additional 7 million square feet of warehouse / distribution in the surrounding area. The amount of additional spin-off development from the intermodal facility was reviewed critically along with peer facilities at Alliance, Texas and Logistics Park Chicago (LPC) southwest of Joliet, Illinois. U.S. 56 Corridor Management Plan (KDOT), The U.S. 56 Management Plan depicted Developable Land as well as Low Growth and High Growth Scenarios for the corridor and the land within one mile on either side. The Plan also identified environmentally sensitive areas. The Plan provided a Consensus Land Use Scenario for the area. Transportation Plans In addition to the land use plans identified in the previous section, there have been a number of local and regional transportation studies that have influenced the existing and future roadway network within the study area. The following discussion provides a brief summary of those key studies. 5-County Regional Transportation Study (KDOT), The 5-County Regional Transportation Study is designed to develop a comprehensive toolbox of transportation strategies to meet the needs within the multi-county region. The strategies fall into three distinct categories: system management, travel demand and increasing capacity. The process will determine which of the strategies should be applied in each of the 14 key corridors within the 5-County region. The 14 corridors include portions of I-35, U.S. 56, and a potential outer loop within the general area of influence of the Southwest Johnson County Area Plan. BNSF Intermodal Facility Environmental Assessment (EA) The schematic plan indicates warehousing uses east of Waverly Road and north of 183rd Street. The concept plan also shows 385 acres of warehousing and distribution centers south of 191st Street and east of Four Corners Road. The amount of additional spin-off development from the intermodal facility will be projected 1-6
17 INTRODUCTION based on the phased development of peer facilities. Access to the facilities appears to be limited to Waverly Road north of 191st Street and 191st Street west of Homestead Lane. Traffic Technical Report for the Gardner Intermodal Facility, 2006 (Appendix to above EA). This report provided useful background material and assumptions that were used to address traffic impacts for the Intermodal facility as envisioned in I-35 Moving Forward Study (KDOT), The study examined options to keep traffic moving safely and reliably today and in the future. The study investigated innovative ways to address I-35 s congestion issues through Johnson and Wyandotte counties. The solutions to these transportation challenges may not be traditional from historical standards. This optimization plan is the culmination of the study and recommends short, medium and long-term improvements for I-35 through 2040 and beyond. The southern limit of the study was approximately Homestead Lane on I-35. I-35 Southwestern Johnson County Interchange Project EA (KDOT), The environmental assessment for the new I-35 interchange at Homestead Lane showed the extension of Homestead Lane from I-35 north to 191st Street with typical cross sections and a two phase construction plan for the section between 191st Street and 199th Street. The EA discussed potential impacts of the interchange including secondary and cumulative impacts. The plans also showed proposed breaks in access control. U.S. 56 Corridor Management Plan (KDOT), This plan includes a concept plan for grade separations at 199th Street and U.S. 56 as well as other improvements along the U.S. 56 corridor. The Plan also includes future traffic forecasts and a table showing future truck volumes including the KCIMF and LPKC facilities. Transportation Master Plan City of Gardner, This document proposes a number of improvements along the western fringe of Gardner within the Southwest Johnson County Plan area, including: A realignment of 191st Street at Gardner Road to provide a greater separation from the existing interchange with I-35 A connection between 199th Street and Waverly Road Road closures for the Logistics Park including portions of 191st Street, 183rd Street, and Four Corners Road Waverly Road widening to 4 lanes Gardner Road widening to 4 lanes 175th Street realigned at U.S. 56 Assumed a new I-35 interchange would be constructed at Waverly Road Gardner Access Management Code, This comprehensive document was adopted while this Southwest Johnson County Area Plan was underway. The code was reviewed and found to be very appropriate not only for the area within the City of Gardner but it would also be a good model for the City of Edgerton and the entire area of southwest Johnson County. Johnson County Comprehensive Arterial Road Network Plan (CARNP),1999. The CARNP was reviewed and found to have several roadway segments impacted by the Intermodal Facility. Some roadway segments were 1-7
18 INTRODUCTION 1-8 eliminated for the construction of the facility, and other roadway network improvements were constructed and recommended. One of the tasks of this Area Plan is to identify modifications to the CARNP based on the recommended roadway network. Additional transportation related studies of some relevance included: Transportation Outlook 2040 (MARC), 2010 Johnson County Gateway: I-435/I-35/K-10 Interchange Study, 2011 Edgerton Quiet Zone Study and Design Gardner Parks and Recreation Park System Master Plan, 2009 Johnson County Trails Plan Linking Conservation Transportation Planning, 2009 Regional Freight Outlook Study, 2009 Fontana Truck Trip Generation Study, 2003 MARC Complete Streets Policy- Approved March 2012 Natural Resources and Utilities A variety of natural resource plans, assessments and inventories were also consulted for relevance to this planning effort, along with information regarding water and waste water facilities. These documents and reports included: Natural Resource Assessment for Johnson County Park and Recreation District (Johnson County), 2012 Hillsdale Lake - Environmental documents by the Corps of Engineers, KDHE or the Hillsdale Water Quality Project Hillsdale Watershed Restoration & Protection Strategy Kansas Department of Health & Environment (KDHE) MARC Bull Creek Watershed Study Natural Resources Inventory (MARC), 2004 Creating Sustainable Places Implementation Guidebook (MARC), 2012 Gardner Water Master Plan, 2009 Gardner Wastewater Master Plan Gardner Design Standards, 2010 Edgerton Wastewater Master Plan, 2012 Gardner Watershed Master Plan, 2012 Johnson County Watershed Study, 2010 Manual of Best Management Practices for Stormwater Quality (MARC), 2008 Gardner Water Supply and Treatment Plant Study, 2008 Implementation Plan Recommendations for land use designation, transportation system improvements and infrastructure requirements are included in the appropriate chapters of this document. This Area Plan will be most effective if each of the sponsors accepts the Plan as a consensus guidance document and incorporates the priorities recommended within their individual community plans and capital improvement programs. It is recommended that the Area Plan sponsors meet quarterly to discuss and coordinate implementation of the recommendations.
19 PART TWO LAND USE: DEMAND AND ABSORPTION 2-1
20 LAND USE: DEMAND AND ABSORPTION The land use planning process for the Southwest Johnson County study area begins with estimating probable demand for new urban land. Two global factors contribute to this estimate: the natural population growth that the area is likely to experience as part of the Kansas City metropolitan area and the additional development generated by a dramatic new influence: the BNSF s Kansas City Intermodal Facility (KCIMF) and its collateral development. Base Population Change: The 21 square mile Southwest Johnson County study area includes three primary development contexts: the cities of Gardner and Edgerton, and low-density rural residential areas beyond the reach of existing urban services. This study area is particularly interesting because it represents the leading edge of western expansion of the Kansas City metropolitan area and each of these contexts has a different personality. Table 2.1 summarizes population growth for Gardner and Edgerton between 1980 and Gardner is a rapidly growing suburban city largely residential in character but with a large industrial base around New Century Airport. In the first decade ( ) of development after the airport opened, the city s population more than doubled from 9,396 to 19,433. Combined with a tripling of a much smaller population base between 1990 and 2000, the city s population has grown more than sixfold during the last twenty years. During that time, the city has expanded in every direction, with residential expansion limited only by the airport and its surrounding business park on the east. During the last thirty years, the city s annual growth rate exceeded 7.2%. Edgerton, on the other hand, has experienced a much slower, more stable rate of growth, more typical of a small city that is beneficially influenced by its position on edge of the metropolitan commuting district. Between 1990 and 2010, Edgerton s population increased from 1,244 to 1,671, with nearly identical annual growth rates for both decades just under 1.5%. This is relatively healthy growth for a town of Edgerton s size, suggesting the influence of the metropolitan area, but dramatically different Table 2.1: Population Change, Gardner and Edgerton Gardner Population 2,392 3,191 9,396 19,433 17,041 Growth by Decade (%) Annual Growth Rate (%) Edgerton Population -- 1,244 1,440 1, Growth by Decade (%) Annual Growth Rate (%) Source: US Bureau of the Census, RDG Planning & Design
21 LAND USE: DEMAND AND ABSORPTION from the rapid suburban growth occurring in Gardner just six miles to the northeast. In rural parts of the study area, development has occurred in subdivisions (such as Peppertree), along section line roads (Four Corners Road between 175th and 183rd Streets; 199th Street between Gardner Road and Waverly Road; 207th Street), and in very low-densities along local roads that connect to the section line grid. Outside the study area, this rural residential pattern becomes more pervasive in Miami County south of Hillsdale Lake. South of I-35, development density is limited by difficult topography and lack of public services. Residents here include a combination of people who are associated with the metro area, but prefer to live on large rural lots, and others attracted by the major recreational amenity of the lake. Despite the large amount of land covered by this very low density residential development, its population will generate a relatively insignificant amount of traffic. Future Base Growth for Gardner and Edgerton Even without the Intermodal Facility and surrounding development, Gardner and Edgerton will continue to grow because of their relationship to the Kansas City metropolitan area. In their natural courses, Gardner would continue to develop at a rapid rate, while Edgerton, smaller and somewhat more distant, would experience a continuation of its steady pattern of moderate growth. Because of its increasing population base, Gardner s annual growth rate will moderate from the 6% to 7% of the last twenty years. However, a slowing of base annual growth to 3% between 2010 and 2020, 2% between 2020 and 2030, and a mature rate of 1.75% between 2030 and the target year of 2040, still generates another doubling of population, to 37,867. Gardner s population dynamics should be more thoroughly evaluated as part of its programmed development of a new comprehensive plan, currently scheduled for completion in Edgerton s base population growth rate is substantially slower than Gardner s. Continuation of the city s Table 2.2: Projected Population Change Based on Metro Growth, Gardner and Edgerton Gardner Population 19,433 26,116 31,836 37,867 18,434 Period Ratio Annual Growth Rate (%) Edgerton Population 1,761 1,937 2,244 2, Period Ratio Annual Growth Rate (%) Source: RDG Planning & Design Growth Rate Estimates 2-3

22 LAND USE: DEMAND AND ABSORPTION 2010 base growth rate of just below 1.5% generates a 2040 population estimate of about 2,600 people substantial, but still far less than the doubling projected for Gardner. Table 2.2 summarizes projected population growth for both cities in the study area by decade to Growth Related to the Intermodal Facility and Collateral Development The second component of population change is related to the extraordinary event of the BNSF intermodal facility and probable new industrial and warehousing/ distribution uses associated with it. Assessing this growth requires: Determining the demand for new warehousing, distribution, and allied uses generated to 2040 by the intermodal facility. Calculating the number of people employed by these new establishments. Estimating the number of new households employed by these facilities who will ultimately live in the study area. New Warehousing/Distribution Demand Warehousing and distribution is the dominant new land use type introduced into the study area by the intermodal facility. While light industrial and office uses will also be associated with the intermodal facility, these uses have already grown around Gardner and are factored into historic growth rates. The Logistics Park Kansas City (LPKC), developed initially by the Allen Group and succeeded by NorthPoint Development, includes about 550 acres on land within the intermodal campus between 191st Street, the BNSF main line, and Waverly Road and directly adjacent on the east side of Waverly Road between U.S. 56 and 191st Street. LPKC is projected to include 7 million square feet of warehouse area. Based on the experience of the highly comparable Elwood, Illinois facility, this level of development is likely to be absorbed within ten years. Land in the study area outside of the LPKC area is being aggressively marketed for warehouse/industrial use, and the transportation and land use plan must accommodate both land and transportation needs through Two estimates of overall demand for warehousing space associated with the intermodal facility include: An initial projection included in the environmental assessment for the intermodal facility for about 12 million square feet. This is likely to include 7 million square feet on-site (within LPKC) and 5 million square feet on surrounding sites. A separate estimate developed by the Allen Group was based on regional demand. The KCIMF will have an ultimate capability of 1.5 million lifts annually (lifts are defined as one movement of a container to or from trucks to trains). The facility will increase net regional capacity by 500,000 lifts. Based on an industry rule-of-thumb that 10,000 lifts produces demand for 1 million square feet of warehousing, this net capacity increase generates an overall demand of 50 million square feet. Assuming that 60% of this market is captured by facilities in the Kansas City region, and 50% of that capture occurs around the KCIMF, the area will experience a long-term market for up to million square feet of warehousing. Therefore, the land use scenarios should consider a range of warehousing demand between 12 to 16 million square feet. 2-4
23 LAND USE: DEMAND AND ABSORPTION Job Creation The second part of the calculation requires an estimate of the number of jobs created by this amount of development. Table 2.3 displays a sample of warehousing facilities by area and claimed number of employees. While the ratio of employees and building area varies, the average job yield appears to be about 1 employee per 2,200 square feet. Many zoning ordinances substantiate this finding by requiring one parking stall per 2,000-2,500 square feet of warehousing and distribution space. Assuming a ratio of 1 full-time equivalent (FTE) job to 2,500 square feet, a market that ranges from 12 million to 16 million square feet of warehouse space will generate up to 4,800 to 6,400 full-time employees. New Households and Estimated Additional Population While the travel demand model that is the basis for the transportation network must account for this employment range, only a portion of these prospective employee households will add to the study area s population. Others may already be located within Gardner and Edgerton, while others will live in surrounding regions. A reasonable assumption is that about one-third of the households finding employment in and around the KCIMF and LPKC will be new to the overall Southwest Johnson County area, including the study area, the rest of Gardner and Edgerton, and the immediate region. Therefore, this extraordinary new development could add between 1,600 and 2,100 new households (and a corresponding demand for new housing units) between 2013 and 2040, in addition to those projected by normal metropolitan area population growth. Table 2.3: Gross Floor Area (GFA) and Claimed Jobs Sample of 14 Warehousing Facilities Facility GFA Claimed Jobs GFA/Job A 466, ,553 B 1,000, ,666 C 150, ,884 D 180, ,500 E 700, ,000 F 500, ,000 G 839, ,797 J 834, ,475 I 524, ,497 J 122, K 10,000,000 4,000 2,500 L 900, ,800 M 2,400, ,000 N 1,000,000 1, Total 19,615,000 8, Based on 2010 population counts, the City of Gardner accounts for 90% of the population of an expanded Southwest Johnson County study area (the 21 square mile area included in the scope of this plan plus the population within the corporate limits of Gardner and Edgerton), Edgerton for 7.7%, and rural residential areas for about 2.3%. If this distribution remains relatively constant, growth attributable specifically to the KCIMF would produce from 1,440 to 1,890 additional households in Gardner, depending on the extent of warehousing and industrial development; 123 to 162 additional households in 2-5
24 LAND USE: DEMAND AND ABSORPTION Edgerton; and 37 to 48 households in rural residential areas. Both Gardner and Edgerton had an average population per household of 2.8 in Assuming this average remains relatively constant between 2013 and 2040, this household range translates to an additional population generated by the KCIMF and associated development of 4,032 to 5,292 in Gardner, 344 to 454 in Edgerton, and 104 to 134 in rural parts of the study area. Combining normal metropolitan population growth with mid-level, intermodal facility-related employment and population indicates a 2040 population of about 42,600 in Gardner and 2,740 in Edgerton. Table 2.4 summarizes these projections. Land Development Needs This section estimates approximate land needs for the development markets discussed above. Land devoted to warehousing and distribution would be almost entirely located within the immediate study area because of the need for relative adjacency to the intermodal facility. The demand for other large land uses, notably residential and commercial uses, would be partially accommodated in the study area, but also located elsewhere in Gardner. Warehousing and Distribution Determining the amount of land needed to accommodate million square feet of warehousing requires defining the typical intensity of development. A standard measure of intensity is floor area ratio (FAR), the ratio of gross floor area to site area. With the very large single-story buildings characteristic of contemporary warehousing, FAR is typically synonymous with building coverage the amount of a site covered by buildings. An examination of warehouse development around four comparable intermodal facilities (Table 2.5) suggests an average FAR of.30. In a development with a FAR of.30, 10,000 square feet of gross floor area requires 30,000 square feet of site area, with the balance used for truck circulation and loading, parking, stormwater management, landscaping, and other open space. This intensity is slightly higher in denser urban contexts and slightly lower in more suburban or rural settings. An average FAR of.30 applied to the projected range of 12 to 16 million square feet of warehouse area estimates a need for between 920 and 1,224 acres of land. (Table 2.6) Table 2.4: Projected Warehouse Development and Household Growth by Area Warehousing GFA (Sq.Ft.) Building Area per FTE (Sq.Ft.) FTE Households Local Retention (Households) KCIMF Related Growth Gardner Edgerton Rural Households Population Households Population Households Population Population Share 90% 7.7% 2.3% 12,000,000 2,500 4,800 1,600 1,440 4, ,000,000 2,500 5,600 1,850 1,665 4, ,000,000 2,500 6,400 2,100 1,890 5,
25 LAND USE: DEMAND AND ABSORPTION Table 2.5: Floor Area Ratios at Comparable Facilities Facility Site Area (Sq.Ft.) Building Area (Sq.Ft.) FAR Elwood, IL (BNSF) 21,725,265 6,423, Denver, CO (BNSF) 2,533, , Alliance, TX (BNSF) 3,550, , Dallas, TX (KCS) 3,627,284 1,353, Composite 31,436,243 9,677, Table 2.6: Warehouse Land Area, per Buildout Level Warehousing GFA FAR Required Land Area (acres) 12,000, ,000, ,071 16,000, ,224 Residential Rural or estate residential. This very low density residential development on large lots is usually outside the service area of urban infrastructure and frequently uses self-contained wastewater systems, typically septic tanks. Density of these areas rarely exceeds two acres per unit. Urban single-family residential. This category includes much of post-1970 residential construction in both Gardner and Edgerton, and typically includes singlefamily detached homes on medium-sized lots. These houses are almost always served by sanitary sewers and municipal water. Typical average density is in the range of 2.5 to 3.0 units per acre. Medium-density residential. This category includes a variety of housing types such as single-family attached houses on small lots, attached houses, duplexes, villas, and small townhome projects. Mobile home parks also display residential density consistent with this category. Average density for these development forms in suburban settings is in the range of six units per acre. High-density or multi-family residential. This includes buildings with over four units per structure, apartment groups, and other similar settings. In suburban locations like the study area, developments typically have fairly abundant parking and green space, with average density in the range of about 12 units per acre. Residential land needs are typically calculated as a function of density: the total projected demand for housing divided by an average density or number of housing units per acre. For land use planning purposes in this plan, residential uses fall within four simplified categories: Gardner s current housing mix is about 65% urban singlefamily, 20% medium-density, 9% mobile homes, and 6% high-density. Edgerton, with a housing supply more small town than suburb, displays a mix of about 90% single-family, 7% medium-density, and 3% mobile homes without significant apartment development. However, housing preferences are changing, even in previously singlefamily environments, partially by choice and partially by necessity with tighter financing after the 2008 mortgage crisis. This plan anticipates an overall average density of 3.75 units/acre, reflecting a future distribution of 65% singlefamily (including a small amount of rural residential de- 2-7
 2013-2040 Base Population Population per Projected Area Change, 2010- Unit Needs Density (du/acre) Household Needs")
 560 Total Required Residential Land Area 2,405 velopment), 20% medium-density, and 15% high-density development.")
26 LAND USE: DEMAND AND ABSORPTION Table 2.7: Required Residential Land Area for Study Area (including Gardner and Edgerton) Base Population Population per Projected Area Change, Unit Needs Density (du/acre) Household Needs (acres) 2040 Gardner Growth 18, , ,756 Edgerton Growth Total Base Residential Land Need 1,845 Growth from KCIMF, Assuming 16,000,000 Sq.Ft. of Development (2,100 Households/3.75 du per acre) 560 Total Required Residential Land Area 2,405 velopment), 20% medium-density, and 15% high-density development. At this density, about 2,400 acres will be needed to house the future population of Gardner, Edgerton, and the intervening study area. (Table 2.7) Commercial Additional population will generate a demand for new commercial development, some of which is likely to be accommodated within the immediate study area. For general land use planning purposes, new commercial demand is estimated as a function of population. Typically, communities range between one and two acres of commercial land for each 100 people. The low end of the scale includes places that export a significant amount of their retail spending to surrounding cities, such as principally residential suburbs near very large retail centers; or cities dominated by a dense retail core. The high end of the scale includes regional trade centers and/or cities with very large clusters of space intensive development, like large format stores with high parking counts. Edgerton, with its small town center and limited retailing along U.S. 56, now trends toward the lower range, while Gardner falls in the middle. Projecting future commercial needs in the study area (including Gardner and Edgerton) assumes that 1) current retailing is serving the existing population and 2) new commercial needs are estimated at 1.5 acres for each 100 added residents between 2013 and In addition, the intermodal facility, surrounding industrial development, and the new Homestead Lane interchange on I-35 will also generate some demand for commercial support facilities, such as truck stops and travel-related services. These assumptions suggest an overall regional need for about 480 acres of additional commercial land during the planning period. (Table 2.8) Table 2.8: Required Commercial Land Area, Base Population Change Commercial acres/100 people Required Land Area (acres) Gardner Growth 18, Edgerton Growth KCIMF Growth 5, Total 25, Associated demand from traffic/kcimf 100 Total
 will require: Between about 900 and 1,200 acres of land (including the Logistics Park Kansas City property but not the actual site of the intermodal facility) to accommodate between 12 and")

27 LAND USE: DEMAND AND ABSORPTION Summary of Land Development Needs Based on the assumptions and discussion presented above, the Southwest Johnson County plan area (including the cities of Gardner and Edgerton) will require: Between about 900 and 1,200 acres of land (including the Logistics Park Kansas City property but not the actual site of the intermodal facility) to accommodate between 12 and 16 million square feet of warehousing and distribution and related industrial space. About 2,400 acres, or four square miles, of new residental area to accommodate a projected regional population of about 45,000 people by About 480 acres of new commercial land to serve both a growing population and specific demands related to the intermodal facility and related development. These requirements provide the basic ingredients for the land use plan, and can also help to inform updates of the individual comprehensive plans for Gardner and Edgerton and Johnson County. 2-9
28 2-10 THIS PAGE INTENTIONALLY LEFT BLANK


29 DEVELOPMENT INFLUENCES PART THREE DEVELOPMENT INFLUENCES: NATURAL RESOURCES AND UTILITIES 3-1
30 DEVELOPMENT INFLUENCES Markets and development estimates for the next quarter century are critical determinants of the directions and policies of this plan, with its focus on probable growth, land use, and the transportation system and other services required to accommodate the changes that the area is likely to experience during the next 25 to 30 years. But natural features and resources also present important constraints and opportunities for the future of this dynamic area. This plan builds on a foundation based on understanding the importance of water quality, stormwater and flood management, habitat protection, and trails and recreation within a context of major development, mineral rights, and high quality environmental and recreation attributes. The highly-valued Hillsdale Lake is just south, and downstream, of the study area. The 2012 Hillsdale Big Bull Creek Watershed Protection and Restoration Strategy considers Big Bull Creek as the highest priority of the three watersheds feeding the lake. The Johnson County Park and Recreation District has acquired significant portions of this watershed for a future park. These acquisitions will help protect water quality, but changing land uses catalyzed by the KCIMF in the rest of the watershed, many of which typically produce high impervious coverage, will require thoughtful approaches. As development occurs, rooftops and hard surfaces shed water quickly, rather than soaking it up ( infiltration ), thus producing in-wash into water ways. These hard surfaces also often displace important soil-holding grasses and habitat for wildlife (and outdoor spaces for people). By heeding these impacts and planning accordingly, we can enjoy the jobs and vibrancy of high quality economic development and capture a vast array of natural resources benefits at the same time. This plan intends to support both of those outcomes. A Watershed Approach Sound development in the Southwest Johnson County study area will require natural resource management. The health of water resources and surrounding area is especially important. Consequently, this plan employs a comprehensive watershed approach. This method: Defines and maps key environmental resources affecting the study area and the surrounding region. These resources include: Water and drainage-related resources, including wetlands, floodplains, streams and other watercourses, lakes, and permanent small water bodies Parks and trails Steep slopes that can limit development or cause significant erosion and water quality impairment. This is a particularly significant issue with the very large footprint buildings. Water table depth Hydrologic Soils Hydric Soils Vegetation Areas of resource extraction activity 3-2

 of rainwater.")
31 DEVELOPMENT INFLUENCES Relates these environmental characteristics to one another to assess: Development suitability, identifying areas where development is least likely to affect vital environmental systems. Areas that should be permanently preserved as open spaces. Areas may be preserved by development permitting and site specific approvals on private property; easements; or public acquisition. Green infrastructure suitability, identifying opportunities where infiltration based best practices can balance the demands of maximizing development yield and protecting critical resources. This analysis has identified areas that are especially appropriate for techniques that promote infiltration (i.e. soaking up ) of rainwater. But it is important to note that a suite of natural stormwater management practices (e.g. stream buffers, wetland restoration, grassed waterways) are appropriate and should be employed across most of the Southwest Johnson County study area. Provides direction to build cohesive natural systems and support vibrant development. This plan identifies methods to maintain and restore habitat continuity, links communities and features through trail and pathway corridors, and strives to manage stormwater where it lands to the greatest degree possible. The resulting benefits include supported development sites, enhanced recreation, flood/stormwater improvements and increased water quality. Provides examples for successful development of individual sites. To illustrate system benefits, this plan provides examples for successful development of individual sites. These site design concepts use onsite techniques to reduce impact on the external environment and provide more successful projects for workers and residents. They are presented throughout this document as simple examples of methods available to developers, private landowners, public agencies and others to take full advantage of the approaches outlined here. Additional ideas and information are available in the Appendix. Conventional Streambank Development Conservation Streambank Development 3-3
 Suitability, and Preservation Areas.")
32 DEVELOPMENT INFLUENCES How the Watershed Approach Works The watershed approach looks at a series of natural resource factors - highlighted in upcoming pages - and then weights these factors in a series of composite maps to identify three primary results: Development Suitability, Green Infrastructure (i.e. infiltration) Suitability, and Preservation Areas. Because this plan intends to enhance water quality, increase habitat/recreation, and address potential flooding/stormwater management issues, it maps a series of factors at a watershed scale and then at a study-site level so that watershed-based inputs to the study site are well understood. The Process Example: Development Suitability featured on these pages summarizes in graphic form how we initially examine these various natural resource features at the watershed level before focusing on the study site. The weighting process itself is best illustrated in the Composite Mapping section of this chapter. A Process Example: Developmental Suitability We review these layers of data in combination. These factors are then weighted, based on their importance to the scenario being considered... What land should be preserved and managed as wildlife habitat and recreational open space? = Where can green space help manage storm water? Are we looking at best fits for development? 3-4


33 DEVELOPMENT INFLUENCES What is a watershed? A watershed is an area of land that drains to a common body of water, such as a creek, stream, river or lake. Think drainage area. lf your bathroom drain is the lake or stream, the bathtub is the watershed. The water can flow by many means including over land, through drain tile, or via underground waterways. Flood Plains Slopes + + Landcover 3-5

34 DEVELOPMENT INFLUENCES Wetlands and Streams l Floodplains 3-6 Wetlands and Streams Hillsdale Lake dominates the drainage system and is fed by three watersheds: Rock Creek to the northwest, Bull Creek to the north, and Little Bull Creek to the northeast. The 2O12 watershed protection strategy for the lake cites Big Bull Creek as the lake s top priority, stating that Water quality monitoring in the streams feeding Hillsdale Lake confirms that Big Bull Creek contributes % of the nonpoint source pollutants. Three tributary streams flowing into Bull Creek from the northeast present major greenway opportunities through the developable part of the study area. The northernmost of these runs through the center of the intermodal facility and has been reconstructed north of the facility s main yard lead track. The central tributary runs between the railroad and I-35 and roughly parallels both, and is most affected by potential industrial development. The third parallels I-35 on its south side. Most of the area north of 175th Street, the northern boundary of the study area, drains to the Kill Creek watershed to the north. Gardner Lake, on the northwestern side of the city, is the principal water feature within the immediate region. The study area also includes a series of smaller branches and sub-tributaries, as well as ponds and drainage basins. Wetland mapping is an important strategy to look at connecting the hydric soils and sensitive areas. Most of the wetlands are a riparian wetland adjacent to streams or within the floodplain. Wetlands are essential to the hydrologic ecosystem because of their water cleansing properties. The number of wetlands surfacing throughout the Southwest Johnson County study area indicates value in exploring the potential of a wetland mitigation bank to serve this region. The location and management of a mitigation bank is especially valuable if it contributes directly to water quality improvements at Hillsdale Lake and/or expands the recreation options and environmental conservation of the Johnson County Parks and Recreation District property. Floodplains While floodplains are obviously related to streams, only the larger watercourses have associated regulated floodplains that increase flood risk. The largest of these floodplains surrounds Big Bull Creek itself, and is largely located within the publicly-owned Mildale Farm and future Big Bull Creek Park sites. Significant floodplain areas also follow the creek s west branch, roughly paralleling U.S. 56 north of Edgerton and its north branch between Four Corners Road and Dillie Road north of the highway. Narrower floodplains also follow each of the three principal northeast tributaries. Floodplains are an important natural resource component that provides significant ecological benefits. These areas are commonly flooded and are often home to riparian wetlands, wildlife and habitat. Due to their environmental significance and regulation, significant development in these areas should be strictly avoided.


35 DEVELOPMENT INFLUENCES Slopes l Groundwater Slopes Even modest slopes in excess of 6% can have a significant impact on development, particularly in areas where the unit of development building footprint or need for flat sites is very large. A significant percentage of the area south of the intermodal facility (the triangle bounded by Four Corners Road, 191st Street, and I-35) is affected by these moderate slope conditions. Generally, the steeper slopes follow stream banks, but broaden substantially. Land north of 191st Street to U.S. 56 is relatively flatter. The study area s steepest topography occurs along the west branch of Big Bull Creek within the boundaries of the county s future park land, along I-35, and south of 207th Street. Avoiding development in areas with steep slopes (greater than 8%) will help prevent excessive erosion ultimately helping to stabilize stream corridors. When land cover is changed, unprotected or disturbed slopes are one of the primary contributors to suspended solid loading, leading to soil erosion and muddy waters. Groundwater Much of the study area displays a relatively high water table, which can affect the suitability of certain types of development. As expected, this is most evident along streams but spreads out fairly broadly south of I-35 and along the middle of Big Bull Creek s three northeast tributaries. Depth to groundwater is an important characteristic that identifies where the subsurface soil structure is continuously anaerobic or saturated. These areas are typically associated with hydric soils (wetland derived soils) or wetlands and limit the applicability of infiltration-based best management practices. In addition, a high water table often adds to development cost because of the need to limit the shrink / swell factor. 3-7


36 DEVELOPMENT INFLUENCES Hydrologic Soils l Hydric Soils Hydrologic Soils Hydrologic soil categories measure the capability of soils to absorb stormwater and detain runoff. Group A soils have high infiltration rates and low runoff, indicating their ability to absorb stormwater successfully. Group D soils, on the other hand, do not absorb water well and generate high rates of runoff. Group A soils have low runoff potential and high infiltration rates even when thoroughly wetted. They consist chiefly of deep, well-to-excessively drained sand or gravel and have a high rate of water transmission. Group B soils have moderate infiltration rates when thoroughly wetted and consist chiefly of moderately deep to deep, moderately-well to well-drained soils with moderately fine to moderately coarse textures. Group C soils have low infiltration rates when thoroughly wetted and consist chiefly of soils with a layer that impedes downward movement of water and soils with moderately-fine to fine texture. Group D soils have high runoff potential. They have very low infiltration rates when thoroughly wetted and consist chiefly of clay. Hydric Soils The United States Department of Agriculture defines hydric soils as those soils that are sufficiently wet in the upper part to develop anaerobic conditions (saturation) during the growing season. Within the study area, these soils with a high potential for saturation follow drainage ways very closely and have relatively limited impact on potential development. 3-8

37 DEVELOPMENT INFLUENCES Vegetation l Resource Extraction Vegetation Resource Extraction Vegetation and land cover are major resources that can help manage stormwater, prevent erosion, moderate microclimates, and provide more appealing physical environments. In the study area, woodlands or significant stands of trees generally follow drainage ways and extend along tributary corridors. Preserving and enhancing native vegetation helps protect habitat and provide opportunities for migratory birds and wildlife. Oil drilling has become significant and is a growing industry within the Southwest Johnson County study area. Buildings are sometimes placed over exhausted wells in dense urban areas such as Los Angeles, and occasional mishaps and property damage occur. Experience indicates certain types of development are inadvisable unless absolutely necessary. Active drilling also precludes substantial urban development. In the long term, reuse of exhausted sites should be limited to low-density development where buildings can fit between the grid of wells. Thus, low-density limited industry with small buildings and large storage areas, very low-density residential, open space, and agricultural uses may occur in these areas. Urban residential development, major commercial, and high coverage industrial uses are inadvisable. Within the study area, the most intensive oil drilling occurs north of 183rd Street and west of Four Corners Road, although significant activity has also occurred east of Four Corners Road between 175th and 183rd Streets. 3-9
38 DEVELOPMENT INFLUENCES Composite Mapping The environmental factors described above consider individual resources, opportunities, and constraints that affect the location and design of development in the study area. The following maps combine these into three guiding suitability maps: Development suitability, considering the ability of land to support development while minimizing impact on other parts of the natural or human environment. Open space preservation, areas that are ecologically sensitive and should be preserved as part of site design on private property or as part of public or nonprofit ownerships as parks, recreation areas, greenways, or civic facilities. Green infrastructure, or areas that are suitable for infiltration based best management practices are depicted in green. Areas that are not identified should embrace surface based water quality improvement practices (filter strips, buffers, etc) to remove suspended solids and harmful pollutants. Weighting Process Environmental resources and constraints are weighted on the basis of their relative importance, producing an overall score for individual policy maps. These composites then help to guide land use policy and location. 3-10

 and at the scale of")

39 DEVELOPMENT INFLUENCES Using composite maps. Composite maps and their rankings of development suitability can guide overall land use planning at an area-wide scale (left) and at the scale of individual sites (above and right). Redder shades indicate parts of sites that are less suitable to development. 3-11
 overlays and weights the environmental factors considered above to group land within the study area into four gradations of suitability.")

40 DEVELOPMENT INFLUENCES Development Suitability The Development Suitability Map (Figure 3.1) overlays and weights the environmental factors considered above to group land within the study area into four gradations of suitability. The most significant factors streams, flood-prone areas, hydric soils, wetlands, and tree cover receive a higher weighting in this composite map, while constraints such as moderate slopes that can be modified without significant ecological loss are of less concern. Most of the potential development area is relatively unconstrained. Less suitable areas are associated with Big Bull Creek and its major tributaries. Other less suitable areas are scattered throughout the area as ponds or small wetlands. Figure 3.1: Development Suitability Map 3-12

41 DEVELOPMENT INFLUENCES Open Space Preservation Figure 3.2: Preservation Areas Map Features such as streams, floodplains, and wetlands have the highest value as open space preserves. This analysis does not address land use policy issues, such as buffering between potentially conflicting or incompatible land uses. Much of the preservation area is incorporated in county parks properties (Mildale Farm and the future Big Bull Creek Park) or within the KCIMF/LPKC property. As noted earlier, the principal drainage way within the intermodal campus has been relocated and reconstructed. These results imply value in a multi-pronged greenway/greenbelt network concept that includes portions of Martin Creek and Bull Creek and its tributaries. Such an approach to preservation and protection could minimize inappropriate flood plain development, aid in managing storm water, enhance habitat and provide some level of water-cleansing (by way of buffers or other management practices). This greenbelt could provide a substantial quality-of-life boon and become a regional attraction that adds to its viability and importance. Potential future trails are shown on this map to illustrate how these greenbelts could be interconnected on a regional level. 3-13

42 DEVELOPMENT INFLUENCES Green infrastructure ( infiltration as defined here) opportunities indicate areas with soils conditions, such as Type A or B hydrologic soils, or other features that lend themselves well to infiltration practices. Within the Southwest Johnson County study area, these conditions mostly are present in the rural or low-density areas south of Interstate 35; however, the entirety of the study site remains appropriate for water cleansing and slowing practices that do not rely on infiltration to work. Green Infrastructure Potential Figure 3.3: Green Infrastructure Suitability Map About Green Infrastructure Green infrastructure speaks to the use of a series of natural systems to replace or supplement pipe and concrete infrastructure that has traditionally been used to manage stormwater in modern times. Buffers, rain gardens, and other vegetationbased systems to promote slowing and soaking up water make up green infrastructure. Please refer to the Appendix for additional information. 3-14


43 DEVELOPMENT INFLUENCES Utilities and Urban Infrastructure The major development investments resulting from the intermodal facility and natural growth will require urban infrastructure, including gas, electricity, municipal water, and sewer service. Therefore, the presence or feasible extension of urban services has a major influence on land use. Natural features such as rivers, lakes and topography can present barriers to extending infrastructure by adding costs that make construction unfeasible. Freeways, highways, large industrial developments, and mining operations also may add costs or technical difficulties that prevent infrastructure extensions to undeveloped areas. Consideration should also be given to the capacity of the existing infrastructure and the size of the existing service lines to meet increased demand. Natural Gas The existing gas service area currently extends south to 191st Street and includes existing urban development in and around Gardner and Edgerton. Gas line extensions generally follow development demand, and continuation of service areas to Interstate 35 will occur as demand emerges. Gas utilities have crossed the Interstate 35 barrier by extending south of Gardner to serve Nike Elementary School and other development. Kansas Gas Service serves the majority of the study area including the intermodal facility and the neighboring logistics park. Barriers to the extension of gas service appear to be minimal with extensions planned as the area develops. 3-15

44 DEVELOPMENT INFLUENCES Utilities and Urban Infrastructure 3-16 Sanitary Sewer Sanitary sewer service and the economic feasibility of providing that service is often the primary constraint to development. The City of Edgerton with participation by the City of Gardner has built a new wastewater treatment plant southwest of the new Homestead Lane interchange at I-35. This facility is scheduled to be placed into operation when the intermodal facility opens. With completion of this facility and planned sewer main extensions, most of the area between U.S.-56 and I-35 will have relatively easy access to sanitary sewer service. Based on its location, the wastewater treatment plant could serve most of the upper Big Bull watershed to the north. Areas not currently served but with feasible access to an urban wastewater service include sites between U.S. 56 and 183rd Street. These areas are within a future service area proposed by Edgerton s Wastewater Master Plan. The City of Gardner s Wastewater Master Plan places potential development areas between 199th Street and I-35 east toward Moonlight Road within its future urban service area, capable of being served by the City of Gardner s wastewater treatment plant. On the other hand, much of the study area south of Interstate 35, draining into the Big Bull Creek watershed and ultimately Hillsdale Lake south of the wastewater plant, are much more difficult to serve with sanitary sewers. Existing residential development here is typically sized at 5 to 10 acre lots with little incentive for extension and a higher unit cost for service. Additionally, this area is at or near the topographic limit for gravity service to the new Homestead Lane wastewater treatment plant. A small portion of Kill Creek watershed, mostly between 175th Street and U.S. 56 and including the Gardner Municipal Airport, is included in the study area. This watershed naturally drains to the north and is planned to be served by Gardner s Kill Creek Wastewater Treatment Plant. The study area also borders the edge of Little Bull Creek watershed south of 199th Street and east of Gardner Road. The Little Bull Creek watershed is currently rural here. The Johnson County Wastewater Bull Creek Watershed Study includes preliminary planning for facilities to service this area. The County, however, will continue to review ongoing conditions within this area and will update its planning prior to any commitment to provide wastewater service.
. In 2012, the RWD-7, along with Gardner and Edgerton, executed a cooperative agreement on the use of Hillsdale Lake as a regional water source.")

45 DEVELOPMENT INFLUENCES Utilities and Urban Infrastructure Water Service Map Legend Electrical Service Map Legend Water Water service is currently provided by municipal water systems and Rural Water District Number 7 (RWD-7). In 2012, the RWD-7, along with Gardner and Edgerton, executed a cooperative agreement on the use of Hillsdale Lake as a regional water source. Currently, distribution lines run along the grid of county roads, with branched systems into residential subdivisions. Water services have been upgraded into the intermodal facility and adjacent logistics park. Industrial demands will require further expansion of the distribution system s capacity. Electrical Distribution Electrical service is currently provided primarily by overhead lines following section line roads. Service capacity has been upgraded to the intermodal facility and logistics park campus, and electric supply is adequate to serve probable growth north of Interstate
46 DEVELOPMENT INFLUENCES THIS PAGE INTENTIONALLY LEFT BLANK 3-18

47 LAND USE SCENARIOS PART FOUR LAND USE SCENARIOS 4-1
48 LAND USE SCENARIOS Part Two of this document presented the ingredients of the land use plan the amount of warehouse/industrial, commercial, and residential land needed to accommodate probable market demand to Part Three considered the environmental and public service issues that influence development patterns. This chapter combines these land use determinants and uses different variables to prepare four alternative land use and development scenarios. The purpose of these scenarios is to test different assumptions and to illustrate their implications and potential costs and benefits on the ground. These scenarios were presented to the project s Core Team and Advisory Committee, area public officials, and the general public for review and comment as part of an evaluation process that leads to a Preferred Alternative a concept that reflects the best features of the options and becomes the basis for future areawide policies, including transportation planning. Scenario Variables Scenarios are generated by specific variables that are adjusted and produce different results that can be evaluated against each other. In the study area, the variables with the greatest potential impact on potential land use policy are: Industrial Build-Out, the amount of warehousing and associated industrial development. Residential density, the housing mix and average density for study area development, including policy implications. Geographic distribution, the location of various land uses relative to land, transportation facilities, and existing uses. Environmental preservation, the degree to which natural resources are preserved in open use or modified and developed into other uses. Development cost, the degree to which options require construction or extension of public services and transportation infrastructure. The following discussion defines the assumptions and principles for each of these variables used to develop the scenarios. Industrial Build-Out. The amount of projected warehousing and industrial development is the key land use variable in the study area. The Logistics Park Kansas City (LPKC) project, including most of the land next to the KCIMF between 191st Street, the BNSF mainline, Waverly Road and adjacent property on the east side of Waverly, markets a capacity of about 7 million square feet of building area. This is highly consistent with the 0.30 target floor area ratio (FAR) discussed in Part Two. The logistics park adjacent to the Elwood, Illinois BNSF intermodal facility, very comparable in size and location to the KCIMF, built about 6.4 million square feet during its approximately ten-year history. Projections for long-term development around the intermodal facility range from 12 to 16 million square feet (5 to 9 million square feet outside the Logistics Park campus ) and these boundaries define the probable build-out range used for the scenarios. 4-2
49 LAND USE SCENARIOS Residential Density. Residential density affects the amount of land needed for growth or the amount of population that can be accommodated within a given area. Generally, higher residential density scenarios are associated with more compact urban form, and devote a higher percentage of growth to medium- and highdensity development options. A large percentage of the potential residential growth discussed in Part Two will occur within the city limits of Gardner and Edgerton outside of the limits of this plan and subject to the comprehensive plans and policies of the individual communities. As such, the scenarios assume that residential development in urban service areas will be similar to the mix found in Gardner and Edgerton. The alternatives project medium- and high-density housing in appropriate areas, but emphasize single-family housing at various densities. Geography. In the Southwest Johnson County area, the geographic distribution variable concentrates on warehousing and other non-residential uses (commercial, business parks, and limited industrial) on the land. Geographic principles common to all scenarios include: A primary concentration of warehousing/higher impact uses in various quantities around the KCIMF between U.S. 56 and I-35. As an alternative, some warehousing is assigned to the north side of U.S. 56. Commercial and some use mixing at interchanges. Consistent with Gardner s current comprehensive plan, all scenarios propose substantial mixed use development around the Gardner Road interchange with I-35. The current interchange, a rural diamond, is not designed to accommodate major development. However, locational advantages, the city s land use plan, existing zoning, and the expectations of property owners and developers indicate that relatively intensive development will occur there. Urban development is also likely to occur along the Gardner Road corridor south of I-35, within Gardner s urban services area. The other two study area interchanges, Homestead Lane and Sunflower Road, will also include a combination of industrial and commercial use. Very low density development south of I-35. In all scenarios, the area south of I-35 and 199th Street between Waverly Road and the future Big Bull Creek Park is designated for very low-density conservation development, encouraging lot clustering to preserve environmental features and take advantage of soil characteristics conducive to green infrastructure. Very low intensity use is the desirable future for this part of the study area because of topography, existing residential use patterns, high cost of providing urban infrastructure to this area, and the availability of other land to meet projected urban development demands. In addition, it is particularly important to minimize land disturbing activity in this area to minimize downstream effects, including negative impact on Hillsdale Lake. Environmental Preservation. All scenarios are based on the watershed approach discussed in Part Three, maintaining drainage courses with surrounding buffers, floodplains, avoiding slopes in excess of 8%, and preserving wetlands as open space with minimum disturbance. Johnson County s ownership of Mildale Farm and the future Big Bull Creek Park already ensures preservation of a large percentage of these environmentally sensitive 4-3
50 LAND USE SCENARIOS 4-4 areas. Drainage integrity in this planning area is a particularly important issue. The intermodal facility and the nature of its surrounding uses will dramatically increase impervious coverage over the progression of residential uses that would normally occur. Compounding this problem is the sensitivity of Hillsdale Lake to the potential impact of uncontrolled stormwater discharges into Big Bull Creek and the Hillsdale Lake watershed. Feasibility and Relative Cost. Cost of development, including extension of utilities or new transportation facilities, represents a significant variable for development options. Additional costs or public infrastructure may be required to open more land for development, depending on projected demand. All scenarios place most development in either the existing urban service areas of Gardner and Edgerton or in areas where extensions are relatively easy to accomplish. Alternative approaches would be necessary only if existing served areas were insufficient to meet probable market demands. However, some scenarios require additional transportation improvements. Land Use Scenarios The four land use scenarios evaluated as part of this plan include: Scenario One: Low Industrial Buildout. This concept projects warehouse and industrial development at the lowend of the 25-year year range, anticipating completion of the on-site LPKC and an additional 5 million square feet of off-site space, for a total of about 12 million square feet. Major industrial development is all located south of the BNSF/U.S. 56 corridor. Scenario Two: High Industrial Buildout. This concept maximizes warehouse and industrial development south of the BNSF/U.S. 56 corridor, anticipating completion of the LPKC and an additional 9 million square feet, for a total of about 16 million square feet. Scenario Three: Mid-Range Industrial Buildout with Major Gardner Road Interchange Focus. This concept produces a mid-range industrial buildout, anticipating completion of the LPKC and an additional 7 million square feet of offsite space, for a total of about 14 million square feet. It also maximizes development around the Gardner Road/I-35 interchange with planned business park uses. Scenario Four: High Industrial Buildout with Northside Development. This concept produces buildout at the maximum range of 16 million square feet (Logistics Park completion and 9 million off-site square feet) but includes substantial warehousing on the north side of the U.S. 56/ BNSF corridor. Each scenario description includes: A simplified diagram that illustrates the basic relationship of land uses and the supporting transportation framework. A more detailed land use plan illustrating development parcels, open spaces, transportation linkages, and other elements. A description of the features and basic infrastructure requirements for each scenario. A summary of the development yield for each scenario.

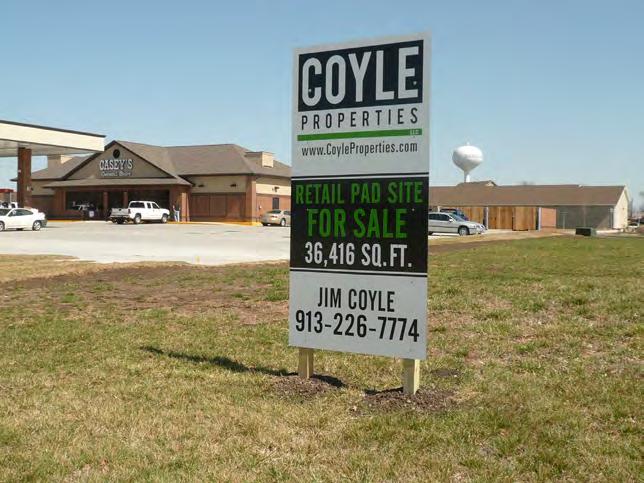
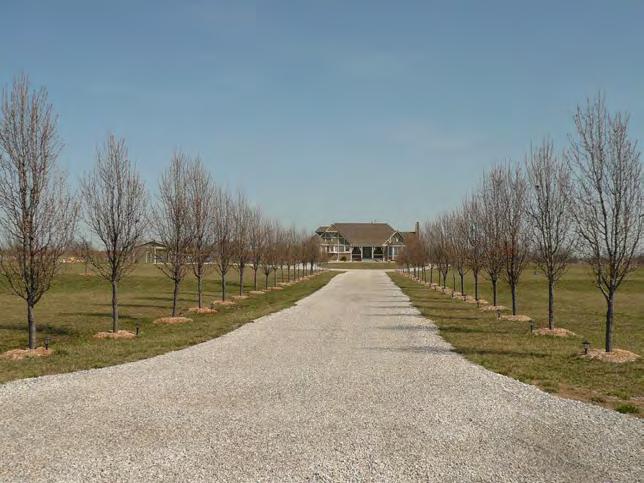
51 LAND USE SCENARIOS 4-5

52 LAND USE SCENARIOS SCENARIO ONE LOW INDUSTRIAL BUILD-OUT Major Land Use Features: Low range of warehousing build-out with 12 million square feet. Figure 4.1: Scenario One Development Diagram Warehouse uses concentrated on Logistics Park site, between 191st Street and the middle northeast tributary of Big Bull Creek, and along the Homestead Lane corridor to I-35. Potential for traveler/truck related commercial development along Homestead Lane between interchange and 199th Street. Urban residential development (single-family and medium density) east of Homestead Lane and north of 199th Street. Medium density along Four Corners Road north of 199th Street fronting on future county park, with a greenway link and buffer between development area and industrial uses to the north. Residential Commercial/Mixed Use Business Park/ Light Industry Warehousing Road Framework Pathway Framework Commercial, mixed use, and business park development clustered at north quadrants of Gardner Road interchange. New urban residential development on west side of Gardner with greenway buffer between residential and industrial uses. Urban residential use within a mile corridor bisected by Gardner Road to 199th Street. Light industrial development along north side of U.S. 56 corridor. Continuation of large lot residential pattern adjacent to Four Corners Road north of U.S. 56. Commercial node at Sunflower Road and realigned U.S
53 LAND USE SCENARIOS Commercial and light industrial use around Sunflower Road/I-35 interchange. Major Road Transportation/Infrastructure Features Improvements at the 199th Street/Sunflower Road/U.S. 56 intersection. 199th Street upgrade to a four-lane section between redesigned U.S. 56 access and Homestead Lane. When development thresholds are reached, upgrade Waverly Road with an overpass over the KCIMF switching tracks, consistent with current agreements. Local access service roads approximately ¼ mile from and parallel to Homestead Lane between 191st and 199th Streets. New half-section line circulation road (a new 195th Street), extending from Four Corners Road to Center Street at the current 187th Street intersection. The new road is designed to serve development and remove traffic conflicts that reduce capacity of the existing interchange. Improved local circulation south of I-35 and east of Gardner Road, including a new circulator street on the half-section line between Gardner Road and Moonlight Road, and a new 195th Street connection replacing the existing 191st Street and Gardner Road intersection. This concept improves access to residential development sites and removes the 191st Street east access that conflicts with interchange ramps. Street improvements through the center of Edgerton, linking U.S. 56 and the north and south legs of Sunflower Road together. Improved intersection at 207th Street and Sunflower Road. Roadscape and intersection improvements along existing U.S. 56. Redesign of roadway as a multi-modal urban corridor connecting I-35, Downtown Gardner, and Downtown Edgerton. Intersection improvements provide 90 degree T intersections with intersecting roads. Active Transportation (Pedestrian and Bicycle) Features Primary trail and greenway spine along middle tributary branch between Center Street and 199th Street/Four Corners Road. Connection to existing Center Street Trail in Gardner, providing direct connection between Gardner and Edgerton. Trail continuation to Hillsdale Lake area using abandoned BNSF right-of-way through Big Bull Creek Park and existing undercrossing along Big Bull Creek at I-35. Trail continuation to Edgerton along 199th Street and on county park property around quarry. North greenway/buffer connection between Waverly Road and Center Street, connecting new and existing Gardner residential areas south of the BNSF to regional system. Improved path connection to Nike Elementary with upgraded Center Street crossing and eastside path along Gardner Road to school. Continuation of trail south along Gardner Road and drainage corridor to 199th Street with 199th Street link to the regional spine. Multi-modal improvement of existing U.S. 56 between Edgerton town center and Gardner Junction Park, with north-south link to 175th Street and 175th Street path to Gardner. South trail loop connecting mixed use interchange cluster, I-35, and 199th Street path to regional spine. 4-7

54 LAND USE SCENARIOS Notes on Yield Tables These notes apply to Tables 4.1 though 4.4, displaying the amount of development produced by each of the scenarios presented by this section. 1. LPKC column shows land area in acres within the Logistics Park Kansas City itself, most of which is north of 191st Street and west of Waverly Road. 2. Planning Area column shows land area in acres in the study area outside the LPKC property. 3. Density calculations include Floor Area Ratio (FAR) for industrial and commercial uses and dwelling units per acre du/a for residential development. FAR is the projected ratio of building area to land area on a site. du/a indicates average gross density, including intervening local streets and open spaces. 4. GFA is gross building area, the amount of space enclosed by the building envelope. 5. Total column shows total gross building area for non-residential development and number of units for residential. 6. Study scenarios include some areas adjacent to but outside of the limits of this study area. Table 4.1: Scenario One Yield Use LPKC Planning Area Density (FAR or du/a) GFA (in LPKC) GFA (Planning Area) Industrial/W&D ,108,992 4,151,442 11,260,434 Light Industrial ,554 1,894,860 2,097,414 Visitor Service , ,050 Business Park ,404,810 1,404,810 Commercial/MU ,385,208 1,385,208 Rural Residential du/a 301 LDR 56 South du/a 1,830 LDR 56 North du/a 1,693 MDR du/a 2,394 HDR du/a 636 Total Residential 2,463 6,854 Total 4-8
55 LAND USE SCENARIOS Figure 4.2: Scenario One Land Use Concept SCENARIO ONE Land Use Concept 4-9
56 LAND USE SCENARIOS SCENARIO TWO HIGH INDUSTRIAL BUILDOUT Major Land Use Features: High range of warehousing build-out with 16 million square feet. Figure 4.3: Scenario Two Development Diagram Warehouse uses concentrated on LPKC site, between 191st Street and the middle northeast tributary of Big Bull Creek, and along the Homestead Lane corridor to I-35. Potential for traveler/truck related commercial development along Homestead Lane between interchange and 199th Street. Business park and limited industrial development east of Waverly Road buffering warehouse concentration and interchange-related mixed use and neighboring residential development. Residential Commercial/Mixed Use Business Park/ Light Industry Warehousing Road Framework Pathway Framework Warehousing along Four Corners Road north of 199th Street fronting on future county park, with greenway on north side of 199th Street buffering Peppertree subdivision from higher intensity development. Commercial, mixed use, and high-density residential development on north quadrants of Gardner Road interchange. Business park/office uses on southeast quadrant of Gardner Road interchange north of projected 195th Street/half-section line link. Warehousing and limited industrial development between the western edge of Gardner s residential development and Waverly Road, buffered by a greenway. 4-10
57 LAND USE SCENARIOS Urban residential use within a mile corridor bisected by Gardner Road in the Nike School neighborhood between 195th Street and 199th Street. Light industrial development along north side of U.S. 56 corridor. Mixed density residential east of Four Corners Road and south of 175th Street. Commercial and light industrial use around Sunflower Road/I-35 interchange. Commercial node at Sunflower Road and realigned U.S. 56. serve development and remove traffic conflicts that reduce capacity of the existing interchange. Improved local circulation south of I-35 and east of Gardner Road, including a new circulator street on the half-section line between Gardner Road and Moonlight Road, and a new 195th Street connection replacing the existing 191st Street and Gardner Road intersection. This concept improves access to residential development sites and removes the 191st Street east access that conflicts with interchange ramps. Street improvements through the center of Edgerton, linking U.S. 56 and the north and south legs of Sunflower Road together. Major Road Transportation/Infrastructure Features (Same as Scenario One) Improvements at the 199th Street/Sunflower Road/U.S. 56 intersection. 199th Street upgrade to a four-lane section between redesigned U.S. 56 access and Homestead Lane. When development thresholds are reached, upgrade to Waverly Road with a dual overpass over the KCIMF switching tracks, consistent with current agreements. Local access service roads approximately ¼ mile from and parallel to Homestead Lane between 191st and 199th Streets. Improved intersection at 207th Street and Sunflower Road. Roadscape and intersection improvements along existing U.S. 56. Redesign of roadway as a multi-modal urban corridor connecting I-35, Downtown Gardner, and Downtown Edgerton. Intersection improvements provide 90 degree T intersections with intersecting roads. Active Transportation Features (same as Scenario One) Primary trail and greenway spine along middle tributary branch between Center Street and 199th Street/Four Corners Road. Connection to existing Center Street Trail in Gardner, providing direct connection between Gardner and Edgerton. New half-section line circulation road (a new 195th Street), extending from Four Corners Road to Center Street at the current 187th Street intersection. The new road is designed to Trail continuation to Hillsdale Lake area using abandoned BNSF right-of-way through Big Bull Creek Park and existing undercrossing along Big Bull Creek at I

58 LAND USE SCENARIOS Trail continuation to Edgerton along 199th Street and on county park property around quarry. South trail loop connecting mixed use interchange cluster, I-35, and 199th Street path to regional spine. North greenway/buffer connection between Waverly Road and Center Street, connecting new and existing Gardner residential areas south of the BNSF to regional system. Improved path connection to Nike Elementary with upgraded Center Street crossing and eastside path along Gardner Road to school. Continuation of trail south along Gardner Road and drainage corridor to 199th Street with 199th Street link to the regional spine. Multi-modal improvement of existing U.S. 56 between Edgerton town center and Gardner Junction Park, with north-south link to 175th Street and 175th Street path to Gardner. Table 4.2: Scenario Two Yield Use LPKC Planning Area Density (FAR or du/a) GFA (in LPKC) GFA (Planning Area) Total Industrial/W&D * ,592,508 8,154,432 15,746,940 Light Industrial ,234,628 2,234,628 Visitor Service , ,624 Business Park ,979,504 2,979,504 Commercial/MU ,690,128 1,690,128 Rural Residential du/a 210 LDR 56 South du/a 1,300 LDR 56 North du/a 1,593 MDR du/a 810 HDR du/a 960 Total Residential 1,442 4,
59 LAND USE SCENARIOS Figure 4.4: Scenario Two Land Use Concept SCENARIO TWO Land Use Concept 4-13

60 LAND USE SCENARIOS SCENARIO THREE MID LEVEL BUILDOUT/GARDNER INTERCHANGE FOCUS Major Land Use Features: Middle range of warehousing build-out with about 14 million square feet, approximately equally divided between LPKC site and surrounding development areas. Figure 4.5: Scenario Three Development Diagram Warehouse uses concentrated on LPKC site, between 191st Street and the middle northeast tributary of Big Bull Creek, and west of Waverly Road between 191st Street and I-35. Potential for traveler/truck related commercial development along west side of Homestead Lane between interchange and 199th Street. Substantial business park development east of Waverly Road and south of greenway spine along the middle tributary, buffering interchange-related mixed use development from warehousing and industrial center. Residential Commercial/Mixed Use Business Park/ Light Industry Warehousing Road Framework Pathway Framework Medium density residential transition on western edge of Gardner, buffered by a greenway from Logistics Park industrial uses along east side of Waverly Road. Frontage along Four Corners Road facing future county park divided between warehousing on 191st Street adjacent to LPKC and 191st Street heavy haul corridor and business park/ light industry to the south. Greenway along 199th Street buffers Peppertree subdivision from business park uses. Commercial, mixed use, and high-density residential development on northwest and northeast quadrants of Gardner Road interchange Business park/office uses east of Gardner Road and south of proposed 195th Street, with residential to the north and south buffered by drainage corridors.


61 LAND USE SCENARIOS Medium-density residential use around Nike School, providing a substantial walking distance neighborhood for the school; continuation of existing rural residential uses along 199th Street. Light industrial development along north side of U.S. 56 corridor, with commercial possibility at Four Corners Road intersection. Rural residential development along Four Corners Road south of 175th Street continued to the east. Single-family urban residential between U.S. 56 light industrial corridor and 183rd Street. Commercial and light industrial use around Sunflower Road/I-35 interchange. New half-section line circulation road (a new 195th Street), extending from Four Corners Road to Center Street at the current 187th Street intersection. The new road is designed to serve development and remove traffic conflicts that reduce capacity of the existing interchange. Improved local circulation south of I-35 and east of Gardner Road, including a new circulator street on the half-section line between Gardner Road and Moonlight Road, and a new 195th Street connection replacing the existing 191st Street and Gardner Road intersection. This concept improves access to residential development sites and removes the 191st Street east access that conflicts with interchange ramps. Street improvements through the center of Edgerton, linking U.S. 56 and the north and south legs of Sunflower Road together. Commercial node at Sunflower Road and realigned U.S. 56. Improved intersection at 207th Street and Sunflower Road. Major Road Transportation/Infrastructure Features (Same as Scenario One) Improvements at the 199th Street/Sunflower Road/U.S. 56 intersection. 199th Street upgrade to a four-lane section between redesigned U.S. 56 access and Homestead Lane. When development thresholds are reached, upgrade to Waverly Road with an overpass over the KCIMF switching tracks, consistent with current agreements. Local access service roads approximately ¼ mile from and parallel to Homestead Lane between 191st and 199th. Roadscape and intersection improvements along existing U.S. 56. Redesign of roadway as a multi-modal urban corridor connecting I-35, Downtown Gardner, and Downtown Edgerton. Intersection improvements provide 90 degree T intersections with intersecting roads. Active Transportation Features (Same as Scenario One) Primary trail and greenway spine along middle tributary branch between Center Street and 199th Street/Four Corners Road. Connection to existing Center Street Trail in Gardner, providing direct connection between Gardner and Edgerton. 4-15
62 LAND USE SCENARIOS Trail continuation to Hillsdale Lake area using abandoned BNSF right-of-way through Big Bull Creek Park and existing undercrossing along Big Bull Creek at I-35. Multi-modal improvement of existing U.S. 56 between Edgerton town center and Gardner Junction Park, with north-south link to 175th Street and 175th Street path to Gardner. Trail continuation to Edgerton along 199th Street and on county park property around quarry. South trail loop connecting mixed use interchange cluster, I-35, and 199th Street path to regional spine. North greenway/buffer connection between Waverly Road and Center Street, connecting new and existing Gardner residential areas south of the BNSF to regional system. Improved path connection to Nike Elementary with upgraded Center Street crossing and eastside path along Gardner Road to school. Continuation of trail south along Gardner Road and drainage corridor to 199th Street with 199th Street link to the regional spine. Table 4.3: Scenario Three Yield Use LPKC Planning Area Density (FAR or du/a) GFA (in LCKP) GFA (Planning Area) Total Industrial/W&D ,095,924 7,187,400 14,283,324 Light Industrial ,554 1,894,860 2,097,414 Visitor Service , ,050 Business Park ,441,240 3,441,240 Commercial/MU ,934,064 1,934,064 Rural Residential South du/a 178 Rural Residential North du/a 138 LDR 56 South du/a 690 LDR 56 North du/a 2,058 MDR du/a 1,734 HDR du/a 324 Total Residential 2,047 5,
63 LAND USE SCENARIOS Figure 4.6: Scenario Three Land Use Concept SCENARIO THREE Land Use Concept 4-17
64 LAND USE SCENARIOS SCENARIO FOUR HIGH BUILDOUT/NORTHSIDE DEVELOPMENT Major Land Use Features: High range of warehousing build-out in excess of 16 million square feet. Figure 4.7: Scenario Four Development Diagram Warehouse uses distributed throughout the study area with four principal concentrations: the Logistics Park site; the Homestead Lane corridor; land between 191st Street and the greenway spine defined by the middle northeast tributary of Big Bull Creek; and sites along the north side of U.S. 56 between the highway and 183rd Street, and south of the Gardner Municipal Airport. Potential for traveler/truck related commercial development along west side of Homestead Lane between interchange and 199th Street. Warehousing and limited industrial development between the western edge of Gardner s residential development and Waverly Road, buffered by a greenway. Residential Commercial/Mixed Use Business Park/ Light Industry Warehousing Road Framework Pathway Framework Business park and light industrial uses between a new 195th Street and I-35, transitioning between warehousing uses along Homestead and residential development closer to the Gardner Road interchange. Frontage along Four Corners Road facing future county park divided between warehousing on 191st Street adjacent to Logistics Park and 191st Street heavy haul corridor and medium-density residential to the south, adjacent to the Peppertree subdivision. A greenway buffer separates residential and industrial uses. Commercial and mixed use core district on northwest and northeast quadrants of Gardner Road interchange. 4-18

65 LAND USE SCENARIOS Urban residential development surrounding the mixed use core, with single-family density to the north, completing existing subdivisions; and higher densities to the west, toward Waverly Road. Maintenance of rural residential development in 191st Street and Waverly Road area, buffered by urban single-family to the south. Business park/office uses east of Gardner Road and north of proposed 195th Street, with single-family residential to the south. Overpass on Four Corners Road over BNSF main line and U.S. 56 with connecting northeast quadrant access. 199th Street upgrade to a four-lane section between redesigned U.S. 56 access and Homestead Lane. When development thresholds are reached, upgrade to Waverly Road with an overpass over KCIMF switching tracks, consistent with current agreements. Local access service roads approximately ¼ mile from and parallel to Homestead Lane between 191st and 199th. Single-family residential use around Nike School, providing a walking distance neighborhood for the school; continuation of existing rural residential uses along 199th Street. Light industrial development on the edge of warehousing uses along north side of U.S. 56 corridor, with commercial potential at Four Corners Road intersection. Single-family urban residential adjacent to and west of Gardner Airport. Commercial and light industrial use around Sunflower Road/I-35 interchange. New half-section line circulation road (a new 195th Street), extending from Four Corners Road to Center Street at the current 187th Street intersection. The new road is designed to serve development and remove traffic conflicts that reduce capacity of the existing interchange. Improved local circulation south of I-35 and east of Gardner Road, including a new circulator street on the half-section line between Gardner Road and Moonlight Road, and a new 195th Street connection replacing the existing 191st Street and Gardner Road intersection. This concept improves access to residential development sites and removes the 191st Street east access that conflicts with interchange ramps. Commercial node at Sunflower Road and U.S. 56. Major Road Transportation/Infrastructure Features Street improvements through the center of Edgerton, linking the U.S. 56 and the north and south legs of Sunflower Road together. Improvements at the 199th Street/Sunflower Road/U.S. 56 intersection. Improved intersection at 207th Street and Sunflower Road. 4-19
66 LAND USE SCENARIOS Upgrade of U.S. 56, maintaining highway designation on the existing route. Upgrade should be designed to handle increased truck traffic resulting from new warehousing and industrial development along the corridor. Active Transportation Features (Same as Scenario One) Trail continuation to Edgerton along 199th Street and on county park property around quarry. North greenway/buffer connection between Waverly Road and Center Street, connecting new and existing Gardner residential areas south of the BNSF to regional system. Primary trail and greenway spine along middle tributary branch between Center Street and 199th Street/Four Corners Road. Connection to existing Center Street Trail in Gardner, providing direct connection between Gardner and Edgerton. Improved path connection to Nike Elementary with upgraded Center Street crossing and eastside path along Gardner Road to school. Continuation of trail south along Gardner Road and drainage corridor to 199th Street with 199th Street link to the regional spine. Trail continuation to Hillsdale Lake area using abandoned BNSF right-of-way through Big Bull Creek Park and existing undercrossing along Big Bull Creek at I-35. South trail loop connecting mixed use interchange cluster, I-35, and 199th Street path to regional spine. Table 4.4: Scenario Four Yield Use LPKC Planning Area Density (FAR or du/a) GFA (in LPKC) GFA (Planning Area) Total Industrial/W&D * ,592,508 7,992,389 14,584,897 Light Industrial ,280,068 3,280,068 Visitor Service , ,380 Business Park ,090,880 2,090,880 Commercial/MU ,437,480 1,437,480 Rural Residential du/a 210 LDR 56 South du/a 1,473 LDR 56 North du/a 1,693 MDR du/a 1,380 HDR du/a 504 Total Residential 1,607 5,

67 LAND USE SCENARIOS Figure 4.8: Scenario Four Land Use Concept SCENARIO FOUR Land Use Concept 4-21
68 LAND USE SCENARIOS THIS PAGE INTENTIONALLY LEFT BLANK 4-22

69 THE PREFERRED LAND USE PLAN PART FIVE THE PREFERRED LAND USE PLAN 5-1
70 THE PREFERRED LAND USE PLAN 5-2 The four scenarios described in Part Four do not represent refined concepts, but illustrate different land use placements and development ideas to test costs, traffic impacts, and stakeholder input. Review of these four related but significantly different options led to comments that inform a preferred scenario -- in this case, an amalgam of the best features of each idea. Review by the project s Core Team, Advisory Committee, public officials, property owners, and other stakeholders led to the following conclusions: Warehousing and distribution uses related to the Intermodal Facility should be located south of the U.S. 56/ BNSF corridor. Locating large-scale distribution facilities that require access to the facilities and cranes of the KCIMF north of the highway would almost certainly require a new overpass at Four Corners Road. The advantages of splitting the concentration of warehouses are not readily apparent and do not support the cost of a very long and expensive grade separation. In addition, major truckling facilities north of existing U.S. 56 would dramatically affect the rural and residential character of this part of the study area. A logical target buildout for warehousing and distribution falls within the upper range of development, from 15 to 16 million square feet. Warehouse demand precedents elsewhere, major warehouse projects that have been announced and will be in place shortly after the opening of the facility, and projections of probable demand suggest that the plan should anticipate the high end of the range over a thirty year planning period. However, the implementation of this plan should sequence development in case long-term warehousing demand falls short of these projections. Higher intensity, non-industrial urban land uses should be clustered around the I-35 and Gardner Road interchange. These uses should include commercial, commercial/residential mixed uses, and higher density residential to maximize value of this strategic location. This core district should have good local street linkages and active transportation features and linkages. Business park uses, potentially combining offices, light industry, and flexible space, are appropriately sited adjacent to the Gardner Road interchange mixed use area. The major focus of warehousing and more intensive industrial uses are generally sited along and west of Waverly Road. The area around Nike School should be developed residentially, creating a walking distance environment for this elementary school. Within the major warehousing district generally between Waverly Road and Four Corners Road: - Various industrial uses are favored along Four Corners Road next to the future county park. The north part of this site, between an extended half-section line circulator road and the 191st Street heavy haul corridor, is most appropriately used for continued warehousing and KCIMF-related uses. The southern half, between the new road and 199th Street, should be in light industrial and office/flex use, with intensity and scale grading down to the south. A greenway along 199th Street should be developed to separate the Peppertree residential subdivision from these non-residential uses.
71 THE PREFERRED LAND USE PLAN - Interchange-related commercial uses would be located along the west side of Homestead Lane. Several existing residential areas are affected by the changes in use generated by the KCIMF. Preferred policies for these include: - Eventual redevelopment of large-lot residential uses southwest of 191st Street and Waverly Road. These homes will be most directly affected by both changes in land use and heavy truck traffic on both Waverly Road and 191st Street. These same factors make them prime locations for distribution and industrial uses. Scenarios that maintained and expanded residential uses in this area were generally discounted. - The large lot Peppertree subdivision will be affected by potential development along Homestead Lane and north of 199th Street, and by the probability of increasing traffic loads on 199th Street. Sewer construction through the drainageway immediately east of Peppertree, leading to the new treatment plant, has also had an influence. However, the relative size of this subdivision and its terrain suggest that it will remain residential. Steps that can maintain the value of this development include a greenway buffer that separates Peppertree from non-residential uses north of 199th Street; regulations to manage lighting and other environmental effects of development along Homestead Lane; and parkway design of 199th Street itself when that road is widened. Improvements to the 199th Street and Sunflower Road intersection should also include direct, unconstrained access for emergency and service vehicles from Edgerton. - A row of existing homes on large lots lines Four Corners Road between 175th and 183rd Streets. These homes are located in an area experiencing substantial oil well drilling. Residents are concerned about possible encroachment of industrial uses in this area. These existing home sites should be surrounded by other residential uses, with light industrial and commercial use limited to the U.S. 56 frontage. - The western edge of Gardner includes single-family subdivisions with some attached development to the half-section line between Center Street and Waverly Road. The relationship of LPKC sites on the east side of Waverly Road to this and future residential development is an issue of discussion between Edgerton and Gardner, which share a common boundary in this area. The preferred option proposes mediumdensity housing west of these existing developments, buffered from warehousing sites on the east side of Waverly Road. Growth at Edgerton s Sunflower Road Interchange. Edgerton s comprehensive plan proposed that most future residential development be located north of 207th Street, with sites around the interchange and up to 207th Street proposed for commercial and light industrial uses. The area plan should reflect these policy directions. Industrial district traffic circulation. The local circulation system in the primary warehousing area should channel traffic to the I-35 and Homestead Lane interchange and actively discourage or prevent heavy truck use of the Gardner Road interchange or travel through the 5-3
72 THE PREFERRED LAND USE PLAN 5-4 City of Gardner. Street system design should provide connectedness, but also discourage major truck use. The system should also provide alternative routes to 199th Street for local truck movements in order to reduce impact on neighboring homes, Mildale Farm, and the future county park. This traffic should instead utilize 191st Street, Homestead Lane, and an industrial collector as primary truck routes. U.S. 56 Routing. Initial traffic review of the scenarios suggest that heaviest east-west travel desire patterns favor a direct connection from U.S. 56 to 199th Street to the new Homestead Interchange on I-35 as the primary movement. Movement on the existing U.S. 56 alignment or along Sunflower Road generates lower traffic volumes. Parts Six and Eight of this Area Plan consider the various advantages and disadvantages of changing the U.S. 56 designation. In any case, the ultimate improvement of the intersection of 199th Street, U.S. 56, and Sunflower Road northeast of Edgerton should accommodate all movements efficiently. Preferred Future Land Use Plan The Preferred Future Land Use Plan (Figure 5.1) presents a diagram that reflects these conclusions and modifies and combines relevant ideas from the four scenarios. In addition to the conclusions presented above, major features of the preferred diagram include: Major warehousing and distribution clustered between the BNSF mainline and I-35, and between Waverly Road and Four Corners Road. The concept illustrates possible orientations and locations for building envelopes and local circulation, based on proposed plans for the LPKC north of 191st Street, a local circulation system, and site planning principles derived from the Watershed Approach. Smaller warehouses and flex industrial buildings would also be developed along the east side of Waverly Road between I-35 and the principal yard lead track. These would be buffered from residential uses farther to the east by a wide greenway. Assuming a projected FAR range of 0.28 to 0.30, consistent with suburban or exurban locations, this yields between 15 and 16 million square feet. A projected Phase One of development should be consistent with Scenario One: the Logistics Park, land along 191st Street north of the greenway spine, and the Homestead Lane corridor. (Combines and develops Scenarios One and Two) A mixed use core community, including substantial commercial, residential, and business park/office development around the Gardner Road interchange. (Similar to Scenario Three) Planned business park between the interchange core and industrial/warehousing uses fronting Waverly Road. (Similar to Scenario Three) Residential neighborhoods around Nike School, south of 195th Street to 199th Street. (Scenario Two and Four) A looped freight and employee circulation system that connects 191st Street and a new 195th Street into a loop that directs truck traffic back to Homestead Lane. A secondary connection would link this loop to Center Street at 187th Street. This system is designed specifically to provide connected local circulations while discouraging truck use of Gardner Road.

73 THE PREFERRED LAND USE PLAN Figure 5.1: Preferred Future Land Use Plan Preferred Future Land Use Plan E = Existing F = Future (requiring future remediation of oil drilling sites) 5-5
 Potential signing of U.S. 56 along 199th Street to Homestead Lane, and Homestead Lane to I-35.")


74 THE PREFERRED LAND USE PLAN Spectrum of residential densities. From left: Rural residential, low-density urban, medium-density, and high-density residential use. Relocation of the existing 191st Street outlets to Gardner Road north and south of the interchange. (Common to all scenarios) Potential signing of U.S. 56 along 199th Street to Homestead Lane, and Homestead Lane to I-35. (Scenarios One, Two, and Three) Land Use Types The Preferred Future Land Use Map, like the scenario diagrams, illustrates a geographic distribution of land uses based on the conclusions and policies discussed above. For the sake of both clarity and policy, it is valuable to describe briefly what each of these categories means, and the ranges of development that they imply. Residential Uses Conservation residential. This is a form of residential development appropriate to areas with important natural features or environmentally sensitive areas. It locates home sites in areas that are relatively buildable with minimal environmental impact, leaving more vulnerable areas open. In cluster applications, smaller individual lot sizes are often permitted in exchange for leaving resource areas open and undeveloped. In the study area, conservation development is focused on the resourcerich areas south of I-35. These areas have a major impact on Hillsdale Lake and soil conditions that lend themselves very well to green infrastructure. Rural residential includes more conventional, large lot or acreage development, typically with septic systems or other self-contained wastewater techniques. These areas are outside of existing or projected urban services areas. Large lots along Four Corners Road are examples of rural residential use. Low-density residential typically includes moderate to large single-family lots with urban services. Density is high enough to make urban infrastructure financially feasible. In the study area, these areas represent logical urban growth directions for Gardner and Edgerton. Medium-density residential includes a variety of residential uses from moderate and small-lot single-family to attached homes, townhomes, and smaller multi-family 5-6


75 THE PREFERRED LAND USE PLAN development, all with urban services. In the study area, they are a transitional use, developed in service-rich areas around the edge of activity centers or higher intensity uses. High-density residential addresses multi-family development, but may also include a range of lower-density housing forms. In the preferred scenario, high-density residential is located adjacent to similar development or adjacent to proposed commercial or mixed use centers. Mixed use residential includes housing integrated into urban mixed use developments or buildings, and is typically found in town center or new urbanist projects. In the preferred scenario, mixed use residential is incorporated into a proposed urban project north of the I-35/Gardner Road interchange. A concept for this area appears later in this section as a special study illustration. Commercial Uses Commercial retail includes buildings and centers offering retail goods and services, as well as hospitality and visitor services. These uses in suburban areas are typically found in single-use buildings or projects and are usually oriented to automobile transportation. In this plan, these areas are also served by active transportation, and their design should provide safe and comfortable bicycle and pedestrian access. Retail commercial in the study area is focused around the I-35 interchanges. The Gardner interchange is projected to have the largest concentration of retail use as part of a major mixed use development center; the Homestead Lane interchange is projected for visitor and travel services; and the Sunflower Road interchange is for more limited convenience commercial. The scenario also suggests smaller retail clusters at 191st Street and Four Corners Road and at U.S. 56 and Four Corners Road. Commercial non-retail includes commercial development that provides trade services or sales of wholesale or industrial goods and services. In the preferred scenario, these uses are currently established. Future development is likely to be included among larger industrial, business park, and warehousing uses. Commercial mixed use includes pedestrian-oriented retail uses integrated into mixed use buildings, This use appears in the town center project envisioned north of the Gardner Road/I-35 interchange. Business Park/Industrial Uses Business park is a general category that includes offices, and hybrid office with secondary and very limited distribution and industrial uses. Business park uses imply planned projects with controls to ensure quality design and minimization of external effects. Because office uses predominate, they generate significant employment. In the preferred scenario, they are located in areas with very good access but as a transitional buffer between residential areas and more intensive industrial development. Light industrial includes industrial uses such as fabrication, limited distribution, research, and related activities, along with associated office uses. In business parks, offices generally define the character of the development while industries present the more public face in these areas. Light industrial uses are established in buildings of small to Mixed use development. Renaissance Place in St. Louis illustrates integration of retail and housing at suburban scale in a mixed use development. Walk-up rental four-plex buildings in a traditional neighborhood setting. These structures, in the Hancock Park neighborhood in Los Angeles, illustrate how small multi-family structures can present the quality and appearance of a single-family neighborhood. Streets like these are suggested later in this chapter as a buffer between singlefamily subdivisions on the west side of Gardner and the eastern edge of industrial development around the intermodal facility. 5-7


76 THE PREFERRED LAND USE PLAN Commercial-retail development north of Main Street and Moonlight Drive in Gardner. Business park in an environmentally sensitive wetlands area. medium scale and with limited or visual impact. They too are transitional uses to more intensive industrial development, but are somewhat more separated from adjacent residential areas than business parks. Warehousing and distribution are the dominant uses in the preferred scenario, and may include very large floor plates and substantial heavy truck traffic. In the preferred scenario, the larger scale buildings are focused between the KCIMF and I-35, with smaller facilities on the east side of Waverly Road. Public and Miscellaneous Uses A significant part of the study area includes public or other uses, including resource extraction. Most significant of these are the KCIMF itself; the Johnson County Park and Recreation District property, including Mildale Farm and the future Big Bull Creek Park; and the quarry east of Edgerton. A conservation based concept for the Johnson County property, consistent with the watershed approach, is presented as a special study area later in this section. Yield Projections The Preferred Future Land Use Map (Figure 5.1) shows the desirable geographic distribution of land uses that emerged from the planning process. Understanding the overall potential yield of this plan leads to an understanding of its implication in terms of building area, new population and households, and the services such as transportation needed to accommodate that growth. Ultimately, this information is used to develop the travel demand model, presented in Part Six, that guides transportation development policy. Table 5.1 displays the development factors used to make these calculations. Consistent with the land use scenarios presented in the preceding chapter, these factors use dwelling units per acre (du/a) for residential use types and floor area ratio (FAR) for commercial and industrial uses. The table also shows the assumptions used to calculate employment for non-residential uses, because employment is a critical component of travel demand. Table 5.1: Household and Employment Estimating Factors Building DU/ FAR Area (SF)/ HH Size Acre Employee Conservation 0.1 Rural Residential 0.5 Low Density Residential Medium Density Residential High Density Residential Mixed Use Mixed Use - Retail Mixed Use - MDR 6 Mixed Use - HDR 12 Business Park Light Industrial Warehouse and Distribution Commercial - Retail Commercial - Non Retail

77 Figure 5.2: Central Planning Area THE PREFERRED LAND USE PLAN Central Planning Area 5-9
78 THE PREFERRED LAND USE PLAN Table 5.2 then applies these factors to the preferred scenario. For example, the plan produces about 1,290 acres of land area devoted to warehousing, distribution, and associated use. Based on the FAR s typical for comparable projects, this produces a capacity of about 16 million square feet, consistent with the high end of the proposed market range. Warehousing, of course, uses a large amount of space but provides a relatively small number of jobs per square foot. Using the standard of one employee per 2,500 square feet of gross floor area, the longterm buildout of the entire 1,290 acres produces about Table 5.2: Preferred Scenario - Household and Employment Estimating Factors Total Acres Household Units GFA in SF Employment Conservation 2, Rural Residential Low Density Residential (LDR) 372 1,021 Medium Density Residential (MDR) 253 1,518 High Density Residential Mixed Use-MDR Mixed Use - HDR Total Residential 3,895 3,921 Mixed Use - Retail ,256 Commercial - Retail 263 1,045,440 Commercial - Non Retail 17 55,539 Total Commercial 293 1,214,235 2,024 Business Park 231 2,515,590 Light Industrial 470 3,070,980 Warehouse and Distribution 1,290 16,080,174 Intermodal Facility 340 Total Industrial 2,331 21,666,744 15,531 Overall Totals 6,519 3,921 22,880,979 17,555 6,400 jobs. By comparison, the much more employment intensive business park use generates nearly the same number of jobs with much less area. From a transportation planning perspective, the challenges of warehousing and business park uses are very different: one deals with shift changes and heavy truck movements, the other with commuters. The travel demand model accounts for these differences. These projections appear very large, especially in the business park and light industrial categories. These land uses are opportunistic, and development may not achieve these numbers, even by Yet, these yields represent potential that should be reasonably served by the transportation system. If the capacity of the system is inherently unable to move that level of traffic without excessive cost, this is in itself a limit to development. On the other hand, residential, commercial, and, in the current case, warehousing demand are somewhat easier to forecast and test. The yields in the preferred scenario produce about 107% of projected warehouse land needs, 29% of the projected urban residential land demand, and 61% of the projected commercial land demand identified in Part Two. These numbers appear reasonable, given future growth directions and constraints in the study area s municipalities. Transportation Analysis Zones: Assigning Population and Employment Development of a travel demand model requires assignment of population and employment projections generated by the preferred land use plan to Transportation Analysis Zones (TAZ s). These analysis areas were estab- 5-10

79 THE PREFERRED LAND USE PLAN lished by the Mid-America Regional Council (MARC) for use in developing and maintaining the metropolitan Kansas City area s regional travel demand model. Figure 5.3 shows the division of the study area and the preferred scenario map into TAZ s. Tables that assign development area, household units and gross floor area, employees, and population to the TAZ s are included in the Appendix. Figure 5.3: Preferred land use scenarios with Transportation Analysis Zones While this chapter concentrates on the full development of the study area projected for 2040, actual development is a gradual process that has different traffic and infrastructure needs at different times. The maps on the next page display projections of the state of development at the approximate opening day of the KCIMF in the Fall of 2013 and an interim phase about halfway through the planning period. The Opening Day development includes: The completed intermodal facility. Completion of new development within the Logistics Park Kansas City campus, totalling about 850,000 square feet in new warehouse space. These include a grain distribution facility and two distribution centers. The interim (year ) development projection includes: Development Sequence Buildout of the LPKC campus. Additional warehousing development of areas south of 191st Street and north of the middle Big Bull Creek tributary, and along the immediate Homestead Lane frontage, relatively consistent with Scenario One. Substantial development of the mixed use center and surrounding commercial growth north of the Gardner Road interchange. New residential development on the west side of Gardner, up to the proposed buffer between residential and industrial uses. Additional residential growth south and east of Nike School. Initial business park development on the edge of the LPKC. 5-11


80 THE PREFERRED LAND USE PLAN This interim scenario generates: About 11.5 million SF of warehousing and distribution space, of which about 7 million SF is contained within the LPKC campus million SF of office and flex business park space. 1.1 million SF of light industrial. About 600,000 SF of new retail and visitor services. About 2,500 urban housing units, within or annexable into Gardner and Edgerton. Special Study Areas The diagrams shown in Figures 5.4 and 5.5 display the overall interrelationship of land use, transportation, open space preserves, parks, and intercity and greenway trails and corridors. But some individual areas require further illustration of concepts to help guide the character of development envisioned by this plan. These areas include: Applying the Watershed Approach development to specific development of large-scale warehousing, with special attention given to the relationship of development and watercourses. The study area s park and trail/greenway system, including general concepts for the Big Bull Creek Park. The Gardner Road mixed use center. The Gardner/Edgerton (and residential/industrial boundary) between Poplar Street and Waverly Road. Figure 5.4. Opening Day development diagram. Figure 5.5. Midway (year ) development diagram. 5-12

; preventing discharge of pollutants into the")
81 THE PREFERRED LAND USE PLAN Special Study: Minimizing Impact of Large Warehouses The watershed approach to planning and site design in most development involves reducing impact, detaining stormwater, and maintaining natural runoff patterns by reducing building footprints and impervious coverage and siting smaller buildings in ways that create surface retention possibilities. Large warehouses, with extremely high coverage single-story buildings, large truck maneuvering areas, and little site planning flexibility, require a completely different approach. The ultimate objective is to minimize stormwater impact by reducing or delaying flows into the Big Bull Creek system (and consequently Hillsdale Lake); preventing discharge of pollutants into the natural drainage system; and minimizing effects on vegetation, topography, and animal habitat. Water quality can be improved by on-site sedimentation, filtration, soil adsorption, microbial decay processes, and the uptake of pollutants by plants. Watershed-based Stormwater Principles Minimize land disturbance Reduce continuous impervious surfaces Imitate the hydrology of native ecosystem Retain and process stormwater where it lands Infiltrate more, shed water off-site less Maintain natural flow path Decentralize and micromanage stormwater at its source Lengthen flow paths Reduce storm pipes, curbs and gutters Preserve sensitive soils and use absorptive soils where they exist on the site Minimize grading disturbance Reduce impervious surfaces and use permeable materials where possible. Avoid unnecessary pavement. Provide substantial buffers where private development sites touch the edge of major drainageways. Incorporate buffers into path and trail networks Best management practices to maximize water quality Bioretention Cells and Bioswales within or between large areas of hard surfaces, with grading of parking and truck maneuvering areas to use direct runoff to them. Permeable and Porous Pavements Green Roofs Soil Restoration and Amendment Roof Water Harvesting and Reuse Schematic diagram of Low Impact Development Rain Barrels and Cisterns Techniques Site grading and development Use open on-site drainage Flatten slopes to reduce runoff velocity Disperse drainage to multiple routes 5-13


82 THE PREFERRED LAND USE PLAN Steps in a conservation design process for warehouse buildings 191st Street LPKC 5 Design buildings, site improvements, and details that utilize best stormwater management practices. 4 Define building sites and hard-surfaced areas. Calculate and manage impact of these areas. 3 Identifying and reserving areas on and adjacent to the development for green infrastructure and conservation. 2 Conceptual plan identifying building and conservation areas based on site and impact analysis. Homestead Lane Big Bull Creek Middle Trib Aerial photography, site analysis, topography, definition of drainage and soil constraints and opportunities. Applying the process to the study area. Top: Site southeast of 191st Street and Homestead Lane. Above: Sketch of a development concept using retention basins, bioswales, and stream buffers to manage stormwater flows.

83 THE PREFERRED LAND USE PLAN Figure 5.6: Conservation Based Park Concept Special Study: Mildale Farm / Big Bull Creek Park The Johnson County Park and Recreation District owns and operates the historic Mildale Farm and has acquired about 1,400 acres south of 199th Street for a future regional park. From the perspective of watershed conservation, this acquisition is especially prescient, protecting an enormous part of the Hillsdale Lake drainage area in the face of the dramatic land use transitions to the east. In the future, the District will sponsor a master planning process for the regional park. Current short-term possibilities are a large group camping area and a prairie and woodland management program. Figure 5.6 illustrates a concept for a conservation based park, consistent with the watershed approach. It envisions a variety of passive recreation activities, including an extensive pathway system and opportunities for camping, fishing, interpretive education, and low-impact organized activities. The concept also includes extensive stream bank, wetland, prairie establishment, and habitat enhancements. Of particular importance is the treatment of 199th Street through this major greenway. The concept suggests treating this corridor as a parkway, managed to accommodate substantially increased traffic with minimum effect on the environment. A tunnel under 199th Street for bicycle and pedestrian traffic would link Mildale Farm and the regional park. The 199th Parkway idea is further discussed in Parts Six and Seven. These park conservation principles should be incorporated into the park master plan, even if some areas are programmed for more active recreation. 5-15


84 THE PREFERRED LAND USE PLAN Center St. Special Study: An Urban Center at the Gardner Interchange 183rd St. The Gardner Road interchange presents a significant opportunity for mixed use urban development and the preferred scenario recognizes this potential. Combining retail, office, and residential uses in a project design that emphasizes walkability and trail access can reduce internal trips, helping the area absorb its development potential while reducing stress on the I-35 interchange. 191st St. Figure 5.7 on the facing page illustrates one possible concept for mixed use development. This concept also adapts the watershed approach to site design, discussed in Chapter Three, to this development site. Major features include: Waverly Rd. 35 Gardner Rd. 199th St. - A realignment of 191st Street north to 188th Street at the Center Street intersection to provide better separation from access ramps. This is consistent with current platting and site development concepts. - A residential component that includes the planned expansion of Horizon Trails apartments to the north and additional multifamily development to the south. - Auto-oriented retail development along the highly visible periphery of the site, served by a rear access road. - A main street mixed use component linking the peripheral retail to Horizon Trails and other residential development. - An office or business park between the residential neighborhood and the Interstate. - Connections to the road and active transportation systems proposed in Chapters Six and Seven Roundabouts and traffic calming measures to discourage truck traffic from accessing I-35 via Gardner Road.


85 THE PREFERRED LAND USE PLAN Figure 5.7: Gardner Interchange Development Concept th Street st Street Gardner Road Contemporary walkable mixed use development in Omaha, NE (top) and Hopkins, MN 1 191st-188th Street Realignment 2 Auto-oriented commercial 3 Existing commercial 4 Walkable mixed use 5 Horizon Trails multifamily 6 Multifamily expansion 7 Single-family with green space 8 Medium-density residential 9 Office/business park 10 New I-35 bridge with path 11 Regional trail connection 12 Water/stormwater feature 5-17


86 THE PREFERRED LAND USE PLAN Center St. 183rd St. 191st St. Special Study: The Gardner/Edgerton Edge The area on the western edge of Gardner, between 188th and 183rd Street from Waverly Road east to the edge of Gardner s existing residential development presents a variety of challenges. Industrial growth is likely to surround the intermodal facility, and part of the Logistics Park Kansas City is located east of Waverly Road. On the other hand, previous residential development on the edge of Gardner was planned for expansion with similar residential uses. The edge condition where these primary industrial and residential uses meet must be addressed by land use policy. Other issues beyond land use include jurisdictional boundaries between Gardner and Edgerton, and the financing of the eventual improvement of Waverly Road. 35 Figure 5.8 on the facing page illustrates a concept for development at this edge. Major features include: 199th St. - Currently approved development plan for Horizon Trails apartments, with expansion to the north. Waverly Rd. Gardner Rd. - Single-family development completing existing subdivisions on the west edge of Gardner. - Continuation of Poplar Street as a neighborhood collector south into the expanded Horizon Trails. - Small lot single-family and attached housing, transitioning to smaller multi-family buildings on the periphery of the residential development area. - Preservation of existing drainage features as neighborhood green spaces A greenbelt with trails with a typical minimum width of 200 feet between residential and industrial/warehousing land use areas.

87 THE PREFERRED LAND USE PLAN Figure 5.8: Development Concept along the Gardner/Edgerton Edge 5 183rd Street rd St. 7 Center Street Continued single-family 2 Small-lot single-family 3 Alley-loaded attached homes 4 Multi-family 5 Buffer greenbelt and trail connections 6 Drainage-related greenspace 7 Poplar Street extension 8 Future industrial - Special Design Standards 9 Horizon Trail Apts. expansion rd Street traffic calming 188th Street 5-19
88 THE PREFERRED LAND USE PLAN THIS PAGE INTENTIONALLY LEFT BLANK 5-20
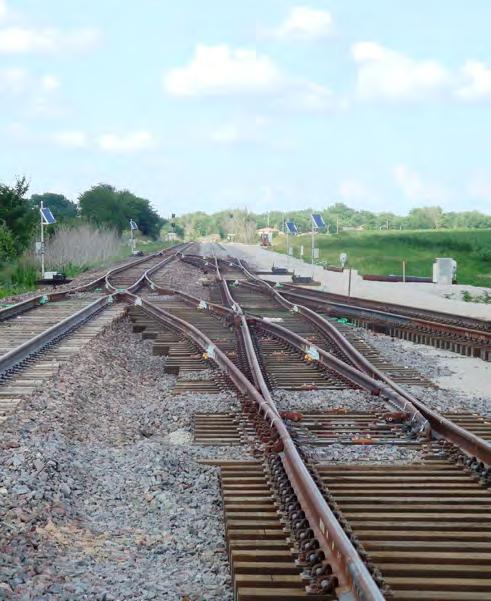
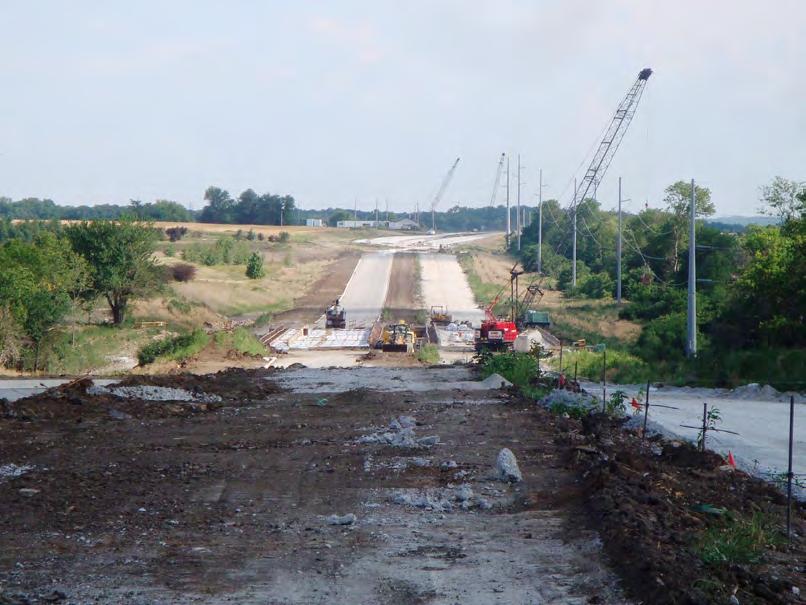
89 TRANSPORTATION PART SIX TRANSPORTATION 6-1
90 TRANSPORTATION Introduction Development associated with BNSF s Kansas City Intermodal Facility (KCIMF) and the Logistics Park Kansas City (LPKC) will require numerous improvements to the transportation network in this portion of Southwest Johnson County. This transportation element of this Area Plan analyzed the various land use scenarios using travel demand modeling to determine that planned developments would not exceed the capacity of the transportation system. After identification of a preferred land use scenario, the travel demand model then identified anticipated changes in travel patterns and tested alternatives for transportation improvements. The results of this process led to recommendations for modifying the current Johnson County, Gardner, and Edgerton transportation plans and to inform KDOT decisions. This process also reviewed previous studies to determine the validity of their recommendations based on the development associated with the 2040 land use assumptions developed in this plan. An example of such a recommendation was considering the re-designation of U.S. 56 from its current route to the 199th Street Corridor from Sunflower Road to the Homestead Lane interchange, creating a more direct route to I-35. It should be noted that although this chapter specifically addresses the roadway network, accommodations for bicycles and pedestrians would be considered as a part of roadway or intersection improvements. These elements are discussed in more detail in Part Seven-Active Transportation. Functional Classification Functional classification groups highways, roads and streets according to the character of service they provide, and is developed for regional transportation planning purposes. Functional classification defines the roles that different routes play in serving the flow of traffic through the regional roadway network. The following Functional Classification definitions apply to the roadways within the study area: Interstate Highway. A divided arterial highway for through traffic with full control of access and grade separations at major intersections. Arterial. A class of roads serving major traffic movements (high-speed, high volume) for travel between major points. Collector. In rural areas, routes that serve intra-county rather than statewide travel. In urban areas, streets that provide direct access between neighborhoods and arterials. Local. Roadways that are intended to serve adjacent land uses with frontage along the roadway and limited traffic from adjoining developments. The Functional Classification Map on the Kansas Department of Transportation (KDOT) website for the Mid- America Regional Council (MARC) area was used as the foundation for the plan area. The proposed Functional Classification Map (Figure 6.1) reflects the following changes in the street network around the intermodal facility. 6-2

91 D RD R RD HT RD LES RD EDGERTON RD W 151ST ST Functional Classification Map Figure 6.1: Study Area Functional Classification Map TRANSPORTATION W 159TH ST W 167TH ST W 151ST ST SUNFLOWER RD DILLIE RD FOUR CORNERS RD WAVERLY RD Functional Classification Map N CENTER ST GARDNER RD MOONLIGHT RD NEW CENTURY PKWY 56 W 175TH ST MAIN ST E SANTA FE ST EVENING STAR RD EVENING STAR RD W 183RD ST W 167TH ST W 191ST ST W 175TH ST 56 W 159TH ST EDGERTON RD W 8TH ST W 183RD ST E NELSON ST SUNFLOWER RD DILLIE RD FOUR CORNERS RD HOMESTEAD LN S CENTER ST N CENTER ST GARDNER RD S CENTER ST 35 W 199TH ST Legend Functional Classification Legend Interstate Highway Other Principal Arterial Minor Arterial Urban & Major Rural Collectors SW Johnson County Area Plan Boundary Functional Classification Interstate Highway W 207TH ST W 191ST ST W BRAUN ST SPOON CREEK RD HOMESTEAD LN WAVERLY RD MAIN ST MOONLIGHT RD NEW CENTURY PKWY E SANTA FE ST 56 WAVERLY RD 35 GARDNER RD W 215TH ST MOONLIGHT RD CEDAR NILES RD W 199TH ST Other Principal Arterial Minor Arterial Urban & Major Rural Collectors SW Johnson County Area Plan Boundary 56 W 8TH ST E NELSON ST 6-3
92 TRANSPORTATION An interruption in 183rd Street between Waverly Road and U.S. 56. An interruption in 191st Street between Four Corners Road and U.S. 56. The upgrade of Homestead Lane between 191st Street and I-35. This new roadway is shown as a Minor Arterial. Existing and Committed Street Network The Functional Classification map and the Existing and the Committed Street Network were used as the base condition for the transportation analysis. Table 6.1 lists the projects within the study area that were assumed to be completed over the next few years. The analysis considered these projects to be in place before identifying additional improvements generated by the future traffic assignments. The trigger column in the table refers to the various improvement thresholds in the initial development agreements between the City of Edgerton and The Allen Group. The project agreements were amended in March 2013 to replace The Allen Group with NorthPoint Development as the developer of record for the Logistics Park Kansas City (LPKC). 6-4 Table 6.1: Existing and Committed Street Network Map No. Location Description Lead Agency Trigger Current Status Private Development A West 191st Street BNSF Intermodal Facility BNSF Under Const. B West 191st Street DeLong Grain Transload Facility DeLong Co. Inc. Under Const. C West 191st Street (Inland Port I) Speculative 500,000 sq ft warehouse NorthPoint Under Const. West 191st Street (DEMDACO) Approx 333,000 sq ft warehouse NorthPoint Under Const. D Non-Rail Served Warehousing Warehousing / Distribution south of IMF NorthPoint Planned E Rail-Served Warehousing Warehousing / Distribution north of IMF NorthPoint Planned Roadway Improvements 1 I-35 at Homestead New Interchange KDOT Under Const. 2 Homestead Road, I-35 to 191st Street 4-Lane Divided Roadway KDOT Under Const st Street, Four Corners to Waverly Road Three Lane Paving (14" Concrete) Johnson Co. Under Const. 4 Nelson Street at BNSF Quiet Zone Improvements Edgerton Stage th Street at BNSF Quiet Zone Improvements Edgerton Stage st Street Waverly Rd. to Gardner Road Realign to 188th- 3-Lane (4-Lane Future) Johnson Co. Gardner CIP Waverly Road, 191st Street to U.S. 56 Paving- 2 Lanes W/Ditch Section Edgerton Planned Stage 2 Gardner CIP Public Road South Internal Logistics Roadway Edgerton Stage 2 Planned 9 Public Road North (East Portion) Internal Logistics Roadway Edgerton Stage 3 Planned 10 Sunflower at I-35 Interchange Rebuild Grade Separation over I-35 KDOT Main Street & Center Street Add E-W Left Lanes & N-S Right Lanes KDOT th Street, U.S. 56 to U.S. 169 Construct Shoulders and Significant Overlay Johnson Co. 2014

93 TRANSPORTATION Figure 6.2: Existing and Committed Street Network Legend Interstate Highway 4 - Lane Rd 2 - Lane Rd Paved Unpaved BNSF Railway SW Johnson County Area Plan Boundary 6-5


94 TRANSPORTATION Existing (2010) Traffic Volumes The existing 24-hour traffic volumes were compiled from a variety of sources, primarily the KDOT, MARC, and Gardner websites. These traffic volumes, reviewed for consistency, provide baseline data to help calibrate the travel demand model and explain existing traffic operations within the study area. Some of the counts were taken before construction began on the KCIMF. The construction of the intermodal facility required several closures of major and collector streets, including segments of Four Corners Road, 183rd Street, and 191st Street. A natural redistribution of traffic is likely to occur when comparing these previous counts to future forecasts. 6-6
95 D RD Figure 6.3: Existing (2010) Traffic Volumes W 151ST ST 2010 Traffic Count Map TRANSPORTATION W 167TH ST EVENING STAR RD W 167TH ST EVENING STAR RD W 151ST ST W 159TH ST 56 W 159TH ST W 175TH ST W 183RD ST W 175TH ST W 183RD ST W 191ST ST W 207TH ST W 191ST ST EDGERTON RD W 8TH ST EDGERTON RD E NELSON ST W BRAUN ST SUNFLOWER RD DILLIE RD 764 1, ,2601, ,960 SUNFLOWER RD 3, ,114 4,260 19, , Traffic Count Map 2, , ,580 2,310 1,720 2,975 DILLIE RD SPOON CREEK RD FOUR CORNERS RD FOUR CORNERS RD HOMESTEAD LN 120 1,970 WAVERLY RD 4,100 2,000 9,230 1,580 1,7204, / , Closed 1, , HOMESTEAD LN 285 Closed / WAVERLY RD WAVERLY RD 2,740 8,535 GARDNER RD N CENTER ST S CENTER ST ,230 4,520 24,900 1, ,740 1, , ,175 2,135 8, GARDNER RD N CENTER ST S CENTER ST 35 GARDNER RD 24,900 MAIN ST 9,555 2,610 8,205 MOONLIGHT RD NEW CENTURY PKWY 15,500 2,310 2,215 2,975 8,745 MAIN ST 3,260 15,500 9,555 29,300 8, ,215 3,075 8,745 2,016 29,300 W 215TH ST MOONLIGHT RD MOONLIGHT RD 39,500 23, E SANTA FE ST W 199TH ST CEDAR NILES RD 9,400 2, , ,970 1,366 3,260 1, NEW CENTURY PKWY E SANTA FE ST ,075 W 199TH ST 56 39,500 9,400 Legend XXX / XXX = 24-Hour Traffic Counts Obtained Summer of 2010 (KDOT Website) Legend SW Johnson County Area Plan Boundary XXX / XXX = 24-Hour Traffic Counts Obtained Summer of 2010 (KDOT Website) SW Johnson County Area Plan Boundary 56 W 8TH ST E NELSON ST 750 1,175 1, R RD 2,016 HT RD 1,450 ILES RD
96 TRANSPORTATION Traffic Forecasting Methodology Several transportation models used in previous studies were evaluated to determine their applicability for this Area Plan. These models included the MARC Model, the Five-County Model, and models developed for the cities of Gardner and Olathe. KDOT provided information about each of the four base models that apply to the study area, including general background information and the appropriate contact for each model. Relevant details about the models are summarized below: MARC Model This was the most comprehensive of the travel demand models and includes the nine-county Kansas City metropolitan area. The primary drawback with this model was the software platform, EMME, which was not available for use on the study. Because other models were available in familiar software platforms, these model files were not necessary for further analysis. KDOT 5-County Model This model covers five counties in the state of Kansas (representing a portion of the MARC model with the addition of Douglas County) and was a converted/amended version of the MARC model, refined to work with TransCAD 5.0. The model was available for the 2010 and 2040 time periods and was already acquired for this project. During the preliminary review of the model, the team ran the 2010 and 2040 models to successful completion and examined the results. While user manuals were not available for this model, edits were possible through close coordination with Parsons Brinkerhoff, developers of the model for KDOT. Olathe Model The City of Olathe maintains this Trans- CAD model. The model does not cover the entire study area and could not be readily modified. In addition, the outer forecast year was 2035 rather than the desired Gardner Model This model was developed as part of previous transportation studies completed for the City of Gardner. This model was not acquired since it has similar characteristics to the Olathe model. A review of these models determined the most appropriate one for use within the Southwest Johnson County Area Plan boundaries for the Year Ultimately the 5-County Study model was chosen because: 1. The network in the model covered the entire study area. 2. The model included background growth and travel forecasts for the year The model provided a reasonable breakdown in traffic zones within the study area. More information regarding the use of the 5-County Model is included in the Appendix. 6-8

97 TRANSPORTATION Adjustments to the KDOT 5-County Model Adjustments were necessary to the street network in the 5-County Model (Model) to reflect changes previously discussed in the Functional Classification as well as the Existing and Committed Street Network sections. The Model generates trips based on residential and nonresidential land uses and distributes the trips between these uses based on the shortest travel times between the productions and attractions. This is true for both truck and auto trips. Since a major focus of the plan was to evaluate and segregate truck movements to specific routes on the street network, it was necessary to remove certain truck trips from the Model. to remove the freight vehicles from the Model. After running the Model with the adjusted non-retail employment, freight trips were manually added back to the calibrated model results. The truck trips were assigned using site specific generation rates and trip distributions to and from the new intermodal facility as well as potential new warehouse and distribution centers. Figure 6.4: Southwest Johnson County Traffic Analysis Zones The land use scenarios developed for this Area Plan included employment for all traffic zones (TAZs) in the Model. Auto and freight trips are automatically generated by a rate per employee based on the 5-County Model travel demand process. However, the unusual trip generation characteristics of the intermodal and warehouse facilities required a different freight generation and assignment process for non-retail trips. In order to accomplish this goal, a share of the non-retail employees equal to the share of auto versus freight trips was removed from the travel demand model land use. In essence, the resulting reduction in land use removed the share of non-retail trips from the model, allowing freight trips to be added manually at the end of the modeling process. Based on the generation rates, 60% of non-retail employment trips are auto and 40% are freight. Thus, the growth in non-retail employment was reduced by 40% 6-9

98 TRANSPORTATION Future Truck Traffic Generation Intermodal Facility. The projected trips for the KCIMF are presented in Table 6.2. The trip rates are based on the number of crane lifts moving containers between rail and truck each year. The lifts are converted to a truck rate per average weekday, with bobtail or empty tractor rates identified separately. Trip rates use data from the Traffic Technical Report in the Intermodal Facility s environmental review documents. Total weekday truck trips represent the total projected two-way traffic flow entering and leaving the secured truck entrance on a typical weekday. This entrance is located on the north side of 191st Street, approximately 700 feet west of Homestead Lane. ropolitan area. The lift activity at the KCIMF is projected to increase as new Warehouse / Distribution facilities are constructed in the LPKC and the surrounding area. The ultimate capacity of the Intermodal Facility is estimated at 1.5 million lifts per year. The internal trips are those trips that are expected to occur between the KCIMF and the adjacent Logistics Park Kansas City (LPKC) or other Warehouse / Distribution Facilities in the immediate area. In the initial years, the Intermodal Facility will primarily provide more efficient service to existing external facilities in the greater KC met- Table 6.2: Projected Trips for KCIMF Generator of Truck Traffic Opening Year Interim Estimate 2025 Ultimate Capacity 2040 Unit of Development Million Lifts/ Year Million Lifts/ Year Million Lifts/ Year Quantity Truck Rate* Truck Trips/ Weekday Bobtail Rate* Bobtail Trips/ Weekday Total Weekday Truck Trips Internal Trips ** Remaining External Trips ,588 1,794 2,566 1,283 3, , ,588 3,588 2,566 2,566 6,154 1,633 4, ,588 5,382 2,566 3,849 9,231 1,971 7,260 * Trip Rates from Table A1 Traffic Technical Report for the Gardner Intermodal Facility May 2009 ** I-35 BIA Study estimates indicated 25% of the ultimate Warehouse Distribution traffic would be to and from the intermodal facility 6-10

99 TRANSPORTATION Warehouse/Distribution Truck Traffic. The projected truck traffic generated by the LPKC and other area Warehouse/ Distribution facilities are shown in Table 6.3. These facilities will allow supply chain companies to move their goods from a central distribution point by rail and deliver them closer to their market destinations. New Warehouse / Distribution facilities would provide more efficient transfer and redistribution of products to area commercial and retail outlets and ultimately consumers. The new facilities also provide an opportunity to send local agricultural products to global markets at lower costs. Local crops, meat, and other agriculturally related products can be reloaded in the LPKC and shipped through the Intermodal Facility more economically than through traditional terminals. The trip rate data are taken from the environmental review documents Traffic Technical Report and the Fontana Truck Trip Generation Study. Table 6.3: Projected Warehouse/Distribution Center Truck Traffic KCLP Gross Floor Area (GFA) Planning Area Total Rate -KCLP* (Trips/ KSF) KCLP Truck Trips / Weekday Rate- Planning Area** Planning Area Total Truck Trips Intermodal Trips*** Opening Year , , Preferred Scenario ,605,278 2,953,368 11,558, , ,534 1,633 4,900 Preferred Scenario ,605,278 7,474,896 16,080, , ,230 7,883 1,971 5,912 Scenario ,807,534 6,285,708 16,093, , ,875 8,318 2,079 6,238 External Trips *Rate- KCLP based on Fontana Truck Trip Generation Study for Heavy Warehousing **Rate- Planning Area based on Fontana Truck Trip Generation Study for Light Warehousing *** I-35 BIA Study estimates indicated 25% of the ultimate Warehouse Distribution traffic would be to and from the intermodal facility 6-11
100 1% 1% 2% TRANSPORTATION Figure 6.6: Warehouse/Truck Distribution XX% = WarehouseTruck Distribution Percentage Truck Traffic Generation Intermodal Facility. The distribution of trucks to and from the KCIMF were assigned based on previous research from the facility s environmental documents. The truck distribution percentages in Figure 6.5 for the KCIMF are taken directly from the Traffic Technical Report and are based on the BNSF High- Volume Shipper Survey and SmartPort Metro-Wide Inventory of Distribution Centers. The vast majority (86%) of the trucks are projected to travel along I-35 towards the KC metro area. Percentages Taken from Figure A-14 of Traffic Technical Report, May Environmental Assessment for Gardner Intermodal Facility (Based on Goods Movement Element of MARC's Transportation Outlook 2030 Update and the US Census 2002 Commodity Flow Survey Database) 2.0% 2.0% 0.2% 0.2% 2.1% 2.3% 83.7% 86.5% 2.0% 2.0% Figure 6.5: 2040 Intermodal Facility Truck Distribution 2040 Intermodal Facility Truck Distribution 7.0% 10.0% 2% 1% 2% 86% 2% XX% = Truck Distribution Percentage Percentages Taken from Figure A-10 of Traffic Technical Report, May 2006 for Gardner Intermodal Facility (Based on BNSF High-Volume Shipper Survey and SmartPort Metro-Wide Inventory of Distribution Centers) Warehouse / Distribution Centers - Truck activity from the LPKC was similarly assigned based on previous work from the Gardner Intermodal Facility Environmental document. The truck distribution percentages for the LPKC were also taken from the KCIMF s Traffic Technical Report and are based on the Goods Movement Element of MARC s Transportation Outlook 2030 and the US Census 2002 Commodity Flow Survey Database. As was the case for the KCIMF, the origins and destinations of trucks to and from the area Warehouse/Distribution Centers are projected to heavily utilize I-35, particularly to the northeast towards the KC metro area, as shown in Figure % 6-12
101 1,400 TRANSPORTATION Major Truck Routes Most roadways are designed to handle local truck deliveries and occasional heavier truck movements. However, the frequent movement of larger and heavier trucks that travel between industrial land uses and the interstate highway system requires exceptional standards to handle the weight and maneuvering space. It is not economical to apply these to all roads in the network. With limited resources available in the Southwest Johnson County area, it is important to develop a cost effective plan to provide safe and efficient freight movement for future area development. The major truck routes shown on the map at right provide direct travel from the intermodal and warehouse/distribution facilities identified in the land use plan, while minimizing conflicts with other land uses and modes of transportation. The truck volumes shown in Figure 6.7 represent the combined KCIMF, LPKC and other truck generators, based on the distribution assumptions previously established for the KCIMF and the associated warehouse and distribution center developments. These numbers also include through truck movements on I-35 traveling through the study area Truck Assignments - Preferred Alternative Figure 6.7: 2040 Truck Assignments - Preferred Land Use Plan 167th St. 175th St. 183rd St. 191st St. 199th St. 207th St. North Sunflower Rd ,100 U.S Four Corners Rd. 12,200 4,000 12,400 Homestead Ln ,400 Waverly Rd , Center St. Gardner Rd. 1, Main St. 15, Legend 10,000 1,900 15, ,000 20,000 Vehicles per Day KCIMF & LPKC 6-13
102 200 2, , ,900 9, ,000 2,400 3,100 2,100 TRANSPORTATION North 167th St. 175th St. 183rd St. 191st St. 199th St. 207th St. Total Traffic Assignment The travel demand model was applied to each of the land use scenarios presented in Part Four to determine their impact on the transportation network. A review of the traffic forecasts concluded that the Preferred Land Use Plan represented the highest trip generation and traffic forecasts, and thus provides the worst case condition for transportation network improvements. Total Traffic - Opening Day Figure 6.8: Opening Day Total Traffic, Preferred Land Use Plan 2,100 24,300 Sunflower Rd , ,100 2, U.S. 56 3, Four Corners Rd. 6,700 2,000 3,600 Homestead Ln. 1,400 1,200 35,100 7,600 2,500 2,900 2,700 Waverly Rd. 2, ,200 Center St. Gardner Rd. 15,900 3,300 1,500 Main St. 39, Legend 30,000 23,900 44,600 1,600 9,500 15,000 60,000 Vehicles per Day KCIMF & LPKC The manual truck traffic assignment for the 2040 Preferred Land Use Plan were added to the results of the travel demand model. This process was used to develop the Total Traffic forecasts for the three stages of development discussed in Part Five: Opening Day, the midway buildout for , and the full build-out condition in Opening Day The Opening Day condition for the Area Plan is defined as the beginning of KCIMF operations and completion of the warehouse and distribution centers currently under construction. This includes the following new developments, totalling about 850,000 square feet of space: DeLong Co. - 25,000 SF grain distribution DEMDACO - 326,650 SF distribution center Inland Port I - 500,250 SF distribution center The roadway network for Opening Day consists of the roadway segments on 191st Street and Homestead Lane, and the interchange with Homestead Land and I-35 that are scheduled for completion in Fall The results of combining the Opening Day model run with the initial Intermodal and Warehouse / Distribution Truck Trips and background traffic are illustrated in Figure 6.8. The model suggests a shift in traffic on U.S. 56 to 199th Street, which is a more direct route to I-35 at the new Homestead Lane interchange. The new four-lane Homestead Lane and heavy haul road on 191st Street will provide a direct connection for trucks to access the KCIMF. 6-14
103 ,000 13,900 2, ,750 5,300 6,400 3,900 TRANSPORTATION 2025 Midway Land Use An Interim 2025 forecast was also developed as a midrange development scenario. As described in Part Five, this scenario assumes an approximate buildout of about 65% of the warehousing and 50% of other uses projected for the full yield capacity of the Preferred Land Use Plan. This midway traffic forecast helps identify the infrastructure improvements necessary to accommodate that level of development. The analysis also assists in setting priorities and phasing infrastructure improvements during the course of this planning period. In addition, there is some possibility that one type of development will occur more rapidly than another. The interim picture helps evaluate that possibility. Consistent with the other traffic assignments, the traffic model trips were combined with the Intermodal and Warehouse/Distribution Truck trips projections for the Year 2025, with the resulting assignment shown in Figure 6.9. The estimated 65/50% build-out assumes that the LPKC would be fully developed and that other development would occur in the northern part of the warehouse district, together producing about million SF of the 16 million SF identified in the Preferred Land Use Plan. With the concentration of warehouse/distribution center development centered around the LPKC, the heaviest traffic volumes are anticipated to be along the route connecting to I-35. The anticipated daily traffic on 191st Street, between the KCIMF entrance and Waverly Road, is projected at about 12,000 vpd. The forecast volume of Homestead Lane between 191st Street to I-35 ranges from 16,200 vpd to 19,200 vpd. Smaller traffic volume increases are anticipated throughout the roadway network. Traffic volumes along the 199th Street corridor continue to grow, but can still be accommodated by a two-lane roadway through the Year Full development of the LPKC also results in traffic volume increases along Waverly Road, between 183rd Street and 191st Street to a level of 5,300 vpd. Figure 6.9: Midway 2025 Total Traffic, Preferred Land Use Plan 167th St. 175th St. 183rd St. 191st St. 199th St. 207th St. North 4,800 30,200 Sunflower Rd. 1,100 1,700 1,200 10,800 3,900 U.S. 56 8, ,150 Four Corners Rd. 16,200 1,800 3,000 19,200 Homestead Ln. 12,000 5,900 46,650 11,950 4,650 3,800 3,900 Waverly Rd. 5,600 3,200 6,000 Center St. Gardner Rd. 11,600 17,900 3,700 6,900 Main St. 56, Legend 30,000 28,000 65,950 14,050 6,900 15,000 60,000 Vehicles per Day KCIMF & LPKC 6-15
104 10,000 2,800 12, ,600 2,900 6,900 20,200 4,500 1,500 20,000 10,400 10,100 6,100 TRANSPORTATION 2040 Preferred Land Use Plan Figure 6.10 shows the results of combining the Year 2040 Preferred Scenario model run with the ultimate build-out Intermodal and Warehouse/Distribution Truck Trips. The new Homestead Lane interchange remains the focal point for truck trips to and from the KCIMF, LPKC, and other warehouse/distribution activity within the study area. This is reflected in the high traffic volume on Homestead 2040 Total Traffic - Preferred Alternative Figure 6.10: 2040 Total Traffic, Preferred Land Use Plan 167th St. 175th St. 183rd St. 191st St. 199th St. 207th St. North 35,900 Sunflower Rd. 4,300 4,300 16,100 7,500 5,700 4,900 U.S , ,400 Four Corners Rd. 23,500 6,000 31,600 Homestead Ln. 11,100 56,100 16,500 6,800 5,700 5,100 20,000 Waverly Rd. 10,900 6,300 11,100 Center St. Gardner Rd. 21,700 4,000 12,300 Main St. 72, Legend 30,000 36,000 84,900 18,800 12,300 15,000 60,000 Vehicles per Day KCIMF & LPKC Lane between 191st Street and 199th Street. The segment of 191st Street, from the KCIMF entrance between Four Corners Road and Waverly Road, is projected to carry 20,000 vehicles per day (vpd) in the Year The segment of Homestead Lane, from 191st Street to 199th Street is forecast to carry 31,600 vpd. Other vehicles, primarily area employees traveling to work from surrounding residential areas, tend to have distinct travel desire lines, primarily to and from the northeast. This is reflected by the growth in traffic along 183rd Street, 191st Street, and to a lesser extent Waverly Road. As described in the Land Use section of this plan, the highest growth in new dwelling units will be contiguous to Gardner. A significant increase in traffic volumes is also forecast for 199th Street, from U.S. 56 to the east, beyond I-35. With daily traffic volumes in the range of 11,000 to over 12,000 vpd, it is anticipated that this 199th Street corridor will require widening to a four-lane cross section by the Year The 5-County Regional Transportation Study included forecasts for a north/south arterial in western Johnson County. Figure 6.9 indicates this by showing the forecast volume from that study along Sunflower Road, from the intersection with U.S. 56 north beyond 167th Street. The land use associated with the potential redevelopment of the Sunflower Army Ammunition Plant was not included in this study s travel demand model, requiring this volume to be added manually. 6-16

105 9,800 3,400 13,400 12,400 3,500 6,800 18,900 4,800 3,000 18,900 12,400 8,500 6,100 TRANSPORTATION 2040 Scenario 4 Land Use Plan A traffic assignment was developed to test the Scenario 4 Land Use Plan described earlier in Part Four. While somewhat similar to the 2040 Preferred Land Use Plan, it differs substantially from the other scenarios by locating intense warehouse/distribution land uses north of U.S. 56 between Four Corners Road and 183rd Street. The road network for this scenario includes a grade separated crossing of Four Corners Road over the BNSF. The previous surface crossing and road segment between 191st Street and U.S. 56 were removed by the construction of the KCIMF. Figure 6.11 depicts the 2040 traffic assignment for the Scenario 4 Land Use. The projected traffic volumes near the intersection of Four Corners Road and U.S. 56 are naturally higher than the 2040 Preferred Land Use Plan results because of more intensive development on the north side of U.S. 56. With the direct connection from the KCIMF and the LPKC, traffic volumes on the Four Corners Road grade separation are projected to be 4,400 vpd. Volumes to the north on Four Corners Road also show some increase due to the reconnection of this north/south roadway link. Based on the results of this traffic forecast, the traffic volume of 4,400 vpd projected to use the Four Corners Road grade separation does not reach a level that would justify the significant cost to construct a grade separation at this location. However, the public right-of-way along this segment of Four Corners Road has been preserved for a future grade separation by Edgerton and Johnson County if conditions require. 167th St. 175th St. 183rd St. 191st St. 199th St. 207th St. North 2040 Total Traffic - Alternative 4 Figure 6.11: 2040 Total Traffic, Scenario 4 Land Use Grade Separation 7,000 35,900 Sunflower Rd. 4,300 4,300 17,300 5,700 7,200 U.S , ,000 4,700 Four Corners Rd. 23,600 31,600 Homestead Ln. 4,400 7,500 19,500 9,400 54,700 19,400 7,400 9,200 7,200 Waverly Rd. 13,200 7,600 9,400 Center St. Gardner Rd. 22,100 4,000 12,400 Main St. 75, Legend 30,000 34,500 84,900 18,400 12,400 15,000 60,000 Vehicles per Day KCIMF & LPKC 6-17
106 TRANSPORTATION 6-18 Traffic Operational Analyses The traffic forecasts developed for the street network for the various land use scenarios were reviewed to determine the level of traffic, impacts on the roadway network, and compatibility with the proposed land use. The project team selected 15 key intersections in the study area for analyses, labeled on the traffic analysis figures: th Street / Sunflower Road with U.S th Street with Homestead Lane 3. Homestead Lane with I-35 Southwest Bound Ramp 4. Homestead Lane with I-35 Northeast Bound Ramp 5. Gardner Road with I-35 Northeast Bound Ramp 6. Gardner Road with I-35 Southwest Bound Ramp 7. Gardner Road with 191st Street 8. Waverly Road with 191st Street 9. Waverly Road with 183rd Street 10. U.S. 56 with Waverly Road 11. U.S. 56 with Poplar Street / West Santa Fe St. 12. U.S. 56 with Center Street 13. Homestead Lane with 191st Street 14. Sunflower Road with I-35 Southwest Bound Ramp 15. Sunflower Road with I-35 Northeast Bound Ramp The traffic operational analyses were completed for the following conditions: 2013 Opening Day weekday morning and evening peak hours 2025 Midway Land Use Plan weekday morning and evening peak hours 2040 Full Buildout Preferred Land Use Plan weekday morning and evening peak hours Peak Hour Turning Movement Estimates As discussed in the previous section, daily traffic volumes were developed for each of the land use scenarios. Figures 6.12, 6.13, and 6.14 show the estimated average daily traffic (ADT) for the 2013 Opening Day, 2025 Midway Preferred Land Use Plan, and 2040 Preferred Land Use Plan land use scenarios. Peak hour turning movements for each for the 15 study intersections were also developed for capacity analyses using guidelines documented in NCHRP Report 255. In general, peak hour traffic volumes were assumed to be between 7% and 10% of the ADT. The peak hour turning movements were based upon the ADT estimates for each scenario, historic ADT counts, historic turning movement counts, and traffic studies for the BNSF intermodal facility and the proposed Homestead Lane interchange. The estimated peak hour turning movements can be found in the Appendix within the capacity analyses worksheets. Traffic Signal Warrant Evaluation The Manual of Uniform Traffic Control Devices (MUTCD) traffic signalization warrants 1 and 2 were evaluated at each of the unsignalized study intersections for the 2025 Preferred Plan and 2040 Land Use Plan analysis scenarios. The study area intersections were classified as rural if posted speeds on the major street were over 40 MPH and urban if posted speeds were 40 MPH or below. Per guidance in the MUTCD, 100% right-turn reductions were applied at locations where free right-turn lanes are provided (westbound U.S. 56 at Santa Fe Trail/ Poplar Street for both scenarios, and the Southwest bound I-35 off-ramp at Gardner Road in 2040) when evaluating the warrants.
107 TRANSPORTATION 2025 Midway Land Use Plan A review of the unsignalized study intersections indicated that the 2025 Preferred Land Use Plan traffic volumes satisfied MUTCD traffic signalization warrants at the following locations: th Street / Sunflower Road with U.S Gardner Road with I-35 Southwest Bound Ramps 7. Gardner Road with 191st Street 8. Waverly Road with 191st Street 11. U.S. 56 with Poplar Street / Santa Fe Street MUTCD signal warrant worksheets for 2025 Preferred Land Use Plan traffic conditions are included in the Appendix Preferred Land Use Plan A review of the unsignalized study intersections indicated that the 2040 Preferred Land Use Plan traffic volumes satisfied MUTCD traffic signalization warrants at the following locations: th Street / Sunflower Road with U.S Gardner Road with I-35 Northeast Bound Ramps 6. Gardner Road with I-35 Southeast Bound Ramps 7. Gardner Road with 191st Street 8. Waverly Road with 191st Street 10. U.S. 56 with Waverly Road 11. U.S. 56 with Poplar Street / Santa Fe Street should be monitored to determine the appropriate timing of signal installation. Traffic Operations Analysis Methodology Traffic operations were analyzed for the study intersections using procedures documented in the Highway Capacity Manual, Transportation Research Board, From the analyses, a key measure or level of service rating of the traffic operational condition was obtained. In general, level of service (LOS) is a qualitative assessment of traffic operational conditions within a traffic stream in terms of the average stopped delay per vehicle at a controlled intersection. Levels of service are described by a letter designation of either A, B, C, D, E or F, with LOS A representing essentially uninterrupted flow, and LOS F representing a breakdown of traffic flow with noticeable congestion and delay. Unsignalized, or stop sign controlled, intersection capacity analyses produce LOS results, designated by a, b, c, d, e or f, for each movement which must yield to conflicting traffic at the intersection. Table 6.4 summarizes LOS criteria for intersections. MUTCD signal warrant worksheets for 2040 Preferred Land Use Plan traffic conditions are included in the Appendix. It should be noted that although the forecast indicates satisfaction of MUTCD signal warrants, this does not dictate installation of a traffic signal. Traffic operations 6-19
108 TRANSPORTATION 6-20 Table 6.4: Level of Service (LOS) Criteria Level of Service Average Control Delay per Vehicle (sec/veh) Signalized Intersections The Synchro traffic analysis software program was utilized to analyze traffic operations at the study intersections. Proposed Roadway Network Geometry Stop Sign / Roundabout Controlled Intersections A B > 10 to 20 > 10 to 15 C > 20 to 35 > 15 to 25 D > 35 to 55 > 25 to 35 E > 55 to 80 > 35 to 50 F > 80 > Opening Day The 2013 Opening Day land use scenario represents the Existing and Committed roadway network, which includes the following lane arrangements and traffic control at each of the study intersections: th Street/Sunflower Road with U.S. 56 Stop control on Sunflower Road and 199th Street approaches Single shared lanes for all turning movements on all four approaches Advance warning flashers and signing on U.S th Street with Homestead Lane Traffic signal Two-through lanes on Homestead Lane with exclusive leftturn and right-turn lanes on both approaches Exclusive left-turn lane, exclusive through lane, and exclusive right-turn lane on the eastbound 199th Street approach Exclusive left-turn lane, and shared through / right-turn lane on the westbound 199th Street approach 3. Homestead Lane with I-35 Southwest Bound Ramps Diverging diamond interchange with traffic signal T wo through lanes on northbound and southbound Homestead Lane approaches 4. Homestead Lane with I-35 Northeast Bound Ramps Diverging diamond interchange with traffic signal Two through lanes on northbound Homestead Lane approaches One through lane on southbound Homestead Lane approaches 5. Gardner Road with I-35 Northeast Bound Ramps Stop control on I-35 off-ramp approach Single shared lanes for all turning movements on all three approaches 6. Gardner Road with I-35 Southwest Bound Ramps Stop control on I-35 southwest bound ramp approach Single shared lanes for all turning movements on northbound Gardner Road and I-35 off-ramp approaches Exclusive right-turn lane on southbound Gardner Road approach 7. Gardner Road with 191st Street Stop control on eastbound 191st Street approach Single shared lane for all turning movements on eastbound approach Two through lanes with shared left-turn lane on northbound Gardner Road approach

109 TRANSPORTATION T wo through lanes with shared right-turn lane on southbound Gardner Road approach 8. Waverly Road with 191st Street Stop control on northbound and southbound Waverly Road approaches Single shared lane for all turning movements on northbound and southbound approaches Exclusive left-turn lane and shared through / right-turn lane on eastbound and westbound approaches 9. Waverly Road with 183rd Street Stop control on westbound 183rd Street approach Single shared lane for all turning movements on all three approaches 10. U.S. 56 with Waverly Road Stop control on northbound and southbound Waverly Road approaches Single shared lane for all turning movements on all approaches 12. U.S. 56 with Center Street Traffic signal Two through lanes, with exclusive left-turn lanes on both approaches on U.S. 56 Westbound approach has exclusive right-turn lane Exclusive left-turn lane, exclusive through lane, and exclusive right-turn lane on northbound and southbound approaches 13. Homestead Lane with 191st Street Traffic signal Exclusive left-turn lane, exclusive through lane, and exclusive right-turn lane on northbound approach Two through lanes, with exclusive left-turn lane on southbound approach Exclusive left-turn lane, exclusive through lane, and exclusive right-turn lane on eastbound and westbound 191st Street approaches 11. U.S. 56 with Poplar Street/Santa Fe Street Irregular intersection geometry with three separate intersections due to diagonal Stop control on northbound Poplar Street Stop control on and eastbound / westbound Santa Fe Trail connector road Two through lanes on U.S. 56 with shared left-turn lane on eastbound approach and shared right-turn lane on westbound approach Single shared lane for all turning movements on northbound Poplar Street and southbound connector road 6-21
110 TRANSPORTATION Figure 6.12: 2013 Levels of Service - Opening Day Land Use 167th St. 175th St. Sunflower Rd. Four Corners Rd. b/b c/b a/a a/a a/a b/b a/a Center St. B/B Main St rd St. B/B a/a b/b a/a a/a 35 b/b a/a 9 b/b a/a 7 b/c 191st St. 199th St. a/a a/a b/a d/d 1 U.S f/c a/a a/a 207th St. North b/a a/a a/a B/B B/B 3 Homestead Ln. 4 Waverly Rd. A/A a/a b/b Gardner Rd. b/b a/a Legend X/X x/x = AM/PM Peak Hour Signalized Intersection Level of Service = AM/PM Peak Hour Unsignalized Intersection Level of Service = Stop Sign = Traffic Signal KCIMF & LPKC hnson Area Plan - Opening Day (September Updates), , 9/13/
111 TRANSPORTATION Figure 6.12 shows the lane geometry, traffic control, and levels of service for 2013 Opening Day traffic conditions. All of the signalized intersections would be expected to operate at LOS B or better in both peak periods in All critical movements are expected to operate at LOS C or better in both peak periods with two exceptions: The 199th Street approach at the intersection of 199th Street with U.S. 56 is expected to operate at LOS D in both peak periods. At the Northeast Bound I-35 ramps with Gardner Road, the off-ramp approach is expected to operate at LOS F in the AM peak period. Capacity analysis worksheets for 2013 Opening Day traffic conditions are included in the Appendix Midway Land Use Plan In addition to the 2013 Existing and Committed lane geometry, the following improvements are recommended for the 2025 Preferred Alternative scenario. These improvements were incorporated in the capacity analyses th Street/Sunflower Road with U.S. 56 Install traffic signal at the intersection Widen U.S. 56 to provide eastbound and westbound left turn lanes Provide exclusive left-turn lanes on all approaches Provide exclusive right-turn lane on the eastbound U.S. 56 approach 5. Gardner Road with I-35 Northeast Bound Ramps Replace roadway/bridge between I-35 ramp terminals to a five lane cross section Provide an exclusive left-turn lane on southbound approach Provide an exclusive right-turn lane on northeast bound approach 6. Gardner Road with I-35 Southwest Bound Ramps Widen roadway and bridge between I-35 ramp terminals to a five-lane cross section Provide an exclusive left-turn lane on northbound approach Provide an exclusive right-turn lane on westbound approach 7. Gardner Road with 191st Street Relocate the intersection north Provide separate eastbound left-turn and right-turn lanes 8. Waverly Road with 191st Street Install traffic signal at the intersection Provide exclusive left-turn lanes on northbound and southbound approaches Provide exclusive right-turn lane on southbound approach 10. U.S. 56 with Waverly Road Exclusive left-turn lanes should be provided on the eastbound and westbound U.S. 56 approaches 6-23
112 a/a b/a TRANSPORTATION Figure 6.13: 2025 Levels Midway of Service, Land Use Plan Use Levels of Service 167th St. 175th St. Sunflower Rd. Four Corners Rd. c/b c/c a/a a/a a/a b/b a/a Center St. B/B Main St. 183rd St. B/B a/a c/c a/a b/b 191st St. 199th St. A/B B/B U.S A/A A/A d/d b/b f/d a/a a/a Legend a/a a/a c/d 207th St. North c/b a/a a/b b/b with 2 lane W. 199th St. B/B Homestead Ln. 4 Waverly Rd. Gardner Rd. X/X x/x = AM/PM Peak Hour Signalized Intersection Level of Service = AM/PM Peak Hour Unsignaliz Intersection Level of Service = Stop Sign = Traffic Signal KCIMF & LPKC 6-24
113 TRANSPORTATION Figure 6.13 displays the lane geometry, traffic control, and levels of service for 2025 Preferred Land Use Plan traffic conditions. All of the signalized intersections would be expected to operate at LOS B or better in both peak periods in All critical movements are expected to operate at LOS D or better in both peak periods with one exception: 6. Gardner Road with I-35 Southwest Bound Ramps Install traffic signal at the intersection 7. Gardner Road with 191st Street Install traffic signal at the relocated intersection Provide exclusive left-turn lane on northbound approach At the Northeast bound I-35 ramps with Gardner Road, the off-ramp approach is expected to operate at LOS F in the AM peak period. However, the approach volume is relatively low (85 vehicles per hour), and the expected queue length is 195 feet. Capacity analysis worksheets for 2025 Preferred Alternative traffic conditions are included in the Appendix Preferred Land Use Plan In addition to the improvements for 2025 Preferred Land Use Plan, the following improvements are recommended for the 2040 Preferred Alternative scenario as shown in Figure U.S. 56 with Waverly Road Install traffic signal at the intersection Provide exclusive left-turn lanes on northbound and southbound approaches 11. U.S. 56 with Poplar Street/Santa Fe Street Install traffic signal or roundabout at the intersection Provide exclusive eastbound left-turn lane on U.S Homestead Lane with 191st Street Provide dual left-turn lanes on westbound approach th Street with Homestead Lane Widen 199th Street to four through lanes with exclusive left-turn lanes on both approaches Provide exclusive right-turn lane on eastbound 199th Street approach Provide shared through / right-turn outside lane on westbound 199th Street approach 5. Gardner Road with I-35 Northeast Bound Ramps Install traffic signal at the intersection 6-25
114 a/a TRANSPORTATION 2040 Preferred Alternative Levels of Service Figure 6.14: 2040 Preferred Land Use Plan 167th St. 175th St. Sunflower Rd. Four Corners Rd. a/b B/B c/c b/a Center St. B/B Main St. 183rd St. D/C A/A 10 a/a d/d B/B 35 B/B st St. 199th St. U.S. 56 C/B A/B C/C B/A B/B Legend 207th St. North d/c a/a b/b c/c with 4 lane W. 199th St. B/C Homestead Ln. 4 Waverly Rd. Gardner Rd. X/X x/x = AM/PM Peak Hour Signalized Intersection Level of Service = AM/PM Peak Hour Unsignalized Intersection Level of Service = Stop Sign = Traffic Signal KCIMF & LPKC 6-26
115 TRANSPORTATION Figure 6.14 shows the lane geometry, traffic control, and levels of service for 2040 Preferred Alternative traffic conditions. All signalized intersections are expected to operate at LOS D or better in both peak periods in All critical movements are expected to operate at LOS D or better in both peak periods. Capacity analysis worksheets for the 2040 Preferred Alternative traffic conditions are included in the Appendix. Queue Length Summary An evaluation of queue lengths was performed at each of the study intersections along U.S. 56 and at the I-35 Gardner Road interchange for the 2013 opening day, 2025 interim and 2040 preferred traffic conditions. Intersections analyzed included: 1. U.S. 56 with 199 th Street/Sunflower Road 5. Gardner Road with I-35 NEB Ramps 6. Gardner Road with I-35 SWB Ramps 7. Gardner Road with 191 st Street 10. U.S. 56 with Waverly Road 11. U.S. 56 with Santa Fe Street/Poplar Street 12. U.S. 56 with Center Street Synchro modeling software was used to estimate the 95 th percentile queue lengths for the study intersections. The model is based upon procedures documented in the Highway Capacity Manual (HCM). The figure associated with each scenario to determine lane configuration and traffic control used for the analysis: 2013 Opening Day Figure Midway Land Use Plan Figure Preferred Land Use Plan Figure 6.14 Table 6.5 summarizes the queue length analysis for each intersection by scenario. The notation N/A in the table indicates either that a turn-lane is not present or that the movement is free-flowing for that scenario. Because of its proximity to the BNSF mainline crossing, traffic queues at the U.S. 56 intersection with 199th Street/ Sunflower Road were evaluated under two different conditions. The first condition evaluates queuing under normal daily operations at the intersection, and the second evaluates queuing with a train occupying the adjacent crossing. For normal daily operations, the expected 95 th percentile queue lengths according to Synchro are shown in Table 6.5 for the U.S. 56 with 199 th Street/Sunflower Road (with Normal Operations). The BNSF mainline tracks parallel U.S. 56 to the southeast, approximately 175 feet from the intersection. In order to estimate queue lengths when a train is occupying the adjacent crossing, the Synchro software was also used. Assumptions were made regarding the length of time the crossing could be blocked by a train, and engineering judgment was used to establish a methodology for determining resultant queue lengths on U.S. 56. The methodology first determined the traffic queues associated with the 199 th Street crossing being blocked by a train. A queue was estimated for eastbound 199 th Street by assuming the road would be blocked by a train for an average of 2.25 minutes (135 seconds). 150 feet of that queue was assumed to remain on 199 th Street between U.S. 56 and the railroad crossing. The remaining queue was distributed onto the eastbound left-turn and westbound right-turn lanes on U.S. 56 based on the split 6-27


116 TRANSPORTATION Table 6.5: 95% Queue Length Summary with Normal Operation AM / PM Peak Hour Intersection No. 1 1 Location U.S. 56 with 199th Street/Sunflower Road (with Normal Operations) U.S. 56 with 199th Street/Sunflower Road (with Train Present) Critical Movement 2013 Opening Day 95% Queue Length (ft) 2025 Interim 2040 Preferred EB Right-Turn N/A 25/25 65/80 WB Left-Turn N/A 45/50 70/80 EB Right-Turn 260/ / /285 WB Left-Turn 60/55 125/ /105 5 Gardner Road with I-35 NEB Ramp SB Left-Turn N/A 55/25 495/305 NEB Left-Turn 195/40 125/80 25/25** NEB Right-Turn 25/25 25/25 6 Gardner Road with I-35 SWB Ramp NB Left-Turn N/A 25/25 45/50 SWB Left-Turn 25/140 80/180 75/175** SWB Right-Turn N/A N/A 199th Street at BNSF railroad crossing 7 Gardner Road with 191st Street NB Left-Turn N/A N/A 120/130 EB Left-Turn 25/30 130/135 25/25*** EB Right-Turn 25/25 65/50 10 U.S. 56 with Waverly Road EB Left-Turn N/A 25/25 25/25 WB Left-Turn N/A 25/25 30/30 11 U.S. 56 with Santa Fe Street/Poplar Street EB Left-Turn N/A N/A 25/25 WB Through/Right N/A N/A 50/80 EB Left-Turn 25/25 35/25 40/40 12 U.S. 56 with Center Street WB Left-Turn 25/100 80/110 95/100 WB Right-Turn 25/35 30/30 25/25 Gardner Road at the interchange with I

117 TRANSPORTATION of traffic volumes. The estimated 95 th percentile queue lengths according to Synchro when a train is blocking the adjacent railroad crossing are shown in Table 6.5 under U.S. 56 with 199 th Street/Sunflower Road (with Train Present). In order to provide enough turn lane storage on U.S. 56 to prevent traffic queues from backing up into the through lanes, a minimum westbound left turn storage length of 150 feet and a minimum eastbound right turn storage length of 320 feet should be provided. While this methodology provides a good indication of turn length requirements, a micro-simulation model should be used to provide more accurate modeling of this intersection and a better understanding of the effects of the railroad crossing on queuing before designing intersection improvements. Railroad preemption should be provided at the intersection of U.S. 56 with 199 th Street/ Sunflower Road when a traffic signal is warranted and installed. path. Based on the results of the queue analysis for the interchange, a minimum required storage length of 500 feet should be provided for the southbound left-turn lane and a minimum storage length of 150 feet for the northbound left-turn lane. Assuming a 150 foot transition taper between the northbound and southbound turn lanes, adequate distance is provided between the Gardner Road ramp terminals with the current diamond interchange configuration. Locations 10, 11 and 12 The intersections along U.S. 56 within the City Limits of Gardner were also evaluated to determine if adequate storage to accommodate future traffic volumes is provided. All of these locations show no significant queue impacts. Locations 5, 6 and 7 Another area of specific concern is the I-35 interchange with Gardner Road. Queuing at this location was evaluated to determine if adequate spacing would be provided between the existing ramp terminals. Currently, Gardner Road provides a two-lane cross section and the interchange ramp terminals are approximately 925 feet apart. As previously mentioned, the bridge over I-35 should be replaced with a five-lane cross section with separate northbound and southbound left-turn lanes, and consideration of a separated pedestrian/bicycle 199th Street /U.S. 56/ Sunflower Road intersection 6-29
118 TRANSPORTATION 6-30 U.S. 56/199th Street/Sunflower Road Intersection Construction of the KCIMF and LPKC eliminates several east/west roadways that connected to U.S. 56. These include 183rd Street between Waverly Road and U.S. 56, and 191st Street between Four Corners Road and U.S. 56. As a result, 199th Street, one and two miles south of 191st and 183rd Streets respectively, is the only remaining continuous east/west roadway in southern Johnson County. The lack of east/west continuity and the anticipated development associated with the intermodal facility, will place substantial pressure on 199th Street, and particularly on the intersection U.S. 56 and Sunflower Road. With the construction of the Homestead Lane interchange with I-35, traffic normally traveling on U.S. 56 through Gardner now can use 199th Street and Homestead Lane to access the interstate. The traffic forecasting discussion showed that many more vehicles will be routed along 199th Street and through its intersection with U.S. 56. Improvements to geometrics, sight distance, and capacity will be necessary to accommodate this additional traffic, requiring reconstruction of this intersection. Only one lane of traffic is currently provided on all approaches. Sunflower Road approaches the intersection from the north at an alignment that is not perpendicular to U.S. 56. Traffic on 199th Street and Sunflower Road is stop sign controlled. The BNSF railroad tracks cross 199th Street within 175 feet of the intersection and are approximately 3 to 4 feet higher in elevation than the intersection. Due to the vertical curve on U.S. 56 to the northeast, sight distance is limited to approximately 375 feet, which relates to a design speed of approximately 45 mph. For vehicles approaching from the southeast on 199th Street turning left on to U.S. 56 or traveling north to Sunflower Road, sight distance is restricted. For vehicles approaching from the east, the intersection offers limited sight distance and insufficient stopping sight distance if a vehicle is waiting to turn left onto 199th Street. Opening Day Improvements For opening day improvements, advanced warning signs with flashers will be installed on the eastbound and westbound approaches of U.S. 56 to alert drivers about the upcoming intersection. These safety improvements are scheduled for installation by KDOT in the Fall of Interim Improvements The U.S. 56 Corridor Management Plan identified an interchange concept that would replace the at-grade crossing and intersection with a grade separation over the BNSF Railway tracks and U.S. 56. However, the construction costs and environmental impacts for this improvement are high and are likely to set consideration of the grade separation back to the long-term future. In the meantime, increased traffic volumes and turning movements at this intersection will require an interim solution that still maintains an at-grade intersection and an atgrade crossing of the BNSF Railway tracks. Operational concerns caused by the proximity of the at-grade railroad crossing on the 199th Street approach compound the intersection s geometric issues. The traffic operations and queuing analysis for this intersection showed that traffic on U.S. 56 turning east on 199th Street will be inhibited when a train is traveling through the

119 TRANSPORTATION crossing. Currently, without turn lanes or traffic control provided on the U.S. 56 approaches to the intersection, traffic would back up into the highway s through lanes waiting for the train to clear the crossing and the traffic queue on 199th Street to dissipate. Another operational and exposure concern is that north-westbound traffic on 199th Street waiting to turn onto U.S. 56 or continue to the north on Sunflower Road, may not be able to clear the crossing when a train approaches. The proposed improvements, shown in Figure 6.15, consist of: Widening U.S. 56 to provide eastbound and westbound left turn lanes, and building an eastbound right turn lane to accommodate the heavy turning movement onto 199th Street. Rebuilding the Sunflower Road approach to U.S. 56 to provide a more perpendicular intersection, with widening to provide a separate southbound left turn lane. Widening the 199th Street approach to the intersection to a four-lane section, providing a separate westbound left turn lane would be provided and a shared through/right turn lane at the intersection. In addition to the lane configuration improvements recommended at the intersection, traffic signalization should include pre-emption with the railroad crossing signal system. Although traditional traffic signal warrants based on volumes may not be met at the intersection, the installation of a traffic signal with pre-emption would permit the eastbound traffic queues on 199th Street to clear, minimizing the possibility of vehicles getting stranded on the crossing (under Warrant #9 of the MUTCD). It would also include LED signing to prevent vehicles on U.S. 56 from turning to the east onto 199th Street when a train is occupying the crossing. A queuing analysis, which included train delay impacts, was used to determine the required turn storage lengths on U.S. 56 to prevent traffic queues from extending into the through lanes. Reconstruction and regrading of U.S. 56 northeast of this intersection is necessary to improve sight distance and to meet current design criteria. This will require approximately 2,800 feet of reconstruction since some of the vertical curves will Figure 6.15: Proposed Interim Improvements at U.S. 56 / 199th Street / Sunflower Road 6-31
120 TRANSPORTATION require adjustments up to 8 to 12 feet. A proposed profile for this segment of U.S. 56 is shown in the Appendix. With this profile, the elevation at the intersection would remain nearly constant. Due to the minimum 23.5 feet of vehicle clearance required for a grade separation over the BNSF tracks, the amount of clearance provided over U.S. 56 would exceed the 16.5 feet of clearance required. As a result, it appears that these profile improvements on U.S. 56 would also work for the grade separated concept. The construction cost estimate for these interim improvements at the intersection is approximately $5.0 million. Based on the importance of this intersection to the transportation system in this area and the lack of alternative east/west routes, traffic interruption should be minimized during construction. Staged construction, the use of a shoo-fly detour and a signed alternate detour route should be considered to keep 199th Street open to traffic as much as possible. The traffic operations analysis for this intersection indicates that with these improvements, the intersection will operate at LOS B with 2040 traffic volumes. However, the traffic growth on 199th Street coupled with the anticipated growth in train traffic on the BNSF Railway, indicate that a grade separation may still be necessary in the long term. Ultimate Configuration The U.S. 56 Corridor Management Plan proposed a grade separation concept to replace the current at-grade crossing with the BNSF Railway at the 199th/Sunflower location. Exploration of alternative concepts confirmed that this concept provided the most efficient configuration to accommodate projected 2040 traffic volumes. According to BNSF Railway, the volume of trains on this section of mainline is anticipated to increase to 140 trains per day by 2025, nearly the capacity of the two mainlines. In addition, the number of trains entering the KCIMF by 2025 will grow to approximately 30 per day. The grade separation and interchange concept, shown in Figure 6.16, would span both the BNSF Railway tracks and U.S. 56. A loop ramp is provided in the northeast quadrant of the interchange to provide the direct connection from westbound 199th Street and from southbound Sunflower Road to U.S. 56. A flyover direct ramp would accommodate the eastbound U.S. 56 to eastbound 199th Street right turn movement. The blue shaded areas on the figure indicate the limits of the flood plain and floodway for Martin Creek. Much of U.S. 56 west of the intersecting 199th/Sunflower roadways is located in the flood plain, which would in turn be affected by construction. The plan and profile for this grade separation concept is provided in the Appendix. As mentioned earlier, the profile grade improvements on U.S. 56 used in the interim program will also work with this grade separation concept. These improvements present a number of challenges, including floodplain issues, construction complexities, and the necessity to keep 199th Street open during construction through the use of shooflys and temporary measures. A preliminary construction estimate for this concept suggests a cost of about of $21.5 million. 6-32

121 TRANSPORTATION Figure 6.16: Grade Separated Concept for U.S. 56 / 199th Street / Sunflower Road 6-33

122 TRANSPORTATION 199th Street Improvements As discussed above, the 199th Street corridor is one of the few continuous east/west roadway segments through southern Johnson County. This regional role, combined with probable development activity associated with the KCIMF and LPKC, help produce 2040 traffic forecasts of 11,000 vpd to over 12,000 vpd through the study area. At these volumes, 199th Street will require a four-lane section by The peak hour analysis performed at the intersection of 199th Street with Homestead Lane will also require a four-lane section on 199th Street in order to provide acceptable levels of service. In the short-term, Johnson County has programmed the construction of shoulders on the existing two-lane 199th Street, from U.S. 56 to the Spoon Creek bridge, approximately one mile to the east. Project construction is scheduled for A second westbound lane on 199th Street should be added as part of the interim improvements to the intersection of 199th Street with U.S. 56 discussed in the last section. This additional westbound lane would serve as an extended left turn lane at the intersection, beginning east of the BNSF Railway crossing. This would provide left turn storage on the east side of the crossing, and allow two lanes for vehicular queuing when trains are occupying the crossing. By 2040, with or without the grade separation, traffic volumes on 199th Street east of U.S. 56 will warrant consideration of a four-lane section. If there is the potential of designating 199th Street as U.S. 56, any widening should be constructed according to KDOT design standards. Both KDOT and the Johnson County CARNP (Type III) identify a four-lane rural cross section with a 28-foot wide median. This median width allows adequate room to accommodate dual left turn lanes at major intersections, if necessary. Increased traffic and widening of 199th Street raises significant concerns about impact to Mildale Farm and the future Big Bull Creek Park. Johnson County GIS records Figure 6.17: Suggested Four-Lane Typical Section for 199 th Street near Mildale Farm 6-34

123 TRANSPORTATION indicate that only 40 feet of right-of-way is provided along the section of 199th Street from the BNSF Railway mainline crossing to the recently removed BNSF crossing to the east. The design of a four-lane roadway through this sensitive area must be compatible with the context of the park and Mildale Farm. Figures 6.17 and 6.18 illustrate examples of a typical section with elements to accommodate drainage and provide a parkway environment for this segment of 199th Street. Through the Mildale Farm area, the street should be widened to the south, holding the north pavement line of 199th Street in its present location. Drainage issues between the roadway and the abandoned BNSF tracks to the south may present difficulties. Close coordination with the Johnson County Park & Recreation District (JCPRD) and the BNSF will be required in order to develop a four-lane configuration that is acceptable, attractive, minimizes impact on the park property, and complements the park environment. Figure 6.18: Perspective View of Four-Lane Cross Section Proposed for 199 th Street The typical sections also show construction of a multiuse pathway on the abandoned BNSF alignment on the south side of 199th Street. Information provided by the JCPRD indicates that the railroad retains ownership of the segment from the crossing with Nelson Street in Edgerton to the recently removed crossing with 199th Street, east of Mildale Farm. Building the trail along this segment of the railroad abandonment will require outright purchase of the property or an easement agreement to construct and maintain the trail. The role of this trail is explored further in Part Seven. Due to the limited right-of-way through the Big Bull Creek Park and Mildale Farm, it is possible that a 4(f) evaluation will be required to identify and mitigate any impacts associated with widening 199th Street and the possible construction of the grade separation over the BNSF tracks. 6-35
124 TRANSPORTATION Design Standards The various roadways within the Area Plan were broken into segments with similar characteristics and listed in Tables 6.6 (east-west) and 6.7 (north-south). The functional classification of the roadway, alignment and continuity within the region, and future traffic forecasts are defining factors for different types of collector or arterial roadway. The CARNP type roadway refers to the descriptions found in current CARNP which was used as the base line. Specific edits and revisions to the CARNP are contained in the Appendix. The various design standards generally follow CARNP except where KDOT standards supersede. These standards should be applied uniformly to each roadway segment regardless of the agency jurisdiction of enforcement at the time of development. Consistency is Table 6.6: East-West Roadways Street Segment 175th Street Sunflower Road to Waverly Road State Functional Classification Major Rural Collector Proposed CARNP Type Highest 2040 ADT ROW Width Future Lanes Lane Width Median Width Driveway Spacing Median Break/ Street Spacing Type II 6, ' 2 12' NA 660' 1/4 mile 183rd Street Sunflower Road to U.S. 56 Local Local ' 2 11' NA 200' N/A 183rd Street Waverly Road to 1/2 mile east Local Local 10, ' 2 11' NA 200' N/A 191st Street Sunflower Road to U.S. 56 Local Local ' 2 11' NA 200' N/A 191st Street Four Corners to Waverly Road Local Type II 20, ' 4 12' 16' 660' 1/4 mile 191st Street Waverly Road to Gardner Road Local Local 6, ' 2 11' NA 200' N/A U.S. 56 Highway 199th Street 199th Street Nelson Street Sunflower Road to Waverly Road U.S. 56 to Homestead Lane Homestead Lane to 1/2 mile east of Gardner Road BNSF to Sunflower Road Minor Arterial Rural Major Collector Rural Major Collector Urban Collector N/A 5, ' 3 12' NA 570' N/A Type II 11, or 4 12' 28' 1000' 1/2 mile Type III 11, '-200' 4 12' 28' 1000' 1/2 mile NA 7, ' 2 12' NA 200' N/A 207th Street Edgerton to Sunflower Road Local Type II ' 2 12' NA 660' 1/4 mile 207th Street 215th Street Homestead to 1/2 mile east of Gardner Road 1/2 mile west of Sunflower Road to 1/2 mile east of Gardner Road Local Local ' 2 11' NA 200' N/A Local Local ' 2 11' NA 200' N/A 6-36
125 TRANSPORTATION critical in order to provide a level playing field between competing and neighboring developments. The access spacing criteria is discussed in greater detail in the Access Management section of the plan. The segment of Sunflower Road, from U.S. 56 north to 175 th Street, listed in Table 6.7, is shown as a two-lane roadway based on the 2040 traffic volume projections provided in the 5-County Regional Transportation Study. However, that study identified the need for a four-lane north/south arterial from the intersection of Sunflower Road with U.S. 56/199 th Street to the north. Johnson County indicates that adequate right-of-way exists for a future widening, should the need emerge. The CARNP designation would remain as a Type I roadway. Table 6.7: North-South Roadways Street Edgerton Road Sunflower Road Sunflower Road Sunflower Road Four Corners Road Four Corners Road Four Corners Road Homestead Lane Homestead Lane Waverly Road Waverly Road Waverly Road Gardner Road Gardner Road Segment I-35 to 175th Street 215th Street to I-35 I-35 to Nelson Street State Functional Classification Rural Major Collector Rural Major Collector Urban Collector Proposed CARNP Type Highest 2040 ADT ROW Width Future Lanes Lane Width Median Width Driveway Spacing Median Break/ Street Spacing Type III '-200' 4 12' 28' 1000' 1/2 mile Type II 5, ' 2 12' NA 660' 1/4 mile Type II 7, ' 2 12' NA 660' 1/4 mile U.S. 56 to 175th Street Local Type I 5, ' 2 12' NA 400' 1000' 199th Street to 191st Street 191st Street to U.S. 56 U.S. 56 to 175th Street Rural Major Collector Rural Major Collector Rural Major Collector Type II 6, ' 2 12' NA 660' 1/4 mile Reserved for Potential Grade Separation N/A 120' 2 NA 1000' 1/2 mile Type II 1, ' 2 12' NA 660' 1/4 mile 207th Street to I-35 Local Type II ' NA 660' 1/4 mile I-35 to 191st Street Minor Arterial Type III 31, '-200' 4 12' 28' 1000' 1/2 mile 207th Street to 199th Street Local Local ' 2 11' NA 200' N/A Dead-End S/O 191st Street to U.S. 56 U.S. 56 to 175th Street 215th Street to I-35 Local Type II 10, ' 2 12' NA 660' 1/4 mile Urban Collector Rural Major Collector Local ' 2 11' NA 200' N/A Type II 10, ' 2 12' NA 660' 1/4 mile I-35 to 191st Street Minor Arterial Type II 20, ' 4 12' 28' 660' 1/4 mile 6-37
126 TRANSPORTATION U.S. 56 Highway Introduction This section discusses U.S. 56 Highway in Johnson County, between Edgerton (Sunflower Road) and Interstate 35 on the east side of Gardner, Kansas. The opening of the KCIMF and surrounding development requires a new evaluation of the characteristics and nature of this road. One consideration is the configuration and geometry needed to serve projected new development. The other discussion is the nature of U.S. 56 in the regional roadway network with the addition of the Homestead Lane interchange. Traffic that previously used U.S. 56 from Edgerton to Gardner may now access Interstate 35 via 199th Street and Homestead Lane. This study does not intend to reopen the discussion of proposed improvements developed in the U.S. 56 Corridor Management Plan, completed in But it should address the role of U.S. 56 based on dramatically changed circumstances. Corridor Description This subject section of U.S. 56 Highway is a two-lane highway with narrow shoulders that serves northeast to southwest movement of traffic between Edgerton and Gardner, and a four-lane urban roadway that serves east-west movements within the City of Gardner. The existing U.S. 56 alignment connects with Interstate 35 on the east side of Gardner. U.S. 56 is aligned on a diagonal paralleling the BNSF and cutting across the local section line roadway grid between Edgerton and Gardner. Only Waverly Road and 199th Street will provide access to the south between the two cities, and U.S. 56 will not have direct access to the KCIMF. As indicated earlier, the primary secured access to the KCIMF is from the south along 191st Street west of Homestead Lane. U.S. 56 Highway Improvements U.S. 56 will need improvements to accommodate this growth related to the KCIMF. The Homestead Lane interchange may supplant U.S. 56 as the primary connector to Interstate 35 and the Kansas City metropolitan area, as more traffic originating or heading west uses the more direct 199th Street and Homestead Lane route. U.S. 56 could transition to a more localized road connecting Gardner and Edgerton rather than a regional transportation connection. Consequently, the road may well experience stagnant through volumes and increasing turning movements, especially at the troublesome 199th Street intersection discussed above. The areas north of U.S. 56 will also develop because of both area development catalyzed by the KCIMF and natural population growth, generating additional turning traffic. Adding dedicated left turn lanes at existing intersecting roads would allow turning traffic to queue without blocking through movements. Sight distances at the existing intersections were reviewed at the current 60 MPH posted speed using the Policy on Geometric Design of Highways and Streets (2011). A minimum of 570 feet for stopping sight distance and a minimum of 665 feet for intersection sight distance is required. Proposed left turn lanes and vertical profile adjustments along U.S. 56 Highway are shown on the plan and profile sheets. 6-38
127 TRANSPORTATION Profile grade adjustments along U.S. 56 would provide adequate sight distance at the intersections of 191st Street and Four Corners Road. Because of the diagonal alignment of U.S. 56, intersecting roads meet U.S. 56 at an angle. By adjusting side road intersection geometry to a perpendicular alignment, the intersections will improve safety and operation. Although access will be controlled along this section of roadway, additional public road access may occur at acceptable spacing and locations. When this occurs, a traffic study should be completed to determine the extent of improvements necessary to accommodate turning movements, sight distance, geometric considerations, and characteristics of U.S. 56. The addition of eight-foot paved shoulders between Edgerton and Gardner will provide an area for vehicles to pull over if necessary along with a recovery zone for errant vehicles. Secondarily, the shoulders could also accommodate bicycle commuter transportation. The U.S. 56 Corridor Management Plan developed in 2010 has additional improvements to this stretch of U.S. 56 highway based on its regional significance. U.S. 56 Highway Relinquishment There has been considerable discussion regarding the potential shift of the U.S. 56 designation from the current alignment to the 199th Street/Homestead Lane route to I-35. While this plan does not take a position on this issue, it includes the following list of items to consider when change in highway route designation is deliberated by KDOT, Johnson County and the City of Gardner. Some of the items listed will be at least partially realized with the opening of the new Homestead interchange. Along Current U.S. 56 Alignment 1. Address improvements needed on U.S. 56 before removal from the state system, including potential profile changes, surfacing, and pavement widening outlined in the U.S. 56 Plan and elsewhere in this document. 2. Identify long-term improvements that may be necessary in the future along the current U.S. 56 corridor, including potential bridge rehabilitation / replacements. 3. Recognize future maintenance costs along the current alignment that would become the responsibility of other jurisdictions, primarily the City of Gardner. These jurisdictions will need to increase maintenance budgets for the current section of U.S. 56. The four-lane section of U.S. 56 in Gardner east of Center Street is a busy segment that includes a railroad crossing, two steel girder bridges, and an interchange that require continuing maintenance. Significant resources will be needed to maintain, repair, and replace infrastructure in this area. 4. Recognize the diversion of regional travelers from Gardner s downtown area and potential effects, both positive and negative, on business types and land use. 5. Identify the benefits to the City of Gardner in the potential flexibility to apply city design standards 6-39
128 TRANSPORTATION to the Main Street corridor, including potential lane widths, truck weight restrictions, streetscape, traffic calming, active transportation, and access. In some locations this could advance city development goals for its central district. 6. Gardner Junction Park would be located off of the highway system. Along Shifted U.S. 56 Alignment to 199th Street 1. Program future improvements along 199th Street described elsewhere in this plan, including widening 199th Street to 4-lanes and eventual grade separation across the BNSF Railway corridor. If the intersection of Sunflower Road at 199th Street is not grade separated, intersection turning movements may be introduced that are uncharacteristic and unexpected along a highway route. 2. Consider the cost and potential timing of these future needed improvements in relation to the shift in the highway designation. 3. Discuss the potential roadway design standards including the typical cross section of the highway through Big Bull Creek Park and Mildale Farm. 4. Recognize the potential attraction of additional traffic, including trucks through the above sensitive areas. 5. Recognize the benefits in terms of cost sharing of maintenance and future improvements. 6-40


129 TRANSPORTATION 199th Street looking east at abandoned BNSF crossing 199th Street looking east of Middle Farm 199th Street at U.S. 56 looking southwest 199th Street at U.S. 56 looking northeast 6-41
 published by the Transportation Research Board (TRB) of the National Academies defines Access Management as the systematic control of the location, spacing,")
130 TRANSPORTATION Access Management Plan Purpose. The Access Management Manual (Manual) published by the Transportation Research Board (TRB) of the National Academies defines Access Management as the systematic control of the location, spacing, design, and operation of driveways, median openings, interchanges, and street connections to a roadway. The Manual goes on to state the purpose of access management is to provide vehicular access to land development in a manner that preserves the safety and efficiency of the transportation system. Roadways are classified by function on the basis of the priority given to through traffic movement versus land access as shown in the figure on the right. On one end of the spectrum are freeways such as I-35 where moving through traffic is the only priority with no direct access permitted to adjacent land except at interchanges. On the other end of the spectrum are local streets and cul-de-sacs that serve only a land access function with no consideration for the movement of through traffic. The most challenging part of access management is balancing the traffic movement and access functions in the middle of the graph along major and minor streets where agencies are attempting to address both. Access management is similar to right-of-way acquisition in terms of its long term impacts. It is necessary to limit access to protect public investments and maintain the long term economic vitality of the corridor. It has been estimated that effective access spacing can increase roadway capacity by 23%-45% and reduce travel time and delay by as much as 40%-60%. This is particularly critical in areas having higher truck percentages in the traffic mix as is projected to be the case on roadways surrounding BNSF s KC Intermodal Facility. Principles of Access Management State, County, and City government agencies can use their powers to protect the public health, safety, and welfare to manage road access. According to the TRB s Manual, effective management strategies provide adjacent owners with reasonable access to their property along major roadways by consolidating access and promoting convenient local circulation systems. According to the TRB Manual, the following principles should guide effective access management: 1. Provide a Specialized Roadway System. Different types of roadways serve different functions. It is important to design and manage roadways according to the primary functions that they are expected to serve. 6-42
131 TRANSPORTATION 2. Limit Direct Access to Major Roadways. Roadways that serve higher volumes of regional through traffic need more access control to preserve their traffic function. Frequent and direct property access is more compatible with the function of local and collector roadways. 3. Promote Intersection Hierarchy. An efficient transportation network provides appropriate transitions from one classification of roadway to another. For example, freeways connect to arterials through an interchange that is designed for the transition. Extending this concept to other roadways results in a series of intersection types that range from the junction of two major arterial roadways, to a residential driveway connecting to a local street. 4. Locate Signals to Favor Through Movements. Long, uniform spacing of intersections and signals on major roadways enhances the ability to coordinate signals and ensures continuous movement of traffic at the desired speed. Careless or unmanaged access connections or median openings that later become signalized often cause substantial increases in arterial travel times. In addition, poor signal placement can lead to delays that even computerized signal timing systems cannot correct. 5. Preserve the Functional Area of Intersections and Interchanges. The functional area of an intersection or interchange is the area that is critical to its safe and efficient operation, where motorists are responding to the intersection or interchange, decelerating, and maneuvering into the appropriate lane to stop or complete a turn. Access connections too close to intersections or interchange ramps can cause serious traffic conflicts that result in crashes and congestion. 6. Limit the Number of Conflict Points. Drivers make more mistakes and are more likely to have collisions when they are presented with complex driving situations created by numerous conflict points. Conversely, simplifying the driving task helps improve traffic operations and reduce collisions. A simplified driving environment is accomplished by limiting the number and type of conflicts between motor vehicles and pedestrians, and motor vehicles and bicyclists. 7. Separate Conflict Areas. Drivers need sufficient time to address one set of potential conflicts before facing another. The necessary spacing between conflict areas increases as travel speed increases, to provide drivers adequate perception and reaction time. Separating conflict areas helps to simplify the driving task and contributes to improved traffic operations and safety. 8. Remove Turning Vehicles from Through Traffic Lanes. Turning lanes allow drivers to decelerate gradually out of the through lane and wait in a protected area for an opportunity to complete a turn. This reduces the severity and duration of conflict between turning vehicles and through traffic and improves the safety and efficiency of roadway intersections. 9. Use Non-traversable Medians to Manage Left Turn Movements. Medians channel turning movements on major roadways to controlled locations. Research shows that the majority of access related crashes involve left turns. Therefore, non-traversable medians and other techniques that minimize left turns or reduce the driver workload can be especially effective in improving roadway safety. 6-43
132 TRANSPORTATION Provide a Supporting Street and Circulation System. Well-planned communities provide a supporting network of local and collector streets to accommodate development, as well as unified property access and circulation systems. Interconnected street and circulation systems support alternative modes of transportation and provide alternative routes for bicyclists, pedestrians, and drivers. Alternatively, commercial strip development with separate driveways for each business forces even short trips onto arterial roadways, thereby reducing safety and impeding mobility. Existing Access Management KDOT Access Management Policy (January 2013) The KDOT Access Management Policy contains specific criteria for the design of Interchanges and State Highways, which includes I-35, U.S. 56, and portions of Gardner Road, Homestead Lane, 199th Street, and Sunflower Road. These Access Management Policy chapters were applied in the design of the new Homestead Interchange on I-35 and along the portion of Homestead Lane from I-35 north to 199th Street. They should also be applied with any new construction or reconstruction near interchanges along I-35 at Sunflower, Homestead Lane, and Gardner Road. Work on or adjacent to U.S. 56 Highway is also covered by the KDOT Access Management Policy. Any new access points or reconstruction of existing must receive prior KDOT approval. I-35 & Homestead Interchange Full access control for the I-35 Interchange at Homestead Lane originally extended north on Homestead Lane to 199th Street without any breaks for access. At the request of the adjoining property owners and with support from the City of Edgerton, a break was provided in the access control for right- in/ right-out driveways on both sides on Homestead Lane approximately 1,000 feet south of the centerline of 199th Street or halfway between the signals at the north interchange ramps and 199th Street. It was made very clear by KDOT that this break in Full Access Control would never be converted to a median break and a full- movement intersection. A full- movement signalized intersection between I-35 and 199th Street would create increased operational and safety problems that would negatively affect the signalized intersections at I-35 and 199th Street. Access spacing on the portion of Homestead Lane between 199th Street and 191st Street should be limited to the approximate ½ mile point but may need to be adjusted to allow adequate sight distance near the existing bridge. Any full-movement access points and median breaks should only be provided where public streets can serve the adjoining parcels. I-35 & Gardner Interchange The existing interchange on I-35 at Gardner Road provides a particular challenge due to the intersections with 191st Street 250 feet north of the north ramps and 250 feet south of the south ramps. In addition to these intersections there is a commercial access on the west side of Gardner Road approximately 175 feet north of the centerline of 191st Street. Section of the KDOT Access Management Policy (Figure 4-21) specifies a minimum 750 feet between the closest ramp terminal and minor intersections in developed areas and 1320 feet in
133 TRANSPORTATION undeveloped areas or four way intersections. As traffic volumes increase at the two off-ramps and along Gardner Road, both of these off-ramp intersections will warrant traffic signals. There will also be increasing pressure to install a signal at the intersection at 191st Street and Gardner Road. This would have a detrimental effect on the interchange operation. An operational analysis and interchange design study should be initiated to address the longer term configuration of this interchange access to 191st Street and adjoining parcels. The land use and development concepts contained in the Preferred Scenario include access changes that help resolve the conflict between local access and the terminals of interstate access ramps. These include redesign with area development of the local access system, providing connected but indirect access from industrial and business park development to Center Street and the Gardner Road/I-35 interchange, thus orienting major truck traffic to Homestead Lane; relocating local access from the current 191st and Center intersection to a location that complies with access standards; and developing a local access system in the southeast quadrant of the interchange that relocates local access from 191st Street south toward the Nike School entrance. I-35 & Sunflower Interchange The interchange on I-35 at Sunflower Road has an existing private frontage road access on the west side of Sunflower Road approximately 375 feet north of the closest off-ramp. This access should be relocated to a point 1320 feet north of the closest ramp as the adjacent property develops in the future. U.S. 56 Corridor Management Plan The U.S. 56 Corridor Management Plan contains specific recommendations for the closure, consolidation of existing access points, and the location of future access along the U.S. 56 corridor through the study area. These recommendations should be followed by all jurisdictions as they review development or redevelopment along the corridor. In general and to the extent possible, all access should be limited to intersecting public streets and not taken directly from U.S. 56. Johnson County CARNP Plan The Johnson County Comprehensive Arterial Road Network Plan (CARNP Table 4.1) contains minimum and recommended median break/street spacing by roadway type, varying from 1,000 feet to ½ mile depending on the type. These standards also contain minimum corner clearances. Gardner Access Management Code The Gardner Access Management Code is a very comprehensive reference for determining the appropriate level of access management and is an effective interface between the KDOT Access Management Policy and the needs on a local level. This document could be used as an adopted standard between jurisdictions where overlapping access management is likely to occur. This would avoid inconsistencies, conflicts, and shopping by development interests to get the best deal at the expense of the long-term operations on the public street. A draft Memorandum of Understanding between John- 6-45
134 TRANSPORTATION son County, the Cities of Gardner and Edgerton, and State of Kansas Department of Transportation concerning access management within the Southwest Johnson County Area Plan boundaries is attached in the Appendix. This document is intended as a sample document which can be modified or applied to other road segments as needed. Recommended Roadway Network Improvements A variety of roadway network improvements within the study area are required in order to provide safe and efficient access for the heavy volume of truck, employee and customer traffic associated with the development of the KCIMF and the LPKC, as well as the supporting residential and commercial development. Many transportation system improvements are currently under construction, with anticipated completion in the Fall of 2013, prior to the opening of the intermodal facility. Those improvements, including the paving of 191st Street to heavy haul standards from Four Corners Road to Waverly Road, the construction of Homestead Lane from 191st Street to I-35 and the construction of the diverging diamond interchange at I-35 and Homestead Lane, were considered to represent the opening day or existing base line conditions. The City of Edgerton negotiated a series of roadway network improvements with BNSF Railway and The Allen Group (now transferred to NorthPoint Development). The construction of these improvements was associated with certain triggers based on the location and the density of development within the LPKC. For purposes of this Area Plan, those proposed improvements, along with others identified in the traffic operations analysis, have been separated based on the time frame necessary to provide acceptable levels of service. Committed Roadway Improvements The first projects, shown in Table 6.8 are identified as Short-Term Improvements. These are projects that are currently being designed for construction in 2013 or 2014, and projects that are anticipated to meet the trigger requirement for construction within the next five years. The first project identified in the table identifies the safety improvements that are scheduled to be installed on U.S. 56 on the approach to the intersection with 199th Street and Sunflower Road. KDOT will be installing advance warning signs and flashing beacons in the Fall of 2013 to warn motorists of the intersection and increased turning movements. Quiet zone improvements are scheduled for the BNSF Railway crossings of 199th Street and Nelson Street in the Fall of These improvements will consist of the installation of raised concrete medians on each roadway approach to the crossings. The medians will prevent vehicles from driving around the crossing gate arms when a train is approaching the crossing. An important roadway improvement that should be constructed in the very near future is the realignment of the 191st Street intersection with Gardner Road. This intersection is located only 250 feet from the north interchange ramp with I-35. As traffic volumes grow, this close spacing will result in operational and safety 6-46

135 TRANSPORTATION issues at this intersection. The urgency in relocating the intersection is due to the rapid development on the north side of 191st Street, west of Gardner Road. The alignment for this relocation of 191st Street should be established as soon as possible to avoid impacts to adjacent private property. The Preferred Scenario and Gardner Interchange Special Study presents concepts for how this relocation can relate to adjacent mixed use development. The paving of Waverly Road, from U.S. 56 to 191st Street is tied to the density of development within the LPKC along the east side of the street, according to the agreement reached with the City of Edgerton. Although that trigger has not been met as of this writing, it is likely that development will be rapid enough within the next five years to require the construction of these improvements. KDOT has programmed the reconstruction of the Sunflower Road interchange with I-35 for The primary purpose of the project is to replace the aging bridge over I-35, however, additional intersection improvements to accommodate future traffic volumes will also be constructed as a part of this project. Future traffic forecasts indicate that a three-lane cross section should be provided on the Sunflower Road bridge over I-35 in order to accommodate left turn movements at the ramp intersections. The future land use plan identifies commercial development surrounding the interchange. As a result, consideration should be given to providing bicycle/pedestrian access on the west side of Sunflower Road. KDOT encourages participation from the local jurisdiction to share in the additional construction costs and commit funding for future trails or sidewalks leading 199th Street Table 6.8: Short-Term Roadway Network Improvements Recommended Improvements Location Probable Cost U.S. 56 Intersection with 199th St. and Sunflower Road $10,000 Install Advance Intersection Signing Nelson Street Quiet Zone BNSF Crossing $300,000 Construct Medians 199th Street Quiet Zone BNSF Crossing $300,000 Construct Medians 191st Street Waverly Road to Gardner Road $3,971,000 Relocate intersection with Gardner Road further north(188th Street) Waverly Road U.S. 56 to 191st Street $5,769,000 Pave two-lane roadway Main Street (U.S. 56) Center Street $1,302,000 Add east-west left lanes and north-south right lanes and rebuild traffic signal 199th Street U.S. 56 to U.S. 169 $1,250,000 Construct shoulders and Significant Overlay Sunflower Road I-35 Interchange $3,000,000 Reconstruct bridge over I-35 with 3-lanes on Sunflower Road, relocate frontage road intersection, provide ADA accessible sidewalk/trail on west side of bridge (dependent upon local commitment and participation) 6-47
136 TRANSPORTATION 6-48 up to the bridge. The construction of bicycle/pedestrian facilities on bridges at interchanges are determined on a case-by-case basis through discussions and negotiations with the local jurisdictions. Johnson County will be constructing shoulders on the segment of 199th Street from the intersection with U.S. 56 east to the new bridge over Spoon Creek, located approximately 540 feet east of the former BNSF Railway crossing. This shoulder construction is anticipated to occur in Table 6.9: Mid-Term Recommended Roadway Network Improvements Recommended Improvements Location Probable Cost U.S. 56 Intersection with 199th St. and Sunflower Road $5,000,000 Widen U.S. 56 to 3 lanes with shoulders: improve profile Construct NB left turn lane on 199th Street Construct SB left turn lane on Sunflower Road Construct EB right turn lane on U.S. 56 Install traffic signal with RR pre-emption Gardner Road I-35 Interchange $4,500,000 Replace Gardner Road bridge over I-35 to 5-lanes, provide ADA accessible sidewalk/trail on west side of bridge (dependent upon local commitment and participation) Construct right turn lane on NEB off-ramp Construct right turn lane on SWB off-ramp Waverly Road Intersection with 191st Street $750,000 Construct NB and SB left turn lanes Construct SB right turn lane Install traffic signal with ADA accessible provisions on south and east U.S. 56 Intersection with Waverly Road $3,200,000 Construct EB and WB left turn lanes on U.S. 56 Mid-Term Roadway Improvements The roadway network improvements identified in Table 6.9 represent transportation system enhancements recommended for completion in the Mid-Term. These projects are necessary in order to accommodate the forecasted traffic volumes and provide acceptable levels of service. As previously mentioned, the 2025 land use assumptions consisted of approximately 65% of industrial build-out and 50% of other development envisioned by the 2040 Preferred Scenario. With this assumption,about 65-70% of the warehouse and distribution center development would be contained within the limits of the LPKC. One of the critical improvements recommended prior to 2025 is the reconstruction of the U.S. 56 intersection with 199th Street and Sunflower Road. With the increase in traffic volumes forecast to travel along the west leg of U.S. 56 and the east leg of 199th Street, the construction on U.S. 56 to provide separate turn lanes and the installation of a traffic signal with railroad pre-emption, are important to safely accommodate the turning movements and increased traffic at this intersection. This project should be completed as soon as funds can be made available. The improvements recommended at the Gardner Road interchange are also necessary to provide acceptable levels of service at the ramp intersections, and to provide separate left turn lanes for the northbound and southbound turns onto the I-35 on-ramps. Analysis of traffic queue lengths on Gardner Road indicated that the current diamond interchange configuration and spacing will be adequate to accommodate future traffic volumes. Although the analysis indicates that traffic
137 TRANSPORTATION signals will not be required by 2025, traffic operations and volumes should be continuously monitored to determine when traffic signal warrants are satisfied. In order to provide acceptable traffic operations in 2025, the construction of northbound and southbound left turn lanes on Waverly Road at 191st Street, along with a southbound right turn lane and installation of a traffic signal are required. Since the paving of a twolane Waverly Road is recommended in the previous section, consideration should be given to providing this lane configuration at the same time. Traffic signalization should wait until warrants are satisfied. At the intersection of U.S. 56 with Waverly Road, separate left turn lanes are recommended on eastbound and westbound U.S. 56. Based on the analysis, stop control on the Waverly Road approaches will still provide adequate levels of service in Long-Term Roadway Improvements The roadway network improvements necessary to provide acceptable traffic operations within the study area for the Long-Term are shown in Table These improvements are in addition to the recommendations from the Mid-Term analysis. Prior to 2040, it will be necessary to widen 199th Street to a four-lane section, from the intersection with U.S. 56 east through the study area. The 5-County Regional Transportation Study indicates that ultimately 199th Street should be a four-lane facility all the way to the Kansas/ Missouri state line. This widening of 199th Street will probably occur in phases, with the first phase consisting of the segment from U.S. 56 through the intersection with Homestead Lane. Along with the widening to fourlanes, a separate eastbound right-turn lane should be constructed on U.S. 56 to accommodate the heavy turning movement destined for the interchange with I-35. Table 6.10: Long-Term Recommended Roadway Network Improvements Recommended Improvements Location Probable Cost 199th Street U.S. 56 to U.S. 169/K-7 $33,550,000 Widen 199th Street to 4 lanes 199th Street Intersection with Homestead Lane $250,000 Construct EB right turn lane 199th Street Intersection with U.S. 56 and Sunflower Road $21,500,000 Construct Grade Separation over BNSF and U.S. 56 Gardner Road I-35 Interchange $500,000 Install traffic signal on NEB off-ramp Install traffic signal on SWB off-ramp U.S. 56 Intersection with Waverly Road $2,800,000 Construct NB and SB left turn lanes on Waverly Road U.S. 56 Intersection with Poplar Street/Sante Fe Street $1,100,000 Construct Roundabout as shown in U.S. 56 Corridor Management Plan --OR-- Install traffic signal with EB left turn lane on U.S st Street Intersection with Homestead Lane $150,000 Provide dual WB left turn lanes Waverly Road Crossing with BNSF Intermodal Tracks $5,032,000 Construct Grade Separation over BNSF Intermodal Tracks 183rd Street Waverly Road east 1/2 mile $1,367,000 Raise the grade of 183rd Street approximately 25 feet to match the Viaduct grade on Waverly Road and pave as a 3-lane roadway or shift roadway connection to Waverly Road 400 feet south. 207th Street Viaduct Over the BNSF east of Edgerton Road $5,485,000 Construct a Viaduct over the BNSF Mainline 6-49

138 TRANSPORTATION By 2040, it will be necessary to install traffic signals at the I-35 interchange ramp termini with Gardner Road. Traffic volumes should be monitored over time to determine when the traffic signal warrants will be satisfied. Changes in anticipated development patterns could significantly accelerate the need for traffic signals at the interchange. Local Traffic Network The discussion in this chapter necessarily centers around the major street network, its future performance, and the improvements that will be necessary to adapt the system to major changes in traffic characteristics and volumes. As the Transportation Resource Board s Access Management Manual states, development of a good secondary street and circulation system is also important to the operation of the primary network. The secondary system will emerge with development, but its framework should be established to ensure that incremental private development decisions include its evolution. The Preferred Scenario diagram in Part Five presents concepts for this framework. Key elements include: A mid-section east-west collector ( 195th Street between 191st and 199th Street. This,combined with north-south collectors, can direct a portion of truck and other industrial traffic off 191st and 199th Street, permitting both of these major roadways to perform their intended functions with minimum friction. A road system that provides internal connectivity to major residential and commercial development areas in Gardner for residents and local traffic, but directs industrial traffic to the Homestead Lane interchange. In the concept, this is accomplished by looping 191st and 195th Streets together and providing a single access from the loop to Center Street. Traffic filtration devices like roundabouts can also be used to discourage truck traffic from attempting to reach I-35 via the Gardner interchange. Relocated local access to Gardner Road. Local access now uses 191st Street and is excessively close to the ramp termini of the interchange. The Preferred Scenario relocates these intersections farther north and south of the interchange, in compliance with access management standards. Comprehensive Arterial Roadway Network Plan (CARNP) Update Construction of the KCIMF and the LPKC created several disruptions in the county roadway network. The following roadway segments, shown in Figure 6.19, were removed to facilitate the construction of the intermodal facility: Service roads running parallel to Homestead Lane, again designed to conduct traffic to desired intersection points with the new arterial. 6-50

139 TRANSPORTATION Four Corners Road: 191st Street to U.S st Street: Four Corners Road to U.S rd Street: Waverly Road to U.S. 56 Although the segment of Four Corners Road, from 191st Street to U.S. 56 was removed, the public right-of-way remains for construction of a potential grade separation in the future, if deemed necessary. Along 183rd Street and 191st Street, the public right-of-way was eliminated through the KCIMF property. These improvements, scheduled for completion prior to the opening of the facility in the Fall of 2013, include: Diverging diamond interchange at Homestead Lane and I-35 Figure 6.19: Roadway Segments Removed by KCIMF In addition to the severed segments of roadways in the vicinity of the new intermodal facility, modifications to the remaining roadway network in the immediate area are required to accommodate the anticipated heavy truck traffic and to provide adequate access and capacity for the anticipated development of the LPKC and the surrounding area. Some of these improvements are currently under construction, and some are based on the amount, location and density of development within the LPKC. As a result of these anticipated roadway network modifications and improvements, it is necessary to update the Johnson County Comprehensive Arterial Roadway Network Plan (CARNP) within the study area of this Southwest Johnson County Area Plan. Roadway Network Improvements Several improvements to the existing roadway network are currently under construction within the immediate vicinity of the KCIMF in order to accommodate the anticipated heavy truck traffic. 6-51
140 TRANSPORTATION Four-lane divided roadway on the Homestead Lane alignment, from I-35 to 191st Street Three-lane heavy haul roadway constructed on 191st Street, from Four Corners Road to Waverly Road There are also a number of other roadway improvements that were identified in the Infrastructure Financing Plan agreement between the City of Edgerton, the BNSF Railway Company and the Allen Group. North Point Development has recently assumed the Allen Group s role in the agreement. In addition, the analysis conducted as a part of this Area Plan recommends additional improvements to the roadway network within the study area. Planned or recommended improvements in the area include: Quiet zone improvements at the BNSF Railway crossings at 199th Street and at Nelson Street Construction of shoulders and safety improvements on 199th Street, from U.S. 56 to Homestead Lane (2014) Construction of shoulders and safety improvements on 199th Street, from Homestead Lane to U.S. 169 (by 2018) Realign 191st Street, from Waverly Road to Gardner Road to provide more distance from I-35 interchange Construction of a two-lane section on Waverly Road, from 191st Street to U.S. 56 Reconstruction of I-35 interchange with Sunflower Road Reconstruction of U.S. 56, from approximately 191st Street through the intersection with 199th Street/ Sunflower Road to improve sight distance and to provide left turn lanes on U.S. 56 in both directions, and to construct a right-turn lane from U.S. 56 to eastbound 199th Street 207th Street Grade Separation over BNSF Railway 183rd Street Extension, paving from South Poplar Street to Waverly Road Modifications to the CARNP Based on the roadway improvements currently being constructed, the recommendations from this Area Plan, and the Infrastructure Financing Plan, the following modifications to the CARNP within the immediate vicinity of the KCIMF are as described below and shown on Figure Deletions from the CARNP Type I / 2 Lanes 183rd Street, Waverly Road to U.S st Street, Four Corners Road to U.S. 56 Type II / 2 Lanes Four Corners Road, 191st Street to U.S. 56 Gardner Road, 175th Street to 0.43 miles north of 199th Street (within Gardner City Limits) Remove future interchange at Waverly Road and I-35 Modifications to the CARNP Type I / 2 Lanes to Type II / 2 Lanes Waverly Road, 175th Street to 0.70 miles south of 191st Street Sunflower Road, I-35 to 0.65 miles north of 207th Street 6-52

141 TRANSPORTATION Type I / 2 Lanes to Type II / 4 Lanes 191st Street, Four Corners Road to Waverly Road Type I / 2 Lanes to Type III / 4 Lanes Homestead Lane, I-35 to 191st Street Type II / 2 Lanes to Type II / 4 Lanes Gardner Road, 199th Street to I-35 Type II / 2 Lanes to Type III / 4 Lanes 199th Street, I-35 to U.S. 56 Figure 6.20: Recommended CARNP Modifications 6-53
142 TRANSPORTATION THIS PAGE INTENTIONALLY LEFT BLANK 6-54

143 ACTIVE TRANSPORTATION PART SEVEN ACTIVE TRANSPORTATION 7-1
144 ACTIVE TRANSPORTATION Transportation is a key element of the Southwest Johnson County Area Plan, and without an effective transportation system, the area will not be able to absorb the growth and change that is coming its way. Necessarily, the focus of transportation planning is managing the unusual increase in truck and automobile traffic that will accrue from the Kansas City Intermodal Facility; the probable long-term development of 16 million square feet of warehouse and distribution space; the potential of several million additional square feet of associated industrial, office, and flex space; and substantial commercial and residential growth. But there is another dimension to transportation that has become an increasing subject of interest in the Kansas City metropolitan area and around the country the modes of movement that are referred to as active transportation. In this study area, on the edge of a major metropolitan region, active transportation concentrates on bicycle and pedestrian facilities. Moreover, since this plan s study area is largely outside the fine-grained environment of the two cities, this section will be largely oriented to moderate to long-distance, multi-purpose facilities, used by pedestrians and sized for bicyclists. With some exceptions, it will not address the smaller scale of pedestrian facilities like conventional sidewalks. Purposes of Active Transportation Trips made under people s own power are often separated into two general categories of purpose: utilitarian and recreational. Unique among urban transportation modes, utilitarian trips may also be recreational. It is one of the most attractive features of these modes. In general, though, utilitarian trips are made for a purpose, specifically to reach a destination for specific purposes: commuting to work, travelling to shop, going to school, or even going to a park or other recreational facility. Recreational trips are made for the purpose of the trip itself, and the enjoyment that it brings. Given that dichotomy, there are a number of specific purposes and issues that an active transportation network for the study area should address. Recreational transportation within and to regional facilities. Most (but most assuredly not all) adults continue to associate bicycle and pedestrian travel with recreation, despite greater interest and popularity in active modes for basic transportation. But the presence of two enormous regional recreational resources in the study area, Mildale Farm and the future Big Bull Creek Park, inevitably make recreational trips vitally important here. Some of these trips will be for travel to the parks, while more will probably involve walking, running, or biking within these open spaces. Recreational trips become even more important when the entire region is considered. With Hillsdale Lake a few miles south of the Johnson County line and the county s future regional park, the lake and its resources become more accessible to more people. Regionally, a trail connection along the Big Bull Creek corridor between Mildale Farm, Big Bull Creek park, and the lake creates a green corridor of major resources that is equalled in very few places in America. The study area communities also have their own major recreational facilities that complement these large scale regional open spaces. These include Gardner s excel- 7-2


145 ACTIVE TRANSPORTATION lent park system, Lake Gardner, and Martin Creek Park in Edgerton. Typically, infrastructure for recreation trips ranges from paved multi-purpose trails for people of a variety of capabilities, to unpaved hiking and nature trails. Intercity trips. Major development between them will inevitably draw Gardner and Edgerton closer together and travel between the two cities is likely to increase. Therefore, the network should naturally increase access between these two communities, which are only six miles apart. Intercity connections to other parts of the region will also become increasingly important for a number of purposes, including commuting to employment centers in the study area or in other parts of Johnson County. The county itself has a comprehensive trail system that serves a number of activity centers. However, the closest approach of this system is 159th Street and Lone Elm Road in Olathe, about seven miles from Gardner by road. Local trips. These trips include travel from residential areas, including new development, to local destinations which can include trips to work, shopping, libraries, city offices, or other community destinations. Ideally, the areawide system becomes an extension of community active transportation systems. The development of a massive employment center only a few miles from either city makes active transportation a significant choice for many local workers. This, in turn, can remove at least some auto trips from the street network. Trips to school. An important issue for both pedestrian and bicycle access is travel to Nike Elementary School along Gardner Road south of I-35. The school lacks sidewalks or pathway access of any kind. The school s attendance area includes much of the study area south of U.S. 56 and west of Gardner Road, and new residential areas east of Gardner Road and south of 183rd Street. This requires students walking to school to negotiate the Gardner Road interchange and its narrow bridge, a daunting and potentially unsafe task that few undertake. Existing Facilities Bicycle and pedestrian facility planning in the study area is subject to the same limitations of road planning, most notably system discontinuities created by the KCIMF and LPKC complexes and narrow county roads lacking accommodations for pedestrians and bicyclists. Gardner and Edgerton possess several significant trail facilities, including: Sidepaths (multi-purpose trails within street right-ofways) in Gardner along Center Street from Grand Street to north of the I-35 interchange, and from Colleen Drive to 167th Street; and along Madison Avenue between Center Street and Waverly Road. The Gardner Greenway, between Washington Street and 167th Street. A segment of sidepath along 183rd Street between Center Street and Poplar Street on the west side of Gardner. Pedestrian paths at Martin Creek Park in Edgerton. Center Street and 183rd Street sidepaths in Gardner. 7-3
146 ACTIVE TRANSPORTATION Infrastructure Types The various purposes that the active transportation system in the study area should address apply to the following types of bicycle and pedestrian facilities and upgrades: Paved multi-use trail on separated right-of-way. This kind of facility, typically using such resources as watercourses, railroad abandonments, utility corridors, buffers, or parks, has been the staple of facility development in the metropolitan area. They offer the highest level of perceived comfort to most users because they are generally free of conflicts with cars and trucks. However, poor design and geometrics in older trails and the mixed speeds and capabilities of users can create conflicts and even safety issues. In the study area, multi-use trails apply to regional facilities, major trails along drainageways (particularly in the Big Bull Creek system), within buffers, and along abandoned BNSF railroad segments. Paved multi-use trails within or along road right-of-way. Sometimes called sidepaths these multi-use pathways within street right-of-ways typically run parallel to the roadway and are separated from the street channel. Sidepaths are sometimes referred to as widened or multi-use sidewalks and can be an efficient way to accommodate pedestrians and bicyclists on arterial street corridors. They are sometimes employed along lower volume collector and local streets, but are less popular with bicyclists who find it more convenient and equally safe to ride in these types of streets. The use of sidepaths has been controversial in the planning and design of bicycle facilities. The previous edition of the AASHTO bicycle facilities design manual actively discouraged their use, while the new version is more accepting when provided with appropriate design features. In the study area, sidepaths are a good solution along busy streets or roadways with controlled access and relatively few interruptions by intersecting streets or driveways. Highway enhancement and reconfiguration with paved shoulders or separated path. This includes road upgrades that add paved shoulders, creating an acceptable facility for bicyclists who are comfortable riding on principal roads in areas located outside of travel lanes. This solution can also provide safer motor vehicle environments, and can apply to improvements of U.S. 56 or 199th Street. Urban bike lanes with sidewalk continuity. This solution, often referred to as complete streets, accommodate both pedestrians and bicyclists, often in city or urbanizing environments. Features of complete streets include: - Continuous pedestrian access, with sidewalks that provide sufficient width, setbacks from trafficways, and continuity to provide safe environments. Complete pedestrian access also includes safe crossings at intersections or at strategic locations along major corridors. - On-street bicycle infrastructure. Although there are variations, on-street infrastructure typically includes three broad categories: sharrows (or shared use markings), bike lanes, and cycle tracks. Shared on-street routes. These facilities, with lower ADT s, include continuous sidewalks and accommodate bicycles through shared use pavement markings (sharrows), signage, traffic calming devices, and other features. These facilities generally apply to low- to middle-volume urban streets, and are more likely to be parts of locally planned active transportation systems in Gardner and Edgerton. The conflict applies especially well to streets like Nelson Street in Edgerton. 7-4
147 ACTIVE TRANSPORTATION Major barrier removal. Bridging difficult barriers can be very important in improving pedestrian and bicycle mobility. Key barriers to active transportation in the study area include: I-35/Sunflower Road interchange I-35/Gardner Road interchange Interstate 35 as it affects linkages of the regional park The U.S. 56/BNSF corridor The Center Street overpass into central Gardner Surface street pedestrian crossings The Active Transportation Network Figures 7.1 and 7.2 illustrate the proposed Active Transportation Network for the study area, including connections into Gardner and Edgerton. Figure 7.1 shows a system composed of 11 individual routes, along with internal park trails and pathways that will be developed as part of major development projects. Figure 7.2 displays the type of infrastructure appropriate to each facility segment. Table 7.1 summarizes characteristics of each of the potential routes, listed below. 1. Gardner-Edgerton Trail, the primary trail linking the two area communities, primarily using the middle tributary of Big Bull Creek, the abandoned railroad right-of-way and 199th Street through the future regional park, and continuing to Martin Creek Park and the center of Edgerton. 2. Hillsdale Trail, extending along Big Bull Creek through the regional park and continuing to Hillsdale Lake. 3. Parkway Trail, following 199th Street and its eventual parkway design, and presenting a direct route between the south side of Gardner and Edgerton. 199th Street. When the Gardner Road bridge over I-35 is reconstructed to a 5-lane section, consideration should be given to providing a protected bicycle/pedestrian access on the west side of the bridge. 5. U.S. 56, utilizing shoulders proposed for the corridor as a bicycle accommodation for commuters th Street Path, continuing a sidepath from Madison Street and Gardner High School to the north part of Big Bull Creek. 7. Johnson County Regional Route, providing on-road and path facilities connecting Gardner to Olathe, illustrated in Figure North Bull Creek Trail, continuing north from Mildale Farm with passage along the creek under U.S. 56 and the BNSF to 175th Street. 9. Waverly Road Complete Street, providing shoulders or a sidepath along Waverly Road and the proposed 195th Street collector rd Street Link, completing the sidepath connection between Gardner Road and Waverly Road. 11. Creek to Creek, a path connecting Martin and Big Bull Creeks via Sunflower Road and 207th Street. This path should also extend south along Sunflower Road to 215th Street to serve potential commercial and light industrial uses anticipated at the I-35 interchange. In addition, consideration should be given to providing a protected bicycle/pedestrian access on the west side of the bridge and clearly marked crossings of access ramps. 4. Nike Trail, including a protected crossing of Center Street from the existing sidepath, and continuing to Nike School and 7-5


148 ACTIVE TRANSPORTATION Figure 7.1: Proposed Active Transportation Network 1 Gardner-Edgerton Trail 2 Hillsdale Trail 3 Parkway Trail 4 Nike Trail 5 US th Path 7 JoCo Regional Route 8 North Bull Creek Trail 9 Waverly Complete Street rd Link 11 Creek to Creek Paths with Development Park Trails and Paths 7-6

149 Figure 7.2: Active Transportation Network by Infrastructure Type ACTIVE TRANSPORTATION 7-7
150 ACTIVE TRANSPORTATION Table 7.1: Components of Active Transportation Network (Routes 1-5) Route Endpoints Infrastructure Highlights 1. Gardner- Edgerton Trail (GET) Downtown Gardner/ Cornerstone Park to Martin Creek Park/ Downtown Edgerton 2. Hillsdale Trail Mildale Farm/Big Bull Creek Park to Hillsdale Lake 3. Parkway Trail Big Bull Creek Park to Nike School Development Area 4. Nike Trail Downtown Gardner to Nike School 5. U.S. 56 Downtown Gardner to Downtown Edgerton Shared route on Elm and Park Streets Bike lanes on Center Street including viaduct Shared route on Grand Street Trail through buffer Sidepath extension on 183rd Street Sidepath on intersection segments of Waverly Road and 191st Street Trail along Big Bull Creek tributary Sidepath along new 195th Street and into Big Bull Park Trail along abandoned BNSF in park and paralleling 199th Street Shared route through Edgerton via Nelson Street and to Martin Creek Park via E. Nelson Street Alternate route via drainageway and 199th Street Shared use trail along Big Bull Creek Park trail network Shared use trail/sidepath as part of parkway design of 199th Street Dedication of trail corridor and neighborhood park in development area south and east of Nike School Bike lanes on Center from Main Street to Grand Street includes restriping of overpass to 2-lanes plus bike lanes Existing Center Street trail New protected crossing south of 188th Street New west side sidepath to 199th Street New I-35 overpass at Gardner Road with path, dependent upon local commitment and participation Shared route on Warren and Park Streets in Gardner Redesign to new roadway section on existing U.S. 56, proposed with paved shoulders, possible sidepath on north side Right of Way and Operational Issues and Requirements Dedication of creek/greenway corridors with development Public operating entity of greenway and buffer corridors. Probable agencies would be City of Gardner for residential buffer corridors and Johnson County Park District for greenway corridors Securing parts of the former railbed still owned by the BNSF by donation, direct purchase, lease, easemnent, or railbanking Cooperative relationship of Johnson and Miami County Park Districts and US Army COE Jurisdictional control of 199th Street City of Gardner management of trails and neighborhood park in Nike School area City of Gardner ROW, with developer contribution to sidepath development City, KDOT Jurisdictional control of street corridors 7-8
151 ACTIVE TRANSPORTATION Table 7.1: Components of Active Transportation Network (Routes 6-11) Route Endpoints Infrastructure Highlights th Street Path Downtown Gardner to Big Bull Creek North via Gardner HS Existing path on Madison Avenue New sidepath on Waverly Road New sidepath on 175th Street Right of Way and Operational Issues and Requirements City of Gardner ROW, with developer contribution to sidepath development 7. JoCo Regional Route Downtown Gardner to Olathe Sidepath extension to 167th Street Lane diet with bike lanes on Gardner Lake West Paved shoulders on 151st Street Upgrade existing shared route on 151st Street and Lakeshore Drive Existing Denny Avenue bike lanes Jurisdictional control of street corridors 8. North Bull Creek Trail 9. Waverly Complete Street 175th Street to Mildale Farm via Lanesfield School Gardner High area to Homestead Lane rd Street Link Center Street to Waverly Road 11. Creek to Creek Martin Creek Park to Bull Creek Extension south to 215th Street and Sunflower Road Shared use trail on Big Bull Creek north of U.S. 56 Undercrossing of U.S. 56/BNSF at Big Bull Creek Shared use trail through Mildale Farm to connect to Gardner-Edgerton Trail Sidepath/complete street design of Waverly Road and 195th Street Sidewalk and bike lanes/shoulders can substitute for sidepath New overpass with pedestrian access and shoulders on Waverly Road overpass over through track East and west extension of 183rd Street sidepath on north side Sidepaths along Sunflower Road and 207th Street Connects to Big Bull Creek Trail to Hillsdale Lake Continuation south along Sunflower Road to 215th Street, serving development at I-35 interchange Pedestrian/bicycle protected path incorporated into a new I-35 overpass, dependent upon local commitment and participation Johnson County acquisition of north corridor Undercrossing of U.S. 56 and BNSF right of way. Inability to do this would require trail direction toward Edgerton on U.S. 56 to 199th Street crossing Development of complete streets when paving or street construction thresholds are reached Depends on resolution of Gardner- Edgerton boundary Financing by county 7-9
152 ACTIVE TRANSPORTATION Bicycle/Pedestrian Crossings and Support Facilities Intersection and pathway crossings are critical parts of active transportation systems and inattention to details at these points can both present barriers to use and create potential safety hazards. The bicycle and pedestrian network envisioned in this chapter generally avoids frequent urban intersections and driveway conflicts, but encounters a variety of other road crossing issues, including negotiating interchanges, crossing major arterials with substantial truck traffic, crossing urban streets and intersections, and providing safe pedestrian and bicycle operations for sidepath components. Facility designers should use the AASHTO Guide for the Development of Bicycle Facilities (2012, 4th Edition) and the NACTO Urban Bikeway Design Guide (2011) for guidance in specific contexts. Table 7.2 on the facing page indicates specific intersections in the system that will require special attention to accommodate active transportation, along with general guidance on potential design features that should be incorporated The active transportation network also should incorporate support facilities at strategic locations, and provides opportunities for innovation as well. These facilities include: Bicycle parking. Bicycle parking facilities should be provided at key points along the network, including activity centers such as the town centers of Gardner and Edgerton; the mixed use center and other retail facilities at the Gardner Road interchange; major employment centers, parks and recreational features such as Martin Creek Park and Mildale Farm; and trailheads. Bicycle parking should also be encouraged at convenience stores, restaurants, and similar services. Bicycle parking is most appropriately, functionally, and unobtrusively provided with individual inverted U, theta, or hitching loop designs rather than wave or schoolyard racks. Trailheads. Trailheads should be provided at strategic entrance locations that permit staging without taking dedicated commercial or residential parking stalls. Candidate sites include existing, clearly accessible park locations (Martin Creek, Trail Park, Gardner city parks) and the perimeter of the developing Big Bull Creek Park. Facilities should include parking, water, restrooms, and information. Wayfinding. Wayfinding signage is often neglected, but extremely important, especially in regional systems or in places that present a number of alternative routes. Wayfinding graphics should comply with MUTCD/AASHTO standards, and may also include number and route identifiers. Typical signs should include bike route signs that identify destinations or milestones along the way, and directional blades that indicate distance. Special Facilities. The extensive truck traffic expected in the area provides a special opportunity to serve drivers and their health and fitness needs. The active transportation system provides a direct greenway link between the center of industrial activity near 199th Street and Homestead Lane to the future Big Bull Creek Park. This provides an opportunity for public/private cooperation with services such as truck stops by providing bike share facilities, equipment rentals, promotional materials, and wayfinding information. I-35 Interchanges. The crossings of I-35 at Sunflower Road and at Gardner Road present significant barriers to the 7-10


 Key Intersections (Possible Crossing Treatments) 183rd Street at greenway buffer (midlblock crossing with possible HAWK beacon) 191st Street-Waverly Road (defined")
 Sunflower Road-Nelson Street (defined crossing to Martin Creek Park, Nelson Street path perpendicular to railroad) 2.")
 I-35(sidepath on new or upgraded bridge, dependent upon local commitment and participation) 199th")
153 ACTIVE TRANSPORTATION Table 7.2: Intersection Conditions Crossing definition. Sidepath crossings should be welldefined for maximum visibility. Colored or textured surfaces can be effective, as can well-maintained zebra crossbars. A clear stop bar should be provided with advisory signage to prevent motorists from blocking the path. Midblock trail crossing. This installation includes stamped asphalt markings and a center crossing median at an intersection between a major regional trail and an arterial highway. Sidepath advisory sign. A variation of the Railroad Advance Warning Sign, this sign advises of the presence of a path parallel to the road. It should be used on both sides of a road with parallel sidepaths. This installation is along Denver s Cherry Creek Trail. Right-turn bypass and refuge island. This technique separates right turns from other movements, reducing the number of conflicts that pedestrians and cyclists must encounter at a single crossing. It provides clear crossing markings and an accessible refuge. Route 1. Gardner- Edgerton Trail (GET) Key Intersections (Possible Crossing Treatments) 183rd Street at greenway buffer (midlblock crossing with possible HAWK beacon) 191st Street-Waverly Road (defined sidepath crossing, possible right turn bypass) 199th Street-Homestead Lane(defined sidepath crossing, possible right turn bypass) 199th Street at Big Bull Creek (underpass with road reconstruction, interim defined midblock crossing with possible beacon) Sunflower Road-Nelson Street (defined crossing to Martin Creek Park, Nelson Street path perpendicular to railroad) 2. Hillsdale Trail I-35 (underpass at creek bridge) 3. Parkway Trail Gardner Road (midlblock crossing with possible HAWK beacon, crossing refuge) I-35(sidepath on new or upgraded bridge, dependent upon local commitment and participation) 199th Street-Homestead Lane (defined sidepath crossing, possible right turn bypass) 4. Nike Trail 188th Street-Center Street (defined crossing with signal, pedestrian refuge islands) I-35(defined crossings of ramps, right-turn bypass, sidepath on overpass, dependent upon local commitment and participation) 5. U.S. 56 Warren Street-U.S. 56 (midlblock crossing with possible HAWK beacon, crossing refuge) All intersections with sidepath (defined crossing, path advisory on intersectiing streets, warning diamond of presence of parallel path) U.S. 56/199th Street/Sunflower Road- (defined crossings, bicycle track markings, bike lanes and pedestrian crossing included in future intersection and interchange designs, dependent upon local commitment and participation) th Street Path 7. Johnson County Regional Route 8. North Bull Creek Trail 9. Waverly Complete Street All intersections with sidepath (defined crossing, path advisory on intersecting streets, warning diamond of presence of parallel path) All intersections with sidepath (defined crossing, path advisory on intersectiing streets, warning diamond of presence of parallel path) U.S. 56/Railroad (grade separation under the railroad and highway) All intersections with sidepath (defined crossing, path advisory on intersectiing streets, warning diamond of presence of parallel path) rd Street Link All intersections with sidepath (defined crossing, path advisory on intersectiing streets, warning diamond of presence of parallel path) 11.Creek to Creek All intersections with sidepath (defined crossing, path advisory on intersecting streets, warning diamond of presence of parallel path) I-35(defined crossings of ramps, right-turn bypass, consideration of sidepath on overpass) 7-11
154 ACTIVE TRANSPORTATION bicycle and pedestrian network for this region. When the bridges are replaced over I-35, in addition to providing additional travel lanes to accommodate future traffic volumes, consideration should be given to providing a protected bicycle/pedestrian path along one side of the new structure. KDOT encourages participation from the local jurisdiction to share in the additional construction costs and commit funding for future trails or sidewalks leading up to the bridge. The construction of bicycle/pedestrian facilities on bridges at interchanges are determined on a case-by-case basis through discussions and negotiations with the local jurisdictions. Regional Active Transportation Connections Johnson County s extensive trail system is an enormous quality of life and transportation asset, but even at its closest approach remains relatively distant from the Southwest Johnson County planning area. However, the network can extend to Gardner, Edgerton, and ultimately Big Bull Creek Park and Hillsdale Lake at relatively manageable costs. The closest apparent connection of the multi-use, off-road trail network is to the 159th Street and Lone Elm Road intersection in the southwestern corner of Olathe. However, 159th Street is currently unpaved and has heavy quarry-related truck traffic. With further development, this street will be upgraded, and should be designed to complete street standards, with paved shoulders usable as bike lanes and a protected off-street multi-use path. A better short-term alternative uses the existing Dennis Avenue bike lanes to Lake Olathe, and continues along Lakeshore Drive and 151st Street to Gardner Road at Lake Gardner. The 151st/Lakeshore route between Dennis Avenue and the Cedar Creek bridge is signed as a share the road route and much of this connection provides paved shoulders. Addition of paved shoulders where absent would both accommodate bicycle travel and improve safety for motorists. Gardner Road south from 151st Street is a fourlane facility without turn lanes. Moderate traffic volumes can be supported by a road diet, providing three lanes with bike lanes/shoulders. This treatment moderates speeds, increases safety, and also continues the intercity bike connection. The on-street bike shoulder should continue to the beginning of the Gardner Road/Center Street sidepath, which currently begins at 167th Street. This should be extended north as funds are available, largely with adjacent development. Another promising possibility would extend north along the East Fork of Kill Creek from 151st Street to an existing trail at 135th Street between Homestead Lane and Spoon Creek Road. This trail continues into Kill Creek Park and with the closure of a gap between the park and Kill Creek Streamway Trail, continues into the center of De Soto and the Kansas River. Combined with the proposed Gardner-Edgerton and Hillsdale Trails proposed earlier, a national-class greenway network results, linking the river, major parks and lakes, Mildale Farm and the future Big Bull Creek Park with the entire Kansas City metropolitan area. Figure 7.3 illustrates these regional active transportation connections. Public Transportation Johnson County Transit s South County JO service connects Gardner and Edgerton with the Great Mall in Olathe, Oak Park Mall, and Downtown Kansas City with its South County Express (Route 670). Weekday express service provides two 7-12


155 ACTIVE TRANSPORTATION peak hour weekday trips from the centers of Edgerton and Gardner and four trips from TradeNet and New Century business park to and from central Kansas City. The emergence of major employment in the Southwest Johnson County plan area is likely to generate reverse commuting patterns that could support new transit services. By increasing loads in both directions and reducing deadhead runs, the growth of employment could also improve the economics of expanded transit service. Including a relatively high density residential community on the west side of Gardner The JO s buses are also equipped with bike racks, helping to make the active transportation network proposed in this chapter into an excellent local distribution system for linehaul express transit services. Figure 7.3: Regional Connections The preferred future land use plan is designed to maximize transit opportunities by: Concentrating major industrial employment within a relatively compact area with excellent direct interstate access Providing opportunities for office and business parks with high employment densities Proposing a major mixed use center at the Gardner Road interchange, with a development illustration designed with a transit orientation 7-13
156 ACTIVE TRANSPORTATION THIS PAGE INTENTIONALLY LEFT BLANK 7-14

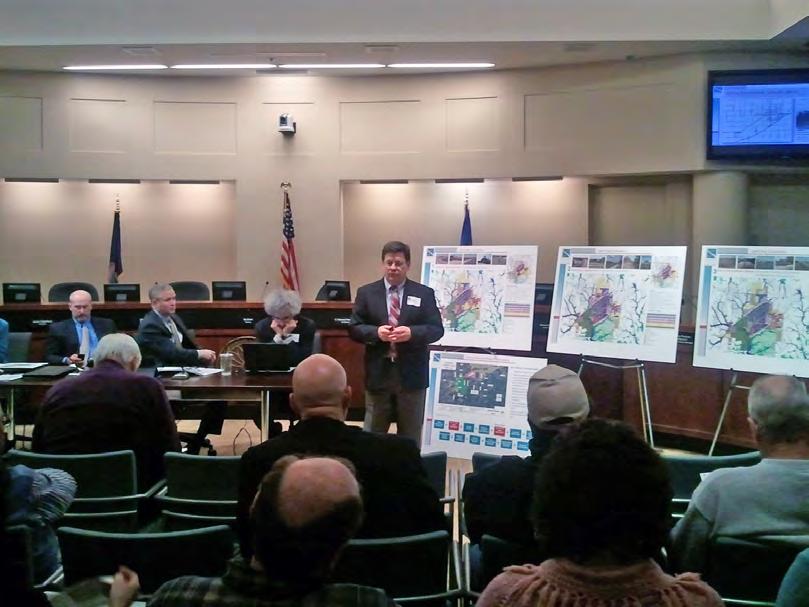
157 PART EIGHT COMMUNITY ENGAGEMENT 8-1


158 COMMUNITY ENGAGEMENT A comprehensive Public Involvement Plan (PIP) was developed for this Southwest Johnson County Area Plan. The purpose of this PIP was to establish the public involvement process for the project and describe how state, county, and local governmental officials, regional transportation planning entities, citizen groups, community groups, civic and professional organizations, businesses, citizens, and low-income and minority populations would be involved in the process. The public involvement process included the provision of complete information, timely public notice, and full access to key decisions, and opportunities for early and continuing participation. Public Involvement Goals The goals of the public involvement program are: To work cooperatively with stakeholders reflecting a broad range of viewpoints to incorporate the interests of as many segments of the community as possible in this Area Plan To learn from and inform the public, gain input on specific alternatives, and discuss tools that will best meet the transportation needs in the area Public Involvement Objectives The objectives of conducting effective public involvement are to provide: An atmosphere of trust between the various agencies working together on the plan Information that allows them to understand and consider decisions made throughout the plan process Awareness and opportunities for the public to offer input at key stages of the plan Support for the necessary process and specific projects that will be necessary to implement the plan Stakeholder Coordination A successful plan incorporates diverse public viewpoints by ensuring agency and public involvement as a way to help state, county, local government and transportation agencies make informed decisions about land use development scenarios and transportation system options. Core Team The study team worked cooperatively with the affected communities through the establishment of a Core Team. This Core Team, made up of representatives from each of the sponsoring jurisdictions and agencies, was responsible for providing guidance and direction to the consultant team, as well as reviewing study assumptions and recommendations. Core Team representatives consisted of the following members: KDOT Planning (3) KDOT Public Affairs (1) KDOT Kansas City Metro Area (1) Johnson County Planning (2) Johnson County Public Works (2) Johnson County Parks & Recreation District (1) Johnson County Administration (1) Johnson County Sherriff s Office (2) Mid-America Regional Council (1) City of Gardner Public Works (1) 8-2

159 COMMUNITY ENGAGEMENT City of Gardner Planning (1) City of Edgerton Administration (1) Felsburg Holt & Ullevig (2) RDG Planning & Design (2) CFS Engineers (1) This Core Team met ten times over the course of the plan development to review progress of the research, planning documents, report production, and public involvement processes. The meetings were held in the communities of Edgerton and Gardner, and in the Johnson County Administration Building in Olathe. Advisory Committee An Advisory Committee was established to provide information, input and comments to the Core Team regarding the study. While the Core Team managed this study, the 14-person Advisory Committee was involved with periodic project team meetings, received project correspondence and reviewed documents. The Advisory Committee consisted of the following representatives: City of Edgerton - City Council member - Planning Commissioner City of Gardner - City Council member - Planning Commissioner Johnson County - County Commissioner - Planning Commissioner - Park and Recreation District Board Member Local Property/Business Owners (3) Southwest Johnson County Economic Development Miami County Economic Development NorthPoint Development (Logistics Park Kansas City) Local Attorney Gardner Edgerton USD 231 Johnson County Health & Environment The Core Team met with the Advisory Committee three (3) times throughout the course of the study. These meetings consisted of a Kick-off meeting, a progress meeting mid-way through the study, and a final meeting to review and comment on the draft Area Plan. As a part of the progress meeting, a Bus Tour of the study area was conducted for members of both the Core Team and the Advisory Committee. In addition to these meetings, Advisory Committee members were invited to participate in the two Public Official Briefings held during the study. Public Participation Opportunities Several opportunities were provided to allow interested citizens and elected officials participate in the development of this Area Plan. Two Public Official Briefings were held to discuss the study, along with two open house public meetings that were specifically focused on the land use elements of the plan. Public Official Briefings - Since all or some portions of this Area Plan will be adopted by the local jurisdictions, it was important for the Core Team to meet with representatives of the two City Councils, the County Commissioners and Planning Commissions for both cities and for the county. Two meetings were conducted during the study. The first meeting provided an update of the development of the land use scenarios being developed for the study area. 8-3
.")


160 COMMUNITY ENGAGEMENT The second meeting presented the draft report and recommendations from the Area Plan. In addition to the City and County representatives, the preliminary recommendations of the transportation network improvements were presented to the MARC Total Transportation Policy Committee (TTPC). The attendees had the opportunity to review and comment on the draft document prior to the preparation of the final plan. Representatives from the following councils and commissions attended these briefings: Johnson County Board of County Commissioners Johnson County Planning Commission Edgerton City Council Edgerton Planning Commission Gardner City Council Gardner Planning Commission MARC s Total Transportation Policy Committee Public Information Meeting - The Core Team conducted two Public Information Meetings that focused on the development and evaluation of alternative land use scenarios for the study area. The first meeting in November 2012, was held to present the purpose of the Area Plan, and to gain input from local property owners, businesses and other interested parties. This information was used in the development and evaluation of the alternative land use scenarios. The Consultant Team prepared materials for the two public meetings. The materials were provided in electronic format suitable for agency partners to place on their individual websites. This information consisted of: Aerials with proposed alternatives and potential impacts Fact Sheets suitable for a mailer and handout at the PIMs. The Fact Sheet included the project purpose and need, summary of the project design criteria, features and relevant facts, and a project map Core Team representatives attended the meetings and were available to address questions. The team also took notes summarizing the general comments, and reviewed written comments. A summary document of the public comments was prepared for the file records. For those comments requesting/warranting a response, written responses were drafted for the Core Team to reply. An interactive and comprehensive public involvement process with the study team and stakeholders served as a valuable tool in identifying project information needs and areas of interest in the community. Comments received through letters, s, and phone calls were routed to the appropriate study team member for a response in a timely manner. A Public Involvement representative responded to inquiries regarding general information (i.e. meeting dates, locations, etc). Messages leaving contact information were added to project contact database, but did not receive a specific response. Copies of agency and public involvement documents, including correspondences, comment forms, and s have been organized and included in the Appendix. 8-4