A Region of Incredible Opportunity.
|
|
|
- Jonathan Lynch
- 5 years ago
- Views:
Transcription

1


2 A Region of Incredible Opportunity. Exciting things are happening across Hampton Roads. New collaborations and new connectivity investments in technology, transportation infrastructure and the Port promise to further unlock the region s potential. Quality transit in another important ingredient for regional success. 2

3

4 Great regions are multi-modal. For decades, little has changed with Hampton Roads core transit network. There is no true regional system. Bus routes traverse the region, but they are significantly fragmented in days and hours of service. Under current conditions, it should be no surprise that only 1 to 2 percent of travel regionally is happening on transit.
5 Benefits of Great Transit
6 Barriers to Great Transit?
7 Barriers to Great Transit Old and unreliable buses Poor frequency and speed of travel Outdated technologies Inadequate customer amenities Poor accessibility Other
8 Criteria for Success A new transit investment program should meet several criteria: Thoroughly data-driven Evidence of public support Align with land-use plans supporting local and regional economies Rigorous cost evaluation Strategic prioritization and phasing Justify value in terms of returns on investment Fully supported by local governments whose citizens will be impacted by the improvements and funding sources used to make these investments.
9 Transit Development Plan Ten-year plan required by the Department of Rail and Public Transportation. Outlines existing transit service, plans for enhancements, future service and anticipated costs: Analyzing existing service, socioeconomic and demographic data to understand transit supply and demand throughout the region Guided by stakeholder and general public input A blueprint for investing in operational and capital improvements in a fiscally responsible manner Phased recommendations

10 Data-Driven As part of Transit Development Plan (TDP) activities, staff from HRT and local governments have been meeting to discuss and evaluate the efficiency and effectiveness of bus routes in Chesapeake, Hampton, Newport News, Norfolk, Portsmouth, and Virginia Beach.
11 TDP Planning Concepts Adjusting frequency of existing routes Adjusting service hours of existing routes Realigning existing routes Incorporating new routes Changing length of route Route eliminations Potential core network
12 TDP Public Input Customer Services, including new digital tools for trip planning Service and Customer Amenities, including better frequency, adding routes and stops in key locations, enhancing opportunities for efficient transfers, and additional bus shelters. Consistent Service Hours between cities and expanded evening and weekend hours. On-Time Performance and clean, well-maintained buses.
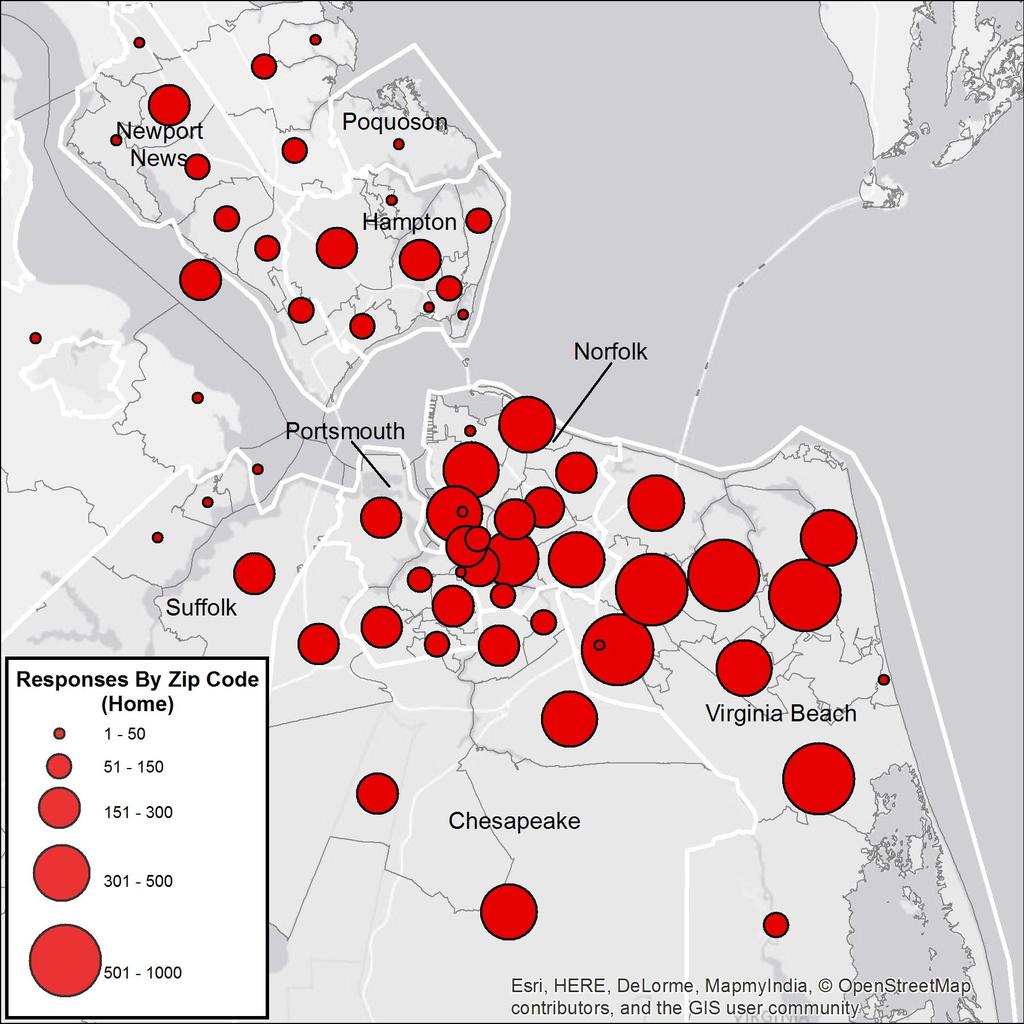
13 Public Input Regional CHR Survey (2014) Over 13,800 participants City # Virginia Beach 4,337 Norfolk 3,354 Portsmouth 915 Williamsburg 172 Yorktown 128 Chesapeake 1705 Hampton 737 Newport News 849 Suffolk 333 This table shows distribution of results across cities where the majority of participants reside.
14 14
15 Regional CHR Survey (2014) How much of a priority are the following transportation improvements? (0 = Not a priority, 100 = Highest priority) Add public transit options (light rail or similar service, bus, ferry, bike paths, etc.) 72.5 Increase and expand public transit routes 70.8 Integrate transit into major road, bridge and tunnel projects 67.8 Improve bridges 65.0 Widen highways and tunnels 61.9 Add more bridges and tunnels
16 Regional CHR Survey (2014) Among factors that prevent them from using public transit, respondents most often cited: Commutes that are not more convenient compared to other modes Long travel times Frequency and availability of services that are not sufficient
17 Regional CHR Survey (2016 Update) How much of an impact do you believe an improved public transit system would have on local economic growth? (0 = Extremely negative impact, 50 = No impact, 100 = Extremely positive impact) Average impact survey (n = 13,830), avg. impact rating was Update (n = 2,640)

18 Regional CHR Survey (2016 Update) Out of every dollar our local governments invest in transportation in Hampton Roads, how many cents would you guess IS CURRENTLY spent on public transportation such as ferries, buses, and light rail? Out of every dollar our local governments invest in transportation in Hampton Roads, how many cents do you believe SHOULD BE spent on public transportation such as ferries, buses, and light rail? Mean Current Allocation Mean Ideal Allocation

19


.")
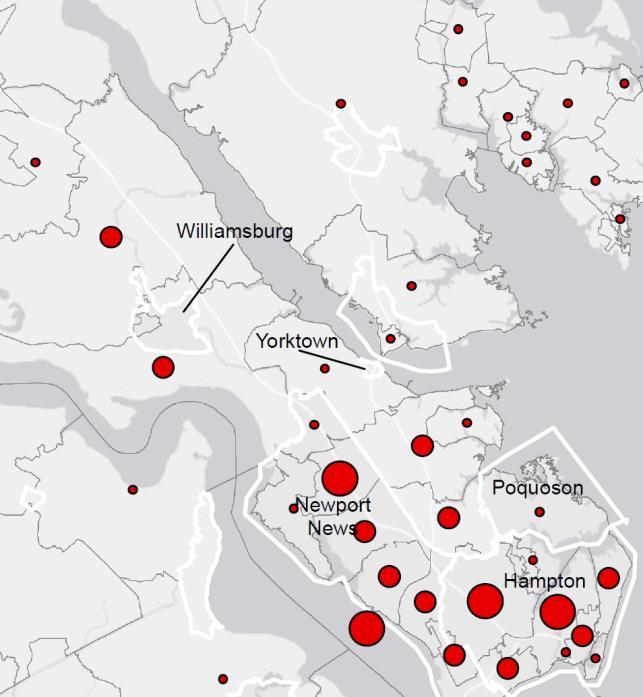
20 Transit Propensity Travel Flows Connectivity Gaps Indexed data sets (population, employment, etc.) indicate areas more or less ideal for potential Core 20 transit. Regional travel demand model shows major commuting flows (all modes). Data overlays indicate gaps (low levels, lack of connections, new service areas) to be corrected with Core 20 network.

21 A reliable core bus network Better regional connectivity Better access to jobs and job training New buses, technology and basic customer amenities More transit riders benefits everyone Great regions have great transit systems.

22 Transformational Potential Connect more workers to jobs Improve access to education and workforce training Support current and new businesses Meet demand for new transportation options across all population segments Help unleash the region s potential
 300% increase in colleges/universities connected (10 total) 8 central business")

23 Impacts 312% increase in population within ¼ mile of network compared to current routes (267,000 total) 300% increase in colleges/universities connected (10 total) 8 central business districts and over 22 major attractions Increase of 141,000 jobs accessible within ¼ mile of new network. 350% increased in connections to hospitals and centers of bio-medical research (9 total).

24 Features New buses with better frequency and reliability

25 Features State-of-the-art technology and customer amenities

26 Features Simpler ways to access the system with realtime information


27 Transit Funding (Operating) Hampton Roads (HRT) Nationally

28 Regional underinvestment FY18 State Transit Capital Program Also, $0.00 dedicated regional transit funding
29 Core 20 Investment Modeling Year 1 Year 10 Core 20 (Operations and Maintenance) ADA / Paratransit (Vehicles & Operations) Technology and Customer Amenities Contingency Reserve ($ millions) Annual Bus Replacement Program
30 Next Steps Clear path on Bus State of Good Repair Foundation for reliable, consistent service system-wide Modest flexibility to be responsive of new service requests Builds base for core network Clear path on Technology and Customer Amenities that would have positive system-wide impacts Opportunity to prioritize and phase Core 20 Operations in collaboration with partners Establish new transit funding model (avg. $15 million annually for state of good repair and approx. $35 million for ongoing operations).
31