Supply Chain and Real Estate Trends
|
|
|
- Susanna Harrell
- 5 years ago
- Views:
Transcription

1 Supply Chain and Real Estate Trends And why it s good news for Salt Lake City! Kelly Gray Jones Lang LaSalle
2 What am I going to talk about? How and why companies choose locations How does Salt Lake City stack up? Trends in: - Supply Chain Network Design - Location Selection - Reshoring of Advanced Manufacturing - Silicon Valley How are those trends effecting Salt Lake City? 2

3 Integrated Intelligence Real estate makes up for only a small portion of total operating costs And therefore only a portion of real estate decision making Incentives Operating cost Brandand image Competitive environment Political stability Future growth Portfolio optimization Labor Taxes The Right Decision Real estate Infrastructure Business climate Utilities Environmental issues Logistics Supply Chain Strategy 3


4 Representative clients & experience Tenant Representation/ Consulting Location Selection: Agency: Consulting - RLS SM : Walmart Miller Coors Prologis Roll Global FedEx Harbor Freight Tools Duke Realty JP Morgan Chase P&G Under Armour Northern Builders CenterPoint Properties Exel Logistics/ DHL Cloverhill Bakeries Area Property Partners Majestic Realty Navistar, Inc. M. Block & Sons The Stratford Group Chicago Sun Times Northern Tool & Equipment BPG Properties Walgreen Co. Ris Paper Conor Commercial Golden State Foods RJW Transportation Lincoln Property Company Fonterra Foods Panera Bread Company Pertucci Development Flowserve Ambius Covington Capital Tesla Verizon 4


5 Where I m from. St. Louis, MO University of Missouri Moved to Chicago CH Robinson 2 years Joined Staubach April 2008 Location consulting and supply chain network design Global Industrial Exchange Program Brazil 4Q14 Moved to Silicon Valley office 5
6 Salt Lake City The Silicon Slopes! Population of Salt Lake County 1,091,000 Population under 18 years 28.3% (US Average 23%) Low average age 30 Projected Year Population Growth Rate 10.8% Low unemployment 3-4% Relatively low cost of living Incentives Ease of doing business Impacts Effecting SLC: Increased localization of distribution Advanced manufacturing returning to U.S. Companies leaving higher cost West Coast markets 6


7 Supply Chain Network Strategy How many facilities should we have? Where? Full scope Network Strategy has many variables: Inbound transportation Outbound transportation Facility size Product types Inventory levels AND MORE! 7

8 Latest trends in Supply Chain Network Strategy 250 mile radius 20 DCs = 86% of Total Population and 100% of Top 250 Cities Salt Lake City 2,800,000 People in 250 Mile Radius 8

9 FedEx Ground Hub Network 9


10 Industrial location selection Best location? Lowest cost? WORKFORCE / COMMUNITY LOCATION MODEL RESULTS TRANSPORTATION WAGE RATES REAL ESTATE COSTS INCENTIVES TOTAL Paramount Logistics Park Tejon Ranch Commerce Center Moreno Valley Las Vegas Reno Stockton Goodyear OPERATING COST MODEL RESULTS Goodyear $13,751,110 $10,816,320 $5,578,875 Stockton $12,021,327 $12,129,207 $5,040,000 Reno $16,500,926 $11,120,347 $4,799,250 Las Vegas $13,594,902 $11,470,243 $5,287,500 Moreno Valley $6,567,958 $11,723,445 $5,512,500 Tejon Ranch $7,088,415 $11,394,766 $4,950,000 Paramount Logistics $7,522,483 $11,352,273 $4,528,125 -$5,000,000 $0 $5,000,000 $10,000,000 $15,000,000 $20,000,000 $25,000,000 $30,000,000 $35,000,000 TRANSPORTATION WAGE RATES REAL ESTATE COSTS INCENTIVES 10

11 Cost-Service Trade-Offs There is a trade-off between: - Proximity to population - Real estate cost and quality - Transportation costs and infrastructure quality - Workforce costs and demographics - Taxes and Incentives 11


12 Analytical Factors SUPPLY CHAIN ANALYTICS LABOR COST VARIABILTIY LABOR MARKET MODELING STATE INCENTIVE ENVIRONMENT 12
13 Operating Cost Models Quantitative considerations, such as: Transportation costs, wage rates, real estate, & taxes and Incentives Annual Operating Costs $15,000,000 $15,000,000 $13,000,000 $11,827,971 $13,000,000 $11,000,000 $9,000,000 $7,000,000 $5,000,000 $3,000,000 $1,000,000 $10,021,940 $10,299,546 $10,341,225 $9,749,522 $8,684,336 $8,866,919 $6,670,000 $5,752,500 $6,465,000 $5,310,000 $5,310,000 $5,451,763 $392,170 $392,170 $370,196 $441,131 $420,249 $414,864 $3,983,315 $4,307,830 $4,713,049 $5,236,113 $5,236,113 $5,462,279 $6,300,000 $404,906 $6,223,290 $10,453,088 $5,637,500 $370,167 $5,545,647 $11,000,000 $9,000,000 $7,000,000 $5,000,000 $3,000,000 $1,000,000 $(1,000,000) $(3,000,000) Baltimore PRINCIPIO BUSINESS PARK NORTH EAST LOGAN TOWNSHIP GREENCASTLE MARTINSBURG SPOTSYLVANIA SANDSTON $(1,000,000) $(3,000,000) $(5,000,000) *Hypothetical results TRANSPORTATION WAGE RATES REAL ESTATE INCENTIVES TOTAL SCORE $(5,000,000) 13
14 Location Selection Models Quantitative as well as non-financial considerations, such as: Demographics, Workforce size and quality, rates of unionization, & infrastructure quality Location Selection Model Score Reno Stockton Lathrop Fremont San Jose Oakland Richmond Napa W Sacramento 0.0 *Hypothetical results Subtotal WORKFORCE/ COMMUNITY Subtotal WAGE RATES Subtotal TRANSPORTATION Subtotal REAL ESTATE Total Score 14
15 Latest trends in Location Selection Reshoring In BCG s most recent survey of U.S.-based manufacturing executives, completed in August of last year, 54% of the respondents said they were actively considering relocating production from China to the U.S., up from 37% in Some 16 percent of the companies said they already had relocated at least some manufacturing capacity from China to the United States more than double the number (7%) reported in Airbus Mercedes Benz Embrear Shinola Walmart Medical devices, 3D printing, high-tech complex goods (cars!), chips Lead time Higher product quality and consistency Rising offshore wages Skilled workforce Freight costs Image of being Made in USA Lower inventory levels, better turns Better responsiveness to changing customer demands Minimal intellectual property and regulatory compliance risks Improved innovation and product differentiation Local tax incentives 15
16 What s going on in the Silicon Valley/ Bay Area? Rents at pre-recession highs All submarkets tapped out 7,000,000 6,000,000 5,000,000 4,000,000 3,000,000 2,000,000 1,000,000 0 Vacant Square Footage $0.80 $0.75 $0.70 $0.65 $0.60 $0.55 $0.50 $0.45 $


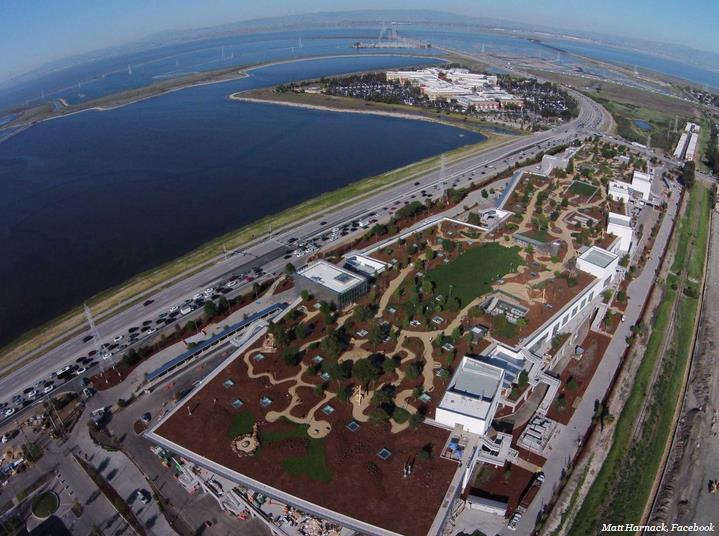
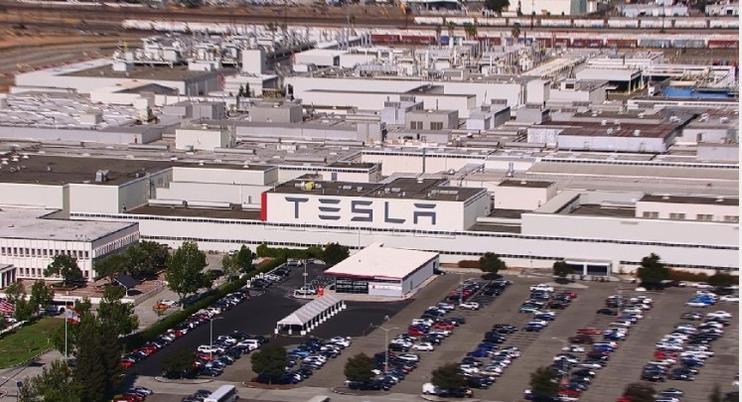
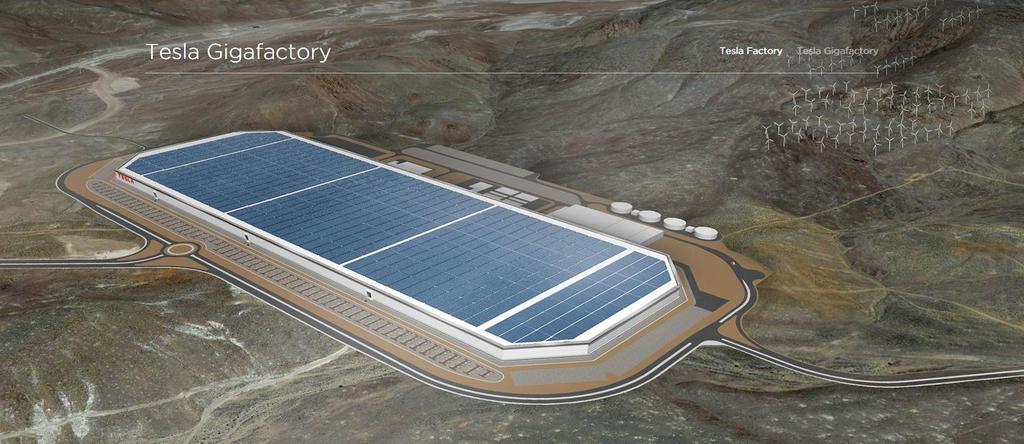
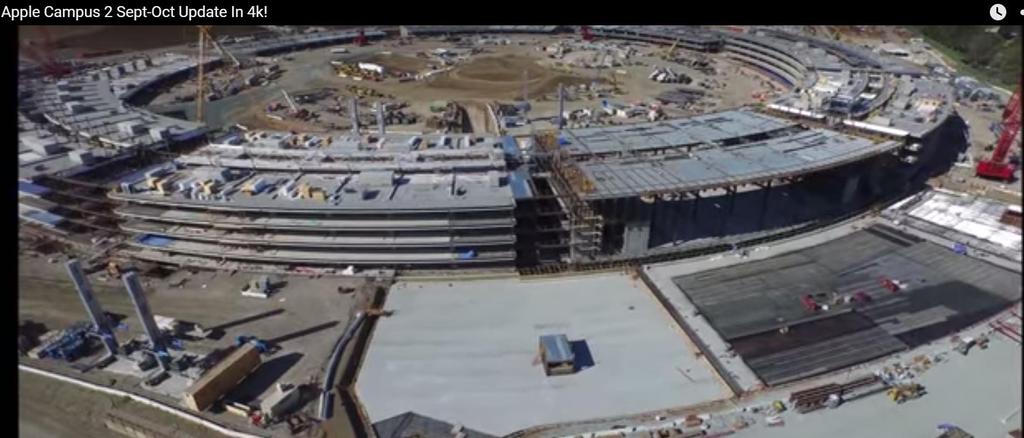
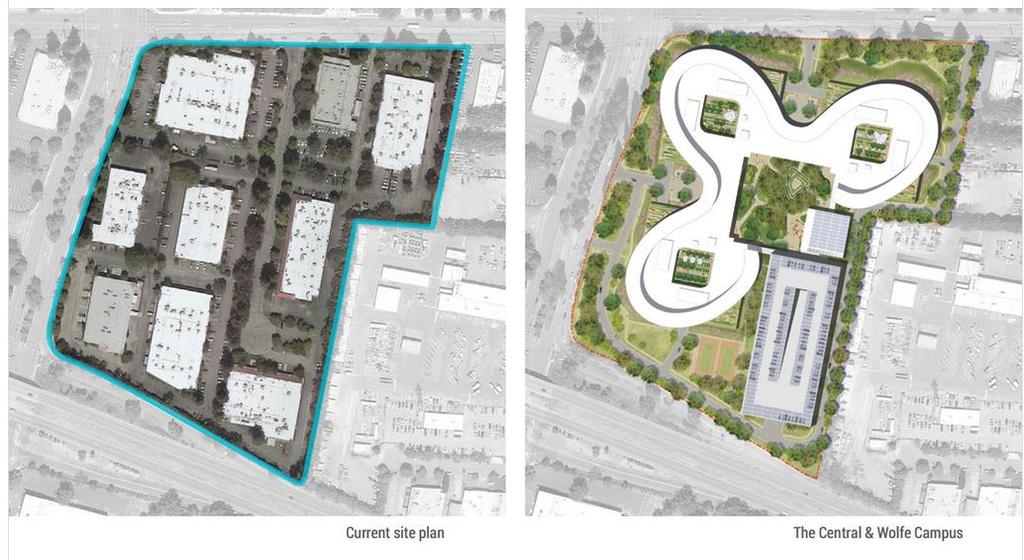
17 Silicon Valley Industrial Market Shrinking market Facebook 3 million SF Just displaced another 1 million SF of industrial Tesla 5 million Sffactory 500,000 SF HQ Gigafactory 5 to 10 million SF Apple - Cupertino + 3 million SF Building Apple Campus 2 2 million SF Google +/ million Googleplex +/- 3 million SF The Quad +/- 2.5 million Mayfield Mall Downtown MORE????? 17
18 Silicon Valley Industrial Market Shrinking market 72,000,000 Total inventory (s.f.) 2.8 million SF Reduction 70,000,000 68,000,000 66,000,000 64,000, Q Q Q Q Q Q Over the past 24 months, at least 2.8 MSF of industrial product has been demolished, replaced by new Class A office campuses and high-density residential housing 18


19 19
20 20

21 21
22 22

23 23
24 24
25 25
26 26

27 Back to the math! Annual Operating Costs $15,000,000 $13,000,000 $11,000,000 $10,021,940 $10,299,546 $10,341,225 $9,749,522 $8,684,336 $8,866,919 $9,000,000 $6,465,000 $6,670,000 $5,310,000 $5,310,000 $5,752,500 $7,000,000 $5,451,763 $5,000,000 $392,170 $392,170 $370,196 $420,249 $414,864 $441,131 $3,000,000 $3,983,315 $4,307,830 $4,713,049 $5,236,113 $5,236,113 $5,462,279 $1,000,000 $11,827,971 $10,453,088 $6,300,000 $5,637,500 $404,906 $370,167 $6,223,290 $5,545,647 $15,000,000 $13,000,000 $11,000,000 $9,000,000 $7,000,000 $5,000,000 $3,000,000 $1,000,000 LABOR COST VARIABILTIY $(1,000,000) $(3,000,000) $(5,000,000) Baltimore PRINCIPIO BUSINESS PARK NORTH EAST LOGAN TOWNSHIP GREENCASTLE MARTINSBURG SPOTSYLVANIA SANDSTON TRANSPORTATION WAGE RATES REAL ESTATE INCENTIVES TOTAL SCORE $(1,000,000) $(3,000,000) $(5,000,000) LABOR MARKET MODELING Location Selection Model Score STATE INCENTIVE ENVIRONMENT Reno Stockton Lathrop Fremont San Jose Oakland Richmond Napa W Sacramento Subtotal WORKFORCE/ COMMUNITY Subtotal WAGE RATES Subtotal TRANSPORTATION Subtotal REAL ESTATE

28 Tech job creation over past year Source Bureau of Labor Statistics Goldman Sachs 9 of 11 Business Units in SLC Overstock.com HQ Adobe 28
29 Cost of Living Calculator 29
30 Forbes Top Cities for Doing Business Denver, CO 2. Raleigh, NC 3. Portland, OR 4. Provo, UT 5. Atlanta, GA 6. Seattle, WA 7. Salt Lake City, UT 30
31 Salt Lake City The Silicon Slopes! Young population High population growth Low unemployment 3-4% Relatively low cost of living Incentives Ease of doing business Impacts Effecting SLC: Increased localization of distribution Advanced manufacturing returning to U.S. Companies leaving higher cost West Coast Markets 31
32 Kelly Gray Vice President Silicon Valley Thank you COPYRIGHT JONES LANG LASALLE IP, INC. 2015