2018 MIAMI-DADE COUNTY
|
|
|
- Sharleen Shanna Gray
- 5 years ago
- Views:
Transcription


1 2018 MIAMI-DADE COUNTY FREIGHT PLAN UPDATE PREPARED FOR Miami-Dade Transportation Planning Organization PREPARED BY MARLIN Engineering, Inc SW 288th Street, Suite 208 Miami, FL P: i JUNE 2018
2 Miami-Dade Transportation Planning Organization 2018 Miami-Dade County Freight Plan Update GPC-VI-19 Final Report June 2018 Prepared for: Miami-Dade Transportation Planning Organization (TPO) 111 NW 1 st Street Suite 920 Miami, FL Prepared by: MARLIN Engineering, Inc NW 66 TH Avenue, Suite 106 Plantation, FL In Association with: Cambridge Systematics Inc W Commercial Boulevard Ft. Lauderdale, FL ii
3 TABLE OF CONTENTS 1.0 Background Freight Goals, Objectives and Measures Goals and Objectives Measures Summary: Goals, Objectives, and Measures Miami-Dade Freight Transportation System and Cargo Flows System Overview Regional Context Highways Railroads Waterways Seaport Airports Miami-Dade Logistics Infrastructure Freight and Industrial Property Trends and Developments Trends in Warehouse Affordability and Pricing Evolving Warehouse Needs New Developments and Future Growth Foreign Trade Zones Freight Security and Cargo Theft Cargo Security and Theft Prevention Impacts of Cargo Theft Existing Efforts Role of Truck Parking Background Hours of Service Miami-Dade Truck Parking Studies FDOT s Truck Parking Availability System (TPAS) Current Parking Availability Future Developments Freight System Performance Background Miami-Dade Freight Performance Targets i
4 7.3 FDOT Statewide Initiatives Freight System Needs and Priorities Seaport Projects Airport Projects Railroad Projects Highway Projects Findings and Strategies ii
5 LIST OF FIGURES Figure Miami-Dade County Freight System Figure 3.2 National Highway Freight Network Designation in Miami-Dade County Figure 3.3 Regional Context of Miami-Dade Freight Network Figure AADT on Miami-Dade Highway System Figure AADTT on Miami-Dade Highway System Figure Truck Percentage on Miami-Dade Highway System Figure Miami-Dade County Freight Rail Network Figure Miami-Dade County Rail Network Strategic Railroad Crossing Index Map Figure 3.9 Iris and Northwood Rail Connections Figure Proposed US 27 Rail Corridor Figure Short Tons Moved Through the Miami River Figure Historic Cargo Movements by Tonnage and TEU through PORTMiami Figure 3.13 Traffic (AADT) and Truck (AADTT) Data for PORTMiami Bridge Figure 3.14 Traffic (AADT) and Truck (AADTT) Data for PORTMiami Tunnel Figure 3.15 PORTMiami Container Rail Moves Trends Figure PORTMiami Projected Growth by TEUs Figure 3.17 PORTMiami Potential Inland Terminal Locations Figure Miami International Airport Trade with Partners Figure Total Freight Value through Miami International Airport Figure 3.20 Historic Total Freight Tonnage through Miami International Airport Figure Estimated Growth of Cargo Tonnage at Miami International Airport Figure 3.22 Depiction of Ultimate Layout of MIA CORE Plan Figure 4.1 Miami-Dade County Land Use Figure 4.2 Warehouse Net Absorption and Asking Rent Figure Overall Warehouse Vacancy Figure Industrial Submarkets of Miami-Dade County Figure 4.5 New Industrial Warehousing Developments Underway Figure Top 10 US States for Cargo Theft, Figure 6.1 Golden Glades Interchange Truck Travel Center Concept Figure Truck Parking Locations in Miami-Dade County Figure 7.1 Info Graphic for PTI/TTTR Index Figure 7.2 Miami-Dade County Historical NPMRDS Data Figure 7.3 Miami-Dade County Highway Stakeholder TTTR Index Dashboard Figure Multimodal Mobility Performance Measures Matrix Figure 7.5 FDOT District 6 Subarea Freight Planning Studies iii
6 Figure Short Term Freight Direct Highway Projects ( ) Figure Medium Term Freight Direct Highway Projects ( ) Figure Long Term Freight Direct Highway Projects ( ) LIST OF TABLES Table 2.1 Miami-Dade Freight Goals and Objectives... 7 Table 3.1 Strategic Rail Crossing Crash, Train and Traffic Data Table Atlantic Intracoastal Waterway Cargo Volumes Jacksonville, FL to Miami, FL Table 4.1 Miami-Dade Freight-Related Land Use Table Comparison of Vacancy Rates and Asking Rents by Geography Table Miami-Dade Industrial Market Submarket Analysis Table Summary of Hours of Service Regulations Interstate Table Summary of Hours of Service Regulations Intrastate Table Truck Parking Locations in Miami-Dade County Table TTTR Target for Miami-Dade County Interstates Table Seaport Project Needs Table Airport Project Needs Table Railroad Project Needs Table Freight Direct Highway Projects Table Freight Direct Highway Projects (continued) Table Freight Direct Highway Projects (continued) Table Freight Direct Highway Projects (continued) Table Freight Direct Highway Projects (continued) Table Freight Direct Highway Projects (continued) Table Freight Related Highway Projects Table Freight Related Highway Projects (continued) Table Freight Related Highway Projects (continued) Table Freight Related Highway Projects (continued) iv
7 LIST OF APPENDICES Appendix A - Miami-Dade Transportation Planning Council Resolution #11-18 Supporting US 27 as Part of NHFN Appendix B - PORTMiami Inland Terminal Concepts (From Doral Subarea Freight Plan) Appendix C - Request for SIS Designation for Miami-Opa Locka Executive Airport Appendix D - Miami-Dade County Speed Scans NPMRDS v
8 INDEX OF ACRONYMS 2040 TPO LRTP Year 2040 Transportation Planning Organization Long Range Transportation Plan 2045 TPO LRTP Year 2045 Transportation Planning Organization Long Range Transportation Plan AADT AADTT AAGR AIFSS ASF CBP CFR CCTV CMAQ CORE CRFCs CUFCs DOTs DTPW EFTMS ELD FAST FASTLANE FDOT FEC FECI FHWA FLZ FRA FRATIS FTAC FTE FTP FTZ GA GOMs HEFT HOS HSIP HST ICTF ICWW Average Annual Daily Traffic Average Annual Daily Truck Traffic Average Annual Growth Rates Automated International Flight Services Station Alternative Site Frameworks Customs and Border Protection Code of Federal Regulations Closed Circuit Television Congestion Migration and Air Quality Improvement Program Cargo Optimization, Redevelopment and Expansion Plan Critical Rural Freight Corridors Critical Urban Freight Corridors Departments of Transportation Department of Transportation and Public Works Electronic Freight Theft Management System Electronic Logging Device Fixing Americas Surface Transportation Act Fostering Advancements in Shipping and Transportation for the Long Term Achievement of National Efficiencies Florida Department of Transportation Florida East Coast Railroad Florida East Coast Industries Federal Highway Administration Freight Logistics Zone Federal Railroad Administration Freight Advanced Traveler Information System Freight Transportation Advisory Committee Florida s Turnpike Enterprise Florida Transportation Plan Foreign Trade Zones General Aviation Goals, Objectives and Measures Homestead Extension of Florida s Turnpike Hours of Service Highway Safety Improvements Program Homestead Air Reserve Airport Intermodal Container Transfer Facility Intercostal Waterway vi
9 ILC INFRA ITS MAP-21 MIA MPO MSF NCTTF NHFN NHFP NHPP NPMRDS AOBRBs OPF PACE PHFS PSF PTI ROW SAT SCIC SFRC SHS SIB SIS SR SU STBG TDM TEU TIGER TMA TMB TPAS TPO TSA TTTR TRIP UCR US X51 Intermodal Logistics Center Infrastructure for Rebuilding America Intelligent Transportation System Moving Ahead for Progress in the 21 st Century Act Miami International Airport Metropolitan Planning Organization Millions of Square Feet National Commercial Vehicle and Cargo Theft Protection Task Force National Highway Freight Network National Highway Freight Program National Highway Performance Program National Performance Management Research Data Set Automatic Onboard Recorders Opa Locka Executive Airport Planning and Conceptual Engineering Primary Highway Freight System Price per Square Foot Planning Time Index Right Of Way Study Advisory Team Supply Chain Intelligence Center South Florida Rail Corridor State Highway System State Infrastructure Banks Strategic Intermodal System State Road Federal Surface Transportation Funds Surface Transportation Block Grant Program Transportation Demand Management Twenty Equivalent Unit Transportation Investment Generation Economic Recovery Transportation Management Area Kendall Executive Airport Truck Parking Availability System Transportation Planning Organization Transportation Security Administration Truck Travel Time Reliability Transportation Regional Incentive Program Uniform Crime reporting Program United States Miami Homestead General Aviation Airport vii
10 1.0 BACKGROUND 1
11 1.0 Background This Freight Plan update is sponsored by the Miami-Dade Transportation Planning Organization (TPO). The purpose of the report is to highlight the importance of freight mobility in Miami-Dade County, to update the County Freight Plan from 2014 to 2018, to develop an application for a Miami-Dade County designated Freight Logistics Zone (FLZ) and to coordinate with freight stakeholders to prepare an updated list of transportation needs. The list of projects developed in this update will be considered for funding in the development of the TPO s Year 2045 Long Range Transportation Plan (2045 TPO LRTP). Miami-Dade County is the most populous county in the state with a 2017 population of 2,751,796 million people, per the United States Census. The County is home to a well-established and expanding freight transportation system that is the cornerstone of the regional and statewide economy, providing goods and services to Florida s largest consumer market and through major sea and air gateway connections to the global economy. Miami-Dade County is also home to a multi-cultural community with an economy dominated by international trade, tourism, agriculture, mining and natural resources. PORTMiami is one of the largest container ports in Florida and is known as the cruise capital of the world. Miami International Airport (MIA) is dominant in terms of air cargo tonnage in Florida (81 percent in 2014) and is the world s largest gateway to Latin America and the Caribbean. The Miami River waterway, recently designated as an Emerging Strategic Intermodal System (SIS) Waterway by the Florida Department of Transportation (FDOT), provides key niche waterborne cargo services to smaller ports in the Caribbean Basin and supports an active industrial core along the river corridor. The Florida East Coast Railway (FEC), the South Florida Rail Corridor (SFRC) and CSX Transportation Railroad serve Miami-Dade County by providing intermodal, passenger and carload services connecting the County to the region, state and all of North America. The county has a robust network of roadways providing regional mobility as well as gateways to other Florida counties and more distant hinterland markets. These transportation facilities complement the largest warehouse/distribution center agglomeration in the State as well as the international banking and brokerage infrastructure that facilitates international trade activities for the region. Today, the core freight activity in the county could be described as a freight beltway that extends from PORTMiami in the east to the rock quarries in the west. The beltway comprises PORTMiami, the Miami River Waterway, MIA, the FEC rail yard, the FEC and CSX railroads, the major warehouse districts in Doral and Medley, and major east/west roadways including State Road (SR) 836, United States (US) 27 and SR 112. This freight belt is further supported by major north-south roadways such as I-95, SR 821/Homestead Extension of Florida s Turnpike (HEFT), SR 826/Palmetto Expressway and SR 992/Krome Avenue that further distribute goods to adjacent counties and beyond. 2

12 Miami-Dade s freight infrastructure has undergone significant improvement and expansion to position the region for future growth opportunities. Much of that growth will be attributed to the recent deep dredging of the port channel to a 50 foot depth and the widening of the Panama Canal. The new Panama Canal Source: Marketwire.com locks opened on June 26, 2016 and just two weeks later, on July 9, 2016, PORTMiami officially joined the Neo-Panamax era when the Chinese ship MOL Majesty became the first ship to arrive at the port after transiting the newly expanded Panama Canal. The ship measured almost 1,000 feet long and 150 feet wide - larger than any cargo ship PORTMiami has ever seen. Like the MOL Majesty, shown above at PORTMiami, Neo-Panamax ships can carry three times the cargo of previous generations of vessels. Miami-Dade County and stakeholders have prepared themselves to handle mobility to/from the Port and MIA and to compete for increases in trade by: constructing the PORTMiami Tunnel to connect PORTMiami directly to the Interstate System; connecting the MIA cargo operations area to the Doral warehousing areas on the NW 25 th Street Viaduct; rehabilitating rail service to PORTMiami and connecting to the on-port Intermodal Container Transfer Facility (ICTF); developing an intermodal logistics center in Hialeah; replacing the SR 826/SR 836 interchange; and participating in a USDOT sponsored Freight Advanced Traveler Information System (FRATIS). With these improvements complete, the underlying premise of this Update is to identify existing and future freight transportation needs in order to develop a list of freight-focused and freight-related projects for consideration in the development of the TPO 2045 LRTP. This list will identify projects for near-term (2020 to 2025), mid-term (2025 to 2030), and long-term (2031 to 2045). It is important to note that the 2045 LRTP is a cost constrained plan and that projects needs are expected to exceed available funding. However, inclusion in the plan supports opportunities for additional funding through state and federal grants. This project was guided by a Study Advisory Team (SAT) including: CSX Transportation 3
13 Florida Department of Transportation District 6 Florida East Coast Railway Florida s Turnpike Enterprise Miami-Dade County Aviation Department Miami-Dade County Department of Transportation and Public Works Miami-Dade Expressway Authority PORTMiami 4
14 2.0 FREIGHT GOALS, OBJECTIVES AND MEASURES 5
15 2.0 Freight Goals, Objectives and Measures Goals, Objectives and Measures (GOMs) for this update were developed utilizing the freight GOMs from the 2040 Miami-Dade County Long Range Transportation Plan (2040 TPO LRTP), the FDOT State Freight Plan as identified in the 2017 Motor Carrier System Plan, and Performance Measures required in Title 23 Code of Federal Regulations (CFR). Per Title 23 CFR (d)(4) it is required that the TPO integrate in the transportation planning process, directly or by reference, the goals, objectives, performance measures, and targets described in the host state transportation plans, including the State Freight Plan. 2.1 Goals and Objectives The TPO Goals from the 2040 LRTP and the State Freight Plan Goals are very similar. The FDOT State Freight Plan - Motor Carrier System Plan Goals are specific to freight and include: Safety and Security: Identify, support, and implement freight highway safety improvements and initiatives, Agile, Resilient, and Quality Infrastructure: Continue to invest in quality infrastructure that can be adapted to meet the needs of future freight vehicles and technology, Efficient and Reliable Mobility: Increase operational efficiency of goods movement and maintain reliable mobility for trucks, Economic Competitiveness: Support Florida's global competitiveness and increase the flow of domestic and international trade, More Transportation Choices: Increase the number of quality options for moving freight to, from, and within Florida, Environment and Conserve Energy: Balance the need for environmental protection and conservation with seeking motor carrier efficiencies, Quality Places: Coordinate early and often with local communities to ensure mobility for trucks that is consistent with local and regional priorities. The 2040 TPO LRTP Goals cover all modes and freight-specific objectives are included in the plan as a subset of the Goals. The 2040 TPO Goals include: Improve the Transportation System and Travel Increase the Safety of the Transportation System for All Users Support Economic Vitality Protect and Preserve the Environment and Quality of Life Promote Energy Conservation Enhance the Integration & Connectivity of the System for People and Freight Across and Between Modes of Transportation Optimize Sound Investment Strategies for System Improvement and Management/Operation 6
16 Maximize and Preserve the Existing Transportation System For the purposes of developing freight specific Goals and Objectives for this Update, the Goals from the State Freight Plan were used as the framework and all the objectives from the State Freight Plan and the freightspecific objectives from the 2040 TPO were blended as shown in Table 2.1. GOAL AREAS 1. Safety and Security 2. Agile, Resilient, Quality Infrastructure 3. Efficient and Reliable Mobility 4. Economic Competitiveness 5. More Transportation Choices 6. Environment and Conserve Energy 7. Quality Places Table 2.1 Miami-Dade Freight Goals and Objectives OBJECTIVES Improve safety on facilities and in multi-modal operations Provide more safe and secure places for truck parking, both on and off the Interstate System Prevent and mitigate cargo-related security risks. Ensure security at ports, airports and major intermodal centers/terminals Preserve the existing State Highway System to maintain a state of good repair Identify and implement the best available technologies and innovations to improve the reliability and efficiency of the transportation system Collaborate with stakeholders to collect data relevant to motor carrier operations Monitor truck weights and promote enforcement Ensure the efficiency and reliability of truck transportation connectivity Continue to work with stakeholders to fund projects consistent with industry priorities and build relationships Enhance mobility for freight by optimizing the functionality and efficiency of existing roadways Increase and improve freight access to airports and seaports Enhance the efficient movement of freight and goods Invest in PORTMiami infrastructure to further increase competitiveness for Port Panamax traffic Expand and optimize cargo-handling and related intermodal facilities Maximize use of State, Federal and Private Sector funding Increase the convenience of connecting between multiple modes of freight transportation Increase the mobility of the freight network through investment in transit, Transportation Demand Management (TDM) and managed lanes Plan and develop truck transportation infrastructure that protects the character of the natural environments and avoids or minimizes adverse environmental impacts Increase energy efficiency and diversity of transportationrelated energy sources Plan and develop freight transportation systems that reflect regional and community values, visions, and needs Educate the public on how trucks impact their daily lives 7
17 2.2 Measures Measures were developed by referencing and blending the 2040 LRTP Freight-specific Objectives and Measures and the FDOT State Freight Plan Objectives and Strategies. Measures were also modified based on the Federal Highway Administration (FHWA) performance rulemakings to implement the Transportation Performance Measurement framework established by Moving Ahead for Progress in the 21 st Century Act (MAP-21) and the Fixing America's Surface Transportation Act (FAST). There are many strategies and measures included in the GOMs, however the Federal requirements are very specific and require targets and performance reports. Collectively, the rules address challenges facing the US transportation system for freight and people, including: Improving safety, Maintaining infrastructure condition, Reducing traffic congestion, Improving efficiency of the system and freight movement, Protecting the environment, and Reducing delays in project delivery. The rules establish national performance measures indicating that State Departments of Transportation (DOTs) and Metropolitan Planning Organizations (MPOs) will establish targets for applicable measures. New and existing plans will document the strategies and investments used to achieve the targets. Progress toward the targets will be reported through new and existing mechanisms. Freight-specific measures include the Truck Travel Time Reliability (TTTR) Index for the Interstate System. The final rule is found in the Federal Register 82 FR 5970, January 18, Through MAP-21, Congress required FHWA to establish measures to assess performance in 12 areas, including freight movement on the Interstate. The measures consider factors that are unique to this industry, such as the use of the system during all hours of the day, and the need to consider more extreme impacts to the system in planning for on-time arrivals [Title 23 CFR ]. FDOT submitted the Florida Freight Plan in October of 2017 and recently issued their required 2 year and 4 year freight performance targets on May 18, 2018 along with all of the other required targets. The TPO must either support the state target or establish their own quantifiable 4 year target for freight within 180 days of the state target establishment (November 14, 2018). The State s target is based on the FHWA's National Performance Management Research Data Set (NPMRDS). This data set includes truck travel times for the full Interstate System and also includes the most significant roadways on the Miami-Dade County Freight Network. The NPMRDS will be used to measure and assess performance against the adopted FDOT freight targets. 8
18 2.3 Summary: Goals, Objectives, and Measures Supporting each objective are corresponding strategies to guide commercial motor vehicles efforts. Chapter 5 of the FDOT Motor Carrier Plan includes a matrix with lead and supporting roles defined at the strategy level. Assigning responsibility is intended to encourage the most appropriate offices and agency partners to follow through on each objectives while maintaining a holistic approach in accomplishing the several goals in this plan. GOAL 1 Safety and Security: Identify, support, and implement freight safety improvements and initiatives Objective 1.1: Improve safety on facilities and in multi-modal operations o Measure 1.1.1: Number of truck/rail/air cargo transportation-related incidents, injuries and fatalities o Measure 1.1.2: Level of investment in safety projects Objective 1.2: Provide more safe and secure places for truck parking, both on and off the Interstate System o Measure 1.2.1: Number of public truck parking spaces developed Objective 1.3: Prevent and mitigate cargo-related security risks. Ensure security at ports, airports and major intermodal centers/terminals o Measure 1.3.1: Airport, seaport and intermodal facilities have addressed security as part of their operations o Measure 1.3.2: Truck parking and staging area spaces built that have adequate lighting GOAL 2 Agile, Resilient and Quality: Continue to invest in quality infrastructure that can be adapted to meet the needs of future freight vehicles and technology Objective 2.1: Preserve the existing State Highway System to maintain a state of good repair o Measure 2.1.1: Percent of highway lane miles on the freight network programmed for resurfacing on high truck corridors Objective 2.2: Identify and implement the best available technologies and innovations to improve the reliability and efficiency of the transportation system o Measure 2.2.1: 2045 LRTP identifies the latest technologies and innovations in freight transportation improvements o Measure 2.2.2: Number of intelligent transportation system partnerships, studies, and pilot programs implemented on the freight network Objective 2.3: Collaborate with stakeholders to collect data relevant to motor carrier operations o Measure 2.3.1: Amount of availability of data and associated training o Measure 2.3.2: Lessen proprietary concerns regarding Florida's public records requirements 9
19 o Measure 2.3.3: Performance assessments prepared identifying freight impacts of new technologies or improvements o Measure 2.3.4: Increase standardization of freight data collection and reporting across the region Objective 2.4: Monitor truck weights and promote enforcement o Measure 4.5.1: Monitor and report level of overweight trucks at Weigh In Motion Stations GOAL 3 Efficient and Reliable Mobility: Increase operational efficiency of goods movement and maintain reliable mobility for trucks Objective 3.1: Ensure the efficiency and reliability of truck transportation connectivity o Measure 3.1.1: Review annual reports for Miami-Dade County freight network roadways using the FHWA Truck Travel Time Reliability (TTTR) Index data system to assess progress towards freight targets Objective 3.2: Continue to work with stakeholders to fund projects consistent with industry priorities and build relationships o Measure 3.2.1: Percent of funding programmed on the Freight Network o Measure 3.2.2: Percentage of funding dedicated to intermodal access to PORTMiami and Miami International Airport o Measure 3.2.3: Percentage of funding dedicated to SIS hubs, corridors and connectors o Measure 3.2.4: Number of projects that include intermodal connections Objective 3.3: Optimize the functionality and efficiency of existing roadways o Measure 3.3.1: Coordinate with the freight community on accurate and real-time information to motor carriers o Measure 3.3.2: Prepare quarterly reports of TTRI results for freight corridors utilizing the RITIS and NPMRDS databases o Measure 3.3.3: Coordinate with the USDOT and FDOT on developing enhanced reporting functions for real time data GOAL 4 Economic Competitiveness: Support Florida's global competitiveness and increase the flow of domestic and international trade Objective 4.1: Increase and improve freight access to airports and seaports o Measure : Highway lane and centerline miles within 1 mile of MIA, Miami-Opa Locka Executive Airport, Miami Kendall Executive Airport and PORTMiami Objective 4.2: Enhance the efficient movement of freight and goods o Measure 4.2.1: Level of intelligent transportation system investment within 1 mile of MIA, Opa Locka Airport, Miami-Kendall Executive Airport and PORTMiami 10
20 Objective 4.3: Invest in PORTMiami infrastructure to further increase competitiveness for Port Panamax traffic o Measure 4.3.1: Percentage of funding dedicated to PORTMiami Infrastructure Objective 4.4: Expand and optimize cargo-handling and related intermodal facilities o Measure 4.4.1: Percentage of funding dedicated to intermodal access to PORTMiami and Miami International Airport Objective 4.5: Maximize use of State, Federal and Private Sector funding o Measure 4.5.1: Dollar amount of private sector funding as a proportion of total cost of plan o Measure 4.5.2: Dollar amount of State and Federal funding as a proportion of total cost of plan GOAL 5 More Transportation Choices: Increase the number of quality options for moving freight to, from, and within Miami-Dade County Objective 5.1: Increase the convenience of connecting between multiple modes of freight transportation o Measure 5.1.1: Number of designated intermodal connectors and facilities Objective 5.2: Increase the mobility of the freight network through investment in transit and Managed Lanes o Measure 5.2.1: Level of investment in transit and managed lanes on the freight network and number of registered carpool/vanpool users on the freight network GOAL 6 Environment and Conserve Energy: Balance the need for environmental protection and conservation with seeking motor carrier efficiencies Objective 6.1: Plan and develop truck transportation infrastructure that protects the character of the natural environment and avoids or minimizes adverse environmental impacts o Measure 6.1.1: Coordinate environmental initiatives with stakeholders and partners o Measure 6.1.2: Investigate opportunities to safely move more cargo with greater efficiency and reduced emissions Objective 6.2: Increase the energy efficiency and diversity of transportation-related energy sources o Measure 6.2.1: Apply for Federal funding for signage and/or other notifications from highways to available alternative energy source stations o Measure 6.2.2: Support investment in alternative energy sources for freight vehicles and stations 11
21 GOAL 7 Quality Places: Coordinate early and often with local communities to ensure mobility for trucks that is consistent with local and regional priorities Objective 7.1: Plan and develop freight transportation systems consistent with regional and community values, visions, and needs o Measure 7.1.1: Participate in statewide and regional planning initiatives o Measure 7.1.2: Research off-peak delivery strategies and support collaborative solutions that balance the needs of all stakeholders Objective 7.2: Educate the public on how trade and logistics impact their daily lives o Measure 7.2.1: Develop resources to explain the connection between freight mobility and access to goods o Measure 7.2.2: Number of TPO Freight Transportation Advisory Committee (FTAC) meetings 12
22 3.0 MIAMI-DADE FREIGHT TRANSPORTATION SYSTEM AND CARGO FLOWS 13
23 3.0 Miami-Dade Freight Transportation System and Cargo Flows 3.1 System Overview Miami-Dade County has an extensive freight system encompassing all major modes of transportation. The modes complement one another to provide a smooth flow of goods throughout the County and connecting to the region and international destinations. The overall network includes a system of roadways, railways, waterways, connectors and freight hubs, many of which are designated as Florida SIS or Emerging SIS facilities. The SIS is Florida s highest priority network of transportation facilities important to the State's economy and mobility. It was adopted in 2003 to focus the State's limited transportation resources on the facilities most significant for interregional, interstate, and international transport of people and goods. The network was updated from the 2014 plan to include the Miami River designation as a SIS Emerging Waterway and the Miami-Kendall Airport as a SIS Airport. Figure 3.1 shows the extensive 2018 Miami-Dade County freight network. SIS designation is important because these facilities are the State's highest priority for transportation capacity investments and are the primary focus for implementing the Florida Transportation Plan (FTP), the State's long-range transportation vision and policy plan. The current SIS incorporates all aspects of freight needs: commercial airports, deep-water seaports, rail terminals and corridors, waterways, and highways. Within Miami-Dade County, the following facilities have been designated as part of the SIS: Airport: Miami International Airport and Miami-Kendall Executive Airport Railyard: FEC Hialeah Yard Seaport: PORTMiami Waterway: Miami River (Emerging SIS) Roadways: Designated highways consist of Interstates, toll roads/expressways, and other key State highways as illustrated in Figure 3.1 Connectors: Each of the freight hubs have roadway, waterway and/or railway connectors designated to provide access to the SIS corridors. The FAST Act requires the FHWA Administrator to establish a National Highway Freight Network (NHFN) to strategically direct Federal resources and policies toward improved performance of the NHFN. This network is the focus of funding under the National Highway Freight Program (NHFP) and a significant funding target under the Fostering Advancements in Shipping and Transportation for the Long- term Achievement of National Efficiencies (FASTLANE) Grants Program (Nationally Significant Freight and Highway Projects Program) (23 USC. 117). The NHFN consists of the following four subsystems: (1) the Primary Highway Freight System (PHFS); (2) those portions of the Interstate System not part of the PHFS; 14

24 Figure Miami-Dade County Freight System Source: Marlin Engineering Inc. 15
25 (3) Critical Rural Freight Corridors (CRFCs); and (4) Critical Urban Freight Corridors (CUFCs). (23 USC. 167(c)). The network was recently approved and is shown in Figure 3.2. As Figure 3.2 shows there are no CUFCs or CRFCs in Miami-Dade County. Designation on the NHFN is important because it is a requirement for funding programs. The MAP-21 Section 1116 NHFP Formula program provides funding of $6.2 billion over five years ( ) including $301 million for the State of Florida. The CRFC and CUFC designated roadways support movement of freight at the local level and are important to overall connectivity between freight activity centers and the PHFS and overall Interstate system. The draft network for the State Florida included all of Krome Avenue and US 27 from SR 826 to I-75 in Broward County as Critical Freight Corridors (with designations of Urban or Rural depending on its location inside or outside of the Urban Development Boundary). The final Florida network did not include Krome Avenue or US 27 as statewide mileage caps limited the number of miles of freight corridors. Through the FHWA s process of developing the NHFN, the mileage caps for Florida were identified as miles of CUFC and miles of CRFC. Local freight stakeholders strongly believe that these corridors belong on the network and are supporting revisions to the Florida network to add the segment of US 27 from SR 826 to the Broward County Line to the NHFN. On May 30, 2018 an official request from Miami-Dade County Office of the Mayor was submitted to FDOT requesting the US 27 be added to the Florida NHFN. The letter is provided in Appendix A. 3.2 Regional Context It is important to understand how the county freight network connects to the rest of the South Florida and statewide freight systems. Freight operators do not recognize municipal jurisdictions on a daily basis and are focused on overall freight mobility and access to markets. Figure 3.3 shows how Miami-Dade County serves and connects to the South Florida region. Major connections such as I-75, I-95, and Florida s Turnpike serve as high-volume roadways that provide access between counties and to the remainder of the country. The US 27 corridor provides access to the heart of industrial Miami-Dade County and connects to the western region of Palm Beach County as well as to Hendry and Glades Counties. Each of these counties are supportive of private development of new Intermodal Logistics Centers (ILCS) (e.g., Florida Crystals ILC, Airglades ILC, Gateway to the Americas ILC). In addition, US 27 connects South Florida to the rest of the State and represents one of FDOT s future corridors. Therefore, this corridor, therefore represents a critical facility for the future. Other key regional components include the CSX Railroad and the FEC Railway, which provide connections throughout North America. 3.3 Highways Miami-Dade County has a well-developed east/west and north/south highway network that provides access throughout the County and connects to the rest of the region and state. I-75, I-95, Florida s Turnpike Enterprise (FTE) facilities and US 27 represent the primary interregional corridors. Other roadways, 16

26 Figure 3.2 National Highway Freight Network Designation in Miami-Dade County 17

27 Figure 3.3 Regional Context of Miami-Dade Freight Network 18
28 consisting of the expressways and state highways provide for internal movements and access to key freight hubs. All of these facilities are tolled except for the Hialeah and Palmetto Expressways including: Airport Expressway (SR 112)/I-195 Toll Dolphin Expressway (SR 836)/I-395 Toll Don Shula Expressway (SR 874) Toll Gratigny Parkway (SR 924) Toll Hialeah Expressway (SR 934) Palmetto Expressway (SR 826) Snapper Creek Expressway (SR 878) - Toll Five of these major expressways are maintained by the Miami-Dade Expressway Authority: SR 112, SR 836, SR 874, SR 878, and SR 924. FDOT is responsible for other state roads and the FTE. For funding purposes, the Miami-Dade County freight highway network includes 198 miles of SIS roadways and miles on the NHFN with overlapping designations for these 2 categories. The remaining 5,500 miles of roadways in the County are maintained by the Road, Bridge, and Canal Maintenance Division of the Miami-Dade County Department of Transportation and Public Works (DTPW) or a local jurisdiction. Figure 3.4 shows the 2016 Average Annual Daily Traffic (AADT) on the roadways in Miami-Dade County. The largest volumes, relative to the remainder of the County, are on the major expressways, including I-95, I-75, Homestead Extension of the Florida s Turnpike (HEFT), SR 836, SR 826, and the Airport Expressway. Other major traffic volumes are on NW 36 th Street (extension of the Airport Expressway), US-1, and Okeechobee Road. The maps clearly reflect the NHFN and SIS roadways as they mostly register as highvolume roadways. These high volumes illustrate that these roadways are also significant for the movement of people within the County. 19

29 Figure AADT on Miami-Dade Highway System Source: FDOT Florida Traffic Online 20
 on the roadways of Miami- Dade County.")
30 More significant for the movement of freight is the volume of trucks moving on these roadways. Figure 3.5 on the following page displays the 2016 Average Annual Daily Truck Traffic (AADTT) on the roadways of Miami- Dade County. The graphic to the right was prepared by FHWA to describe vehicle classifications. For traffic counting purposes all vehicles classes 4 through 13 are grouped into the truck category which generally includes any truck or bus with six or more tires. Figure 3.5 shows that SR 826 between NW 74 th Street to US 27 carries the highest daily volume of trucks in the County with more than 20,000 trucks per day. Source: Southeast Florida Regional Freight Plan To put both AADT and AADTT in perspective, it is important to understand just how significant the volume of trucks is in comparison to the total traffic. Figure 3.6 shows the 2016 percentage of the total roadway volume attributed to trucks on the roadway network. While major volumes are concentrated on a few roadways, namely the Interstate System, high truck counts are present throughout the County. Typically, a 5 percent mode share of trucks is significant, yet a large proportion of roadways in the County have over a 15 percent share. The interstates and other major SIS facilities are for the most part not in this top tier. While these roads do carry a significant number of trucks, the trucks are counterbalanced by the sheer number of vehicles using these facilities and thus trucks account for a lower percentage of the total volume on interstates and other major SIS roadways. In addition to the truck volume and truck percent characteristics, roadways also provide access to the region s freight hubs and logistics infrastructure (e.g., PORTMiami, FEC rail yard, MIA, Miami River waterway, western Miami-Dade County warehouse districts). Critical investments, like the recently opened PORTMiami tunnel and the 25th Street Viaduct, allow trucks to quickly and directly access key freight hubs. FDOT currently also has a study underway to evaluate ways to improve the 74th Street connector to the FEC Hialeah Ramp. 21

31 Figure AADTT on Miami-Dade Highway System Source: FDOT Florida Traffic Online 22

32 Figure Truck Percentage on Miami-Dade Highway System Source: FDOT Florida Traffic Online 23
33 3.4 Railroads Florida s railroad history in dates back to the times of Henry Flagler and his dream to expand his rail corridor down the entire Florida peninsula. Miami-Dade County s freight rail network is operated by two entities including the FEC and CSX Transportation. The FEC, based in Jacksonville, Florida, is the only railroad that follows the state's eastern coastline operating 351 miles of mainline tracks. Connections and track rights with other railroads allow for goods brought in through Florida s East Coast ports to have ready access to the North American market. FEC interchanges in Jacksonville with two Class 1 railroads the CSX and Norfolk Southern. CSX, also based in Jacksonville, operates about 21,000 route miles in 23 states, the District of Columbia, Ontario, and Quebec and has its southern terminus in Miami-Dade County. This freight rail network allows ready access to nearly two-thirds of the American population and the ability to access additional markets through alliances with other railroads throughout the rest of North America. The existing rail network in Miami-Dade County is illustrated in Figure 3.7. Table 3.1 and Figure 3.8 provide data and information related to existing and historic rail conditions. Information from the USDOT Federal Railroad Administration (FRA) was analyzed on Table 3.1 for the 22 strategic crossing locations shown on Figure 3.8. The results of the analysis show that the most railway/train related crashes from 2012 to 2016 occurred at the SFRC/NW 22 nd Avenue crossing with two crashes followed by the FEC/NW 27 th Avenue crossing. The FEC/Port Boulevard and the CSX/Flagler Street crossings with one train crash each. Table 3.1 also presents the FRA Web Accident Prediction System indices that show the percent chance that a rail crash would occur each year, based on 2016 data. The indices are calculated based on crash history and current year number of train trains per day multiplied by AADT and show that the SFRC/NW 22 nd Street crossing has the highest probability of a crash in 2017 followed by the FEC crossings at NW 27 th Avenue, NE 203 rd Street, NE 163 rd Street and at Port Boulevard. FEC has recently completed several major expansion projects to improve its network in anticipation of increased cargo volumes at PORTMiami. The PORTMiami project is complete and included four phases: reconstruction of the FEC Port Lead, reconstruction of the bascule bridge connecting PORTMiami and the FEC, construction of an on-port rail facility, and modifications to FEC s Hialeah Rail Yard to accommodate an increase in traffic. Connected to these improvements is the South Florida Logistics Center, a 400-acre logistics complex adjacent to MIA, operated by FEC s sister company Florida East Coast Industries (FECI). This facility has been very successful and is near capacity. FDOT District 6 is now undertaking a study of 7 railroad crossings in the Town of Medley. The study is being performed to analyze delay caused by crossing closures and to then prioritize potential grade separation studies. Figure 3.8 also shows the locations of these crossings. 24

34 Figure Miami-Dade County Freight Rail Network 25
35 Table 3.1 Strategic Rail Crossing Crash, Train and Traffic Data 2018 Miami-Dade County Freight Plan Update Source: Federal Railroad Administration Miami-Dade Strategic Rail Crossings Conflicts (#Trains x AADT) Primary Map Index # RR Street Crossing AADT Max Speed # of trains FRA Rail Crossing Crash Prediction Index Total Serious Injuries Roadway Rail Crash History ( ) Position Type Crossing number Operating Railroad 12 NW 22nd Ave SFRC N At Grade Public % ,500 1,677, NW 27th Ave FEC K At Grade Public % , , NE 203rd St FEC P At Grade Public % ,600 1,686, Port Boulevard FEC A At Grade Public % ,999 29, NE 163rd St FEC E At Grade Public % , , NW 36th St SFRC P At Grade Public % , ,100 1 W Flagler St CSX E At Grade Public % ,500 47, W 8th Ave FEC J At Grade Public N/A % , ,500 7 NW 25th St FEC M At Grade Public % , ,072 9 NW 74th St FEC U At Grade Public % ,485 44,730 5 Milam Dairy Road FEC C At Grade Public % , ,950 8 Milam Dairy Road CSX U At Grade Public % ,500 23,500 2 NW 22nd St FEC H At Grade Public % ,712 16, NE 36th St FEC P At Grade Public % ,500 62,000 3 NW 70th Ave FEC B At Grade Public % ,558 27,348 6 NW 26th St FEC Y At Grade Public % NE 125th ST FEC W At Grade Public % , , NW 7th AVE FEC B At Grade Public % , ,916 4 NW 68th Ave FEC A At Grade Private N/A 0 0 N/A 2 10 N/A 10 Yard Xings FEC T At Grade Private N/A N/A N/A N/A 11 FEC TOFC D/W FEC T At Grade Private N/A 0 0 N/A , , Pedestrian FEC L At Grade NA N/A 0 0 N/A 1 25 N/A 17 Pedestrian Arena FEC V At Grade NA N/A 0 0 N/A 1 25 N/A Source: USDOT Federal Rail Road Administration 26

36 Figure Miami-Dade County Rail Network Strategic Railroad Crossing Index Map Source: Federal Railroad Administration 27
37 The crossings being analyzed are along the FEC Medley Lead track and include: NW 74 th Street 125 feet west of NW 69 th Avenue NW 72 nd Avenue 125 feet south of NW 77 th Street NW 79 th Avenue 1,780 feet south of NW South River Drive NW 93 rd Street 2,300 feet west of NW South River Drive NW 106 th Street 2,300 feet west of NW South River Drive NW 116 th Way 1,450 feet southwest of NW South River Drive NW 121 st Way 1,480 feet southwest of NW South River Drive Other key rail developments underway in Miami-Dade County include the connection between CSX and the FEC via a new track at the Iris connection, which will be completed and operational by The construction includes a new single-track connection between the FEC Railway and the SFRC within FDOT right-of-way. The project will facilitate freight connectivity from the SFRC to the FEC Little River Connection and provide access to the Hialeah maintenance yard. This connection will allow the shifting/rationalization of freight traffic between the two lines, thus improving the region s ability to effectively manage the mix of passenger and freight movements. Rationalization, or the sharing of freight traffic between the 2 corridors, has become increasingly important with the expanded passenger service underway and planned on the FEC corridor (e.g., the FEC Brightline service began on May 19, 2018 and the TriRail Coastal Link expansion is planned for the future). Other connections, including the Pompano connection in Broward County and the Northwood connection in Palm Beach County, represent improved connectivity. Both the Iris and Northwood connections are funded by the South Florida Freight and Passenger Rail Enhancement Project between the SFRC and FEC Railway Transportation Investment Generating Economic Recovery (TIGER) grant while the Pompano connection remains unfunded at this time. From an industrial development perspective, the FEC and the CSX continue to work with rail-served property owners in Miami-Dade County. As sites redevelop and modernize, and new facilities are constructed, rail access remains a competitive advantage especially considering the limited number of properties served. Potential development areas, like the Miami River district, have rail access that could be used to promote industrial investments. Figure 3.9 provides a map showing the regional context of the Iris and Northwood connections. The graphic is sourced from a presentation provided at the 2016 FDOT Design Expo by FDOT District 4. 28


38 Source: FDOT District 4 Figure 3.9 Iris and Northwood Rail Connections 2018 Miami-Dade County Freight Plan Update PHASE 1A PHASE 2 29
39 The US 27 corridor represents another possible expansion of South Florida s rail network. A rail feasibility study, completed by FDOT, suggested a new rail link may be feasible. The feasibility study was followed by a Planning and Conceptual Engineering (PACE) Study in The potential corridor would connect three possible rail termini in western Miami-Dade County to railroad connections in Palm Beach County, as illustrated in Figure The impetus for these efforts is the potential to effectively manage passenger and freight rail operations in South Florida. With efforts by PORTMiami and Port Everglades to double their containerized operations over the next twenty years, expansion of Tri-Rail service and development of the Brightline Florida service, and growth in development along the SFRC and FEC rail corridors, traffic along existing rail lines will increase significantly. While existing right-of-way can accommodate an expansion through double or triple tracking, the effects of the increased passenger and rail operations will have a significant impact on the region. In addition, there are ILCs proposed and under development in Palm Beach, Hendry, and Glades counties that will directly serve South Florida and rely on connections to South Florida s freight generators (e.g., PORTMiami, MIA). As such, a new rail corridor in the rural western part of South Florida remains an attractive option. 30

40 Figure Proposed US 27 Rail Corridor Source: FDOT 4 US 27 PACE Study 31

41 Short Tons 2018 Miami-Dade County Freight Plan Update 3.5 Waterways Miami-Dade County has three main waterways that are linked to the successful freight industry: the Miami River, the Atlantic Intracoastal Waterway and the Atlantic Shipping Lane. All three of these waterways are designated on the SIS, as shown on Figure 3.1 (page 15). The Miami River, overseen by the Miami River Commission, is a 5.5-mile long waterway running from Biscayne Bay to MIA where it turns into the Miami Canal. An estimated 2,000 vessels move through this waterway each year. Use of the waterway for freight has drastically reduced since the highs seen in the mid- 1990s when nearly 900,000 short tons of cargo moved through the waterway. In 2014, the Miami River handled a little more than 300,000 short tons for the year with a strong emphasis on exports which make up roughly 73 percent of the total volume. With that said, Figure 3.11 illustrates that 2015 represented a significant growth year perhaps indicating change in the downward trend. Figure Short Tons Moved Through the Miami River 450, ,000 Outbound Shipping Inbound Receiving 350, , , , , , , , , , ,000 50, ,736 71,496 86, ,684 91, Source: US Army Corps of Engineers Waterborne Commerce Statistics. The Atlantic Intracoastal Waterway (ICWW) stretches from Norfolk, Virginia to Key West, Florida as a 1,200- mile portion of the 3,000-mile Intracoastal Waterway. This system was originally designed to reduce the amount of open-ocean travel required. Depths are maintained at 12 feet from Norfolk through Fort Pierce, Florida, but only 10 feet for the remainder through Miami where the use of the ICWW will likely remain recreational. 32
42 Cargo volumes from Jacksonville to Miami fluctuate annually and previously were driven largely by petroleum movements, however, that commodity no longer travels in the ICWW. There has been a significant volume reduction in recent years, likely due to conversion of FPL plants from petroleum to natural gas. Table 3.2 summarizes the last available five years of cargo traffic. Table Atlantic Intracoastal Waterway Cargo Volumes Jacksonville, FL to Miami, FL Short Tons Per Year CommodityName Total Gasoline 5,800 5,800 Marine Shells 5,200 5,200 Alcohols 4,531 4,531 Fab. Metal Products 661 1, ,123 Machinery (Not Elec) ,774 Misc. Mineral Prod. 1,000 1,000 Unknown or NEC Pigments & Paints Ships & Boats I&S Bars & Shapes Lumber Non-Ferrous Scrap Rubber & Plastic Pr Primary Wood Prod Manufac. Wood Prod Plastics I&S Pipe & Tube I&S Plates & Sheets Electrical Machinery Manufac. Prod. NEC I&S Primary Forms 6 6 Sand & Gravel 3 3 Paper Products NEC 1 1 Food Products NEC 1 1 Total 12,243 1,291 1,737 1,241 6,540 23,052 Source: USACE Waterborne Commerce Data. Increased cargo moving on the ICWW would likely be associated with waterside operations requiring direct barge service for bulk, break bulk, or specialized project cargo. New facilities may need additional dredging to provide access from the Federal channel to the berth. Cargo movement is further complicated by bridges on the ICWW, which constrain the movement of larger vessels. In Miami-Dade County, the use of the ICWW will likely remain largely recreational, other than for access to PORTMiami and the Miami River. 33

43 3.6 Seaport PORTMiami is one of the world s leading hubs for global commerce and tourism. Its gateway location in the center of the Western Hemisphere makes the Port a significant conduit for international trade and commerce. PORTMiami stands as the U.S. container port closest to the Panama Canal, providing shippers fast access to Florida s booming local consumer base and the entire U.S. market. PORTMiami is managed by the Miami- Dade County Seaport Department and is located just outside of downtown Miami on a 520- acre island. PORTMiami s main trade flows are in a north/south direction as just over 49 percent of total Twenty Foot Equivalent Unit (TEU) trade is with the Americas and the Caribbean. However, Asian trade is growing significantly as trade in TEUs grew by 11 percent in 2015 and 15 percent in 2016 and now totals about 34 percent of total TEUs in Of the 612 Post Panamax Cargo ships to visit the three largest Florida largest seaports, 264 arrived at PORTMiami from July 2016 to June Source: PORTMiami FY 16/17 Post Panamax Vessel Arrivals Figure 3.12 shows 2012 to 2016 cargo movements through PORTMiami by tonnage and TEU movements. Operations peaked in 2005 at nearly 9.5 million tons and over a million TEUs, but declined in the following years due to a combination of the damaged 239 Ships 109 Ships 264 Ships rail connections in 2005, the relocation of carriers such as MSC to other ports, and the PORTMiami PORT Everglades JAXPORT economic downturn. However, the economy has rebounded since the recession and 2015 Source: FDOT Panama Canal Expansion and Florida Seaport Report and 2016 show a significant turn around and a return to a growth trend getting closer to the numbers previously recorded in the mid-2000s. As discussed earlier, PORTMiami has undergone a vast transformation in recent years. The PORTMiami Tunnel opened in August 2014, providing direct access to the Interstate System. As a result, traffic and trucks no longer have to travel through downtown Miami. The tunnel provides the port with the ability to accommodate its anticipated growth and reduce the impact of port traffic on downtown Miami, which is undergoing significant development. Figure 3.13 shows a dramatic drop in total and truck traffic in 2015 and 34
 was also constructed.")
44 2016 and Figure 3.14 shows that the traffic and trucks shifted over to the new tunnel access. In addition to new highway/tunnel access, rail service was restored to the port in 2014 and an on-port Intermodal Container Transfer Facility (ICTF) was also constructed. As mentioned earlier, the rail improvements were completed in conjunction with FECI development of the South Florida Intermodal Logistics Center at the south end of the existing Hialeah Yard. Figure 3.15 provides information from PORTMiami showing rail moves from the Port are steadily averaging between 2,000 and 2,600 train cars per month. Year Figure Historic Cargo Movements by Tonnage and TEU through PORTMiami 9,000,000 8,000,000 7,000,000 6,000,000 5,000,000 4,000,000 3,000,000 2,000,000 1,000, TEUs Outbound Tonnage Inbound Tonnage Total Tonnage TEUs Inbound Tonnage Outbound Tonnage Total Tonnage Source: 35
 and Truck (AADTT) Data for PORTMiami Bridge 16,000 14,000 12,000 10,000 8,000")
 and Truck (AADTT) Data for PORTMiami Tunnel 12,000 Sum of AADT Sum of")
45 Figure 3.13 Traffic (AADT) and Truck (AADTT) Data for PORTMiami Bridge 16,000 14,000 12,000 10,000 8,000 6,000 4,000 2,000 0 Sum of AADT Sum of AADTT Source: FDOT Florida Traffic Online Figure 3.14 Traffic (AADT) and Truck (AADTT) Data for PORTMiami Tunnel 12,000 Sum of AADT Sum of AADTT 10,000 8,000 6,000 4,000 2, Source: FDOT Florida Traffic Online 36

46 NUMBER OF CONTAINERS 2018 Miami-Dade County Freight Plan Update Figure 3.15 PORTMiami Container Rail Moves Trends 3000 Seaboard Marine Inc. Port of Miami Terminal Operating Company South Florida Container Terminal Total Oct-16 Nov-16 Dec-16 Jan-17 Feb-17 Mar-17 Apr-17 May-17 Jun-17 Source: PORTMiami Finally, waterbourne access to PORTMiami has also been improved since the last freight plan. The deep port channel dredge has concluded providing 50 to 5 foot depth allowing for the main channel to accommodate Neo-Panamax ships. These projects are pivotal to the cargo forecasts developed as part of the 2035 Port Master Plan. Data from the PORTMiami 2035 plan was updated to reflect TEUs through 2016 and projections made using the scenarios in the master plan. Figure 3.16 shows the expected increase in TEUs at PORTMiami. By 2035, container throughput is projected to range between 1.8 million and 3.4 million TEUs, with annual growth rates ranging from 3 to 5.8 percent. The range represents a no-growth market share to aggressive market penetration by the port. 37

47 Figure PORTMiami Projected Growth by TEUs Source: Marlin Engineering Inc. and PORTMiami 2035 Master Plan In addition to growth in cargo, PORTMiami will experience significant growth in cruise traffic and rationalizing the physical space at the port is already an issue. One solution that is being studied is the development of an Inland Terminal away from the port that would be connected by roadway and rail. The site could be used for transload, intermodal and lay-down facilities, which would relieve the cargo space needs at the Port. In 2017, the county initiated a study to identify suitable locations. Figure 3.17 shows 16 locations that are currently under review. Most of the properties are privately owned and there is no commitment to purchase property at this time. The study is being performed to seek out partnerships and leverage assets. For example the FDOT District 6 Doral Subarea Freight Plan looked at potential alternatives for development of three sites in proximity to the Doral area. The concepts are found in Appendix B. 38

48 Figure 3.17 PORTMiami Potential Inland Terminal Locations Source: PORTMiami 39

, Miami-Opa Locka Executive Airport (OPF), Homestead Air Reserve Base (HST), and Homestead General")
49 3.7 Airports Miami International Airport (MIA) is situated on 3,300 acres, supporting four runways just eight miles west of Downtown Miami. In 2016, MIA was ranked the number one International Freight Airport in the United States and ranked number eleven overall in the world. MIA carries over 80% of all cargo in Florida and is considered the gateway to Latin America and the Caribbean. In addition to MIA the Miami-Dade Aviation Department manages Miami-Kendall Executive Airport (TMB), Miami-Opa Locka Executive Airport (OPF), Homestead Air Reserve Base (HST), and Homestead General (X51). These airports have great potential for the future, however, the bulk of air freight movements are handled through MIA. As the leader in the Americas in international freight and the world s largest gateway to Latin America and the Caribbean, MIA controls the north-south cargo flows in the Western Hemisphere. Florida s airports directly serve 97 international destinations with either dedicated all-cargo or wide-body passenger aircraft. Seven of the top ten trade lanes are from MIA to markets located in Latin America and the Caribbean. Air cargo lift capacity to Bogotá, Colombia remains as the largest trade lane. Figure 3.18 shows that, in 2016, South America, Central America and the Caribbean made up 86 percent of the tonnage through MIA and 71 percent of dollar value. Figure Miami International Airport Trade with Partners MIA TRADE ALL REGIONS IN TONS THE CARIBBEAN 5% EUROPE 7% NORTH AMERICA 2% ASIA 5% THE MID- EAST 0% AFRICA 0% OCEANIA 0% THE CARIBBEAN 12% MIA TRADE ALL REGIONS DOLLARS NORTH AMERICA 2% ASIA 4% THE MID- EAST 3% AFRICA 0% OCEANIA 0% CENTRAL AMERICA 11% SOUTH AMERICA 70% EUROPE 20% CENTRAL AMERICA 8% SOUTH AMERICA 51% Source: Miami-Dade County Aviation Division Figures 3.19 and 3.20 show recent trends at MIA. Figure 3.19 shows historical values at MIA, indicating that there has been a significant drop in the value of product since 2012 and that import values have pretty much held steady around $25 million per year, except in 2015 where there was a significant drop. 40


50 As a result of its extensive infrastructure and unique operating characteristics, MIA has become the dominant airport in a number of commodities. MIA accounts for approximately 72 percent of US fruit and vegetable imports, 90 percent of US flower imports, and 54 percent of US fish imports. While these markets account for the largest volume of goods by tonnage, the bulk of operations by value, as result of exports, focuses on different commodities. The top three export commodities for MIA by value in 2016 are Computers/Peripherals, Telecommunications Equipment, and Industrial Machinery/Parts, for a combined value of $9.5 billion in 2016, which is down significantly from nearly 12 billion in % MIA Exports Dollars 5% 3% 18% 40% Computers / Peripherals Industrial Machinery / Parts Telecommunications Equipment Vehicle Parts/Tires Metals and Metal Products Source: Miami-Dade County Aviation Division Figure Total Freight Value through Miami International Airport Source: Miami-Dade County Aviation Division 41

51 Figure 3.20 Historic Total Freight Tonnage through Miami International Airport Source: Miami-Dade County Aviation Division Similar to PORTMiami, projections for growth at MIA are identified in their master plan under multiple growth scenarios. The Miami-Dade Aviation Department (MDAD) MIA Strategic Master Plan shows three forecasts including Average Annual Growth Rates (AAGR) ranging from 3.4 percent per year to 4.2 percent per year. Figure 3.21 shows anticipated tonnage ranging from four million tons to five million tons by
52 Figure Estimated Growth of Cargo Tonnage at Miami International Airport Source: MIA Strategic Airport Master Planning Study To support the expected growth, MDAD has prepared a phased Cargo Optimization, Redevelopment and Expansion (CORE) Plan. The plan includes projects to optimize use of existing cargo facilities to provide additional near-term capacity. This phase will demolish obsolete, costly to maintain, facilities and replace them with a new cargo clearance center. The next phase is to redevelop and construct new cargo facilities on existing MIA property and finally to expand facilities on acquired land. The planned program is to construct facilities based on growth, with the optimize phase based on cargo demand up to 2.5 million tons, the redevelop phase up to 2.8 million tons, and the expand phase up to 4.1 million tons, including a new vertical core cargo facility. Figure 3.22 depicts the completed CORE facilities at the southwest corner of the airport. 43

53 Figure 3.22 Depiction of Ultimate Layout of MIA CORE Plan Source: Miami-Dade County Aviation Department As mentioned earlier. Miami-Dade County is also home to additional airports including Miami-Kendall Executive Airport, Miami-Opa Locka Executive Airport, Homestead Air Reserve Base and Homestead General. The Miami-Kendall Executive Airport, recently designated as a SIS facility, is located 15 minutes from the business centers in the southern part of the County. With its three runways ranging from 4,001 feet to 5,999 feet, the 1,380-acre airport acts as a general reliever for MIA. This airport provides US Customs services (Landing Rights Airport) and is home to the MIA Automated International Flight Service Station (AIFSS), the air traffic facility providing en-route communications. There are plans underway that could greatly expand the use of this airport, including the Miami-Dade Expressway Authority (MDX) proposal to extend SR 836 south and west in proximity to the airport and plans to widen access to the east on SW 128 th Street connecting to SR 826. Miami-Opa Locka Executive is situated on 1,810 acres of land, twelve miles northwest of the city center. At 8,002 feet, Runway 9L/27R at OPF is one of the longest general aviation runways in the country, enabling the airport to handle virtually any type of aircraft. Two additional runways at the airport measure 4,306 feet and 6,800 feet. OPF supports light cargo traffic to the Caribbean and large aircraft maintenance facilities as well as being home to the busiest US Coast Guard Air/Sea Rescue Station. OPF is the largest of the four 44
54 general aviation airports operated by Miami-Dade County, and is designated general aviation (GA) reliever airport for Miami International Airport (MIA) with an Airport Reference Code (ARC) of C-III, as defined by FAA Circular 150/ A. Located approximately twelve miles northwest of downtown Miami, and seven miles north of MIA. In 2017, OPF experienced 136,556 total annual operations, and had 326 based aircraft. The airport accommodates a diverse set of aviation needs, including corporate and business-use, and military traffic, various aeronautical functions, business parks, and other general aviation s activities traditionally offered to both private and public sector users. OPF s land area consists of 1,880 acres, and its airfield consists of three active runways including two east-west runways and one southeast-northwest runway. In June of 2018, MDAD officially requested that FDOT designate OPF as a SIS designated hub and therefore eligible for SIS funding per Florida Statutes (4). A copy of the request is provided in Appendix C. Per the MDAD request OPF meets all of the SIS General Aviation Reliever Airport Criteria: Criteria: Identified by FAA as a General Aviation Reliever Airport, and the Airport it relieves is designated on the SIS. Eligible: Yes - OPF is Designated a GA Reliever Airport by FAA and MIA is designated on the SIS. Criteria: Handles at least 75,000 itinerant (nonlocal) operations per year. Eligible: Yes - 81,067 Itinerant Operations in Criteria: Has a runway length exceeding 5,500 linear feet. Eligible: Yes - 8,002 Linear foot runway. Criteria: Capable of handling aircraft at least 60,000 pounds with a dual wheel configuration which is served by at least one precision instrument approach. Eligible: Yes - 249,000 pounds with dual wheel configuration. Criteria: Service to clusters of industries dependent on air transportation. Eligible: Yes - Most recently, Amazon has constructed its first mega warehouse in South Florida at OPF. 45
55 4.0 MIAMI-DADE LOGISTICS INFRASTRUCTURE 46
56 4.0 Miami-Dade Logistics Infrastructure The county s freight transportation infrastructure provides the means by which the freight moves into, out of and within the county. However, there are many other factors that impact how freight moves. These factors combine with the transportation system to form a comprehensive logistics infrastructure that provides all the necessary services, warehouse capacity, and international trade expertise. For example, freight forwarders and brokers provide a wealth of knowledge on the laws and regulations imposed on different types of commodities being imported or exported; many shippers and receivers rely on third party warehouse operators; trucking companies need full service truck parking facilities to maintain their vehicles and adhere to hours of service regulations; and developers need access to land with appropriate zoning and land use designations to allow for industrial facilities. The conditions and amenities available at such facilities have a direct impact on the types of goods which can be handled or stored. Key logistics-related components and developments in Miami-Dade County are described below. 4.1 Freight and Industrial Property Trends and Developments An analysis of available land use data helps to illustrate the location of freight and industrial operations. Four categories of land use data are defined as freight intensive for this analysis, as follows: Transportation land uses (e.g., airports, seaports, railroads/rail terminals, roadways). Transportation land uses capture the major freight terminals as well as key roadway and rail corridors. Several of these terminals represent intermodal logistics centers. Figure 4.1 shows the terminals in dark purple and the major roadway corridors in orange (Strategic Intermodal System roads) and light pink (other State roads). Industrial land uses (e.g., warehousing/distribution centers). Industrial land uses represent warehouses, distribution centers, foreign trade zones, light manufacturing, and other light and heavy industrial uses. Based on the operation, several of these facilities also represent intermodal logistics centers. Figure 4.1 shows the location of these facilities in light purple. Agricultural land uses (e.g., farms, packing facilities). Miami-Dade County is home to an established and historic agricultural community, located largely to the south and west. These operations vary by season, but represent significant freight activity. Figure 4.1 shows the location of agricultural operations in dark green. Mining land uses (e.g., aggregate mining). Aggregate mining has long existed in Miami-Dade County, generating significant truck and rail traffic throughout the region. These operations are concentrated in the Lake Belt in northwestern Miami-Dade County. Figure 4.1 shows the location of mining activity in blue. 47

57 Figure 4.1 Miami-Dade County Land Use Source: Miami-Dade County GIS Hub 48
58 The majority of existing industrial property is concentrated in the north central and northwestern portions of Miami-Dade County (e.g., Doral, Medley, Hialeah, Opa-Locka). These properties consist of warehouses, distribution centers, fulfillment centers, and light and heavy manufacturing. All of these facilities are located adjacent to or in close proximity to key transportation hubs and corridors. The southern portion of the county is home to the majority of agricultural operations, with transportation facilities throughout the county connecting these operations to distribution centers. Mining operations, consisting of aggregate mining, are located in the northwest part of the county and have direct rail access to quarries. The remaining portions of the county are predominantly developed as residential or are preserved for environmental purposes, such as the Everglades National Park. Based on the land use data, approximately 10 percent of the county is used for freight-related purposes as shown in Table 4.1. Agriculture and Transportation have the highest share at around 4 percent each, whereas Industrial and Mining activities each account for about one percent of the total land uses in Miami-Dade County. Conservation areas represent 68 percent of the county, consisting primarily of Everglades National Park (33 percent of Miami-Dade County) and Water Conservation Areas (13 percent of Miami-Dade County). With the exclusion of these two major conservation lands, 19 percent of lands are designated for industrial purposes. Table 4.1 Miami-Dade Freight-Related Land Use LAND USE TYPE TOTAL BY PERCENT TOTAL BY PERCENT EXCLUDING MAJOR CONSERVATION AREAS Agriculture Industrial Mining Transportation Total Freight-Related Source: Miami-Dade County 49

 and price per square foot (PSF).")
59 4.2 Trends in Warehouse Affordability and Pricing Due to the existing developments, available land, and constraints associated with lands outside the Urban Development Boundary (UDB), warehousing space is limited and expensive. Based on quarterly analyses by commercial real estate brokers, it is possible to compare the Miami-Dade market to national averages and other freight-intensive regions. Figure 4.2 shows the net absorption and asking rent trends for both Miami- Dade and the United States for 2013 through Quarter 4 of 2017 in millions of square feet (MSF) and price per square foot (PSF). Similar trends exist for the overall net absorption, that is, it has remained positive over the past seven consecutive years. In addition, asking rents have been steadily increasing for both markets. The main difference for these trends is the asking rent per square foot. Miami-Dade s asking rent per square foot sits significantly higher at $8.67 per square foot whereas the US average is $5.84. Figure 4.2 Warehouse Net Absorption and Asking Rent Miami-Dade United States Source: Cushman & Wakefield, Industrial Quarter Market Reports. In spite of higher average rent prices, Miami-Dade s warehousing inventory experiences an overall lower vacancy rate than the rest of the country, as shown in Figure 4.3. Historical averages for Miami-Dade suggest a vacancy rate of 5.9 percent, although vacancies have been below this average since roughly The Unites States as a whole fell below its historical average of 8.4 percent in mid These low vacancy rates encourage developers to construct additional capacity where possible to take advantage of increasing rental rates. From a regional market perspective, shown in Table 4.2, vacancy rates of 4.7 percent in Miami were well below the average vacancy of 6.1 percent found in the South, which has the highest vacancy rate of the four regions representing the United States, as defined by Cushman & Wakefield. This illustrates a strong demand for property in South Florida, particularly given that the asking rents for spaces in Miami are nearly double that of the southern region as a whole ($8.44 vs. $4.66). A comparison of vacancy rates and asking rent by market can help characterize the county s market strength/demand. As described above, there is a significant demand for space in the Miami region as shown by low vacancy and high rent. 50
.")

60 Figure Overall Warehouse Vacancy Miami-Dade United States Source: Cushman & Wakefield, Industrial Quarter Market Reports. The Los Angeles market is similar with even lower vacancy and higher rent (1.3 percent and $8.83). Both of these markets reflect major gateways with significant local markets and limited developable land. Other locations, such as Jacksonville and Savannah, represent major international gateways with more available and affordable land, which results in lower rental rates despite vacancy rates being on par with Miami. Table Comparison of Vacancy Rates and Asking Rents by Geography WEIGHTED AVERAGE ASKING RENT ($) REGION/CITY VACANCY RATES (%) WAREHOUSING/ DISTRIBUTION MANUFACTURING United States Northeast Midwest South West Atlanta, GA Jacksonville, FL Los Angeles, CA Savannah, GA N/A Miami, FL Source: Cushman & Wakefield, Industrial Quarter Market Reports (Preliminary Q4 2017) 51

61 In determining these vacancy and rental rates, commercial real estate brokers typically divide the county into regions in order to conduct submarket analyses. Figure 4.4 displays the nine industrial submarkets in Miami-Dade determined by the CBRE Group s analysis. These nine areas are listed in Table 4.3. Figure Industrial Submarkets of Miami-Dade County The least vacant area of the county is North East Dade at 0.2 percent, which aligns with the highest asking lease rate of $12.89/Square Foot/Industrial Gross (SF/IG), and the lowest total inventory of space at just over 2.8 million square feet. The highest vacancy is found in Hialeah at 7.3 percent with an asking lease rate of $8.50 and an inventory exceeding 13 million square feet. Overall, the Airport/Doral submarket has the largest total inventory of over 58 million square feet and roughly another one million square feet under construction. The proximity of this submarket to the airport, Source: CBRE Marketview, Miami Industrial, Q major roadways, and rail yards makes it an ideal location for logistics-based businesses to locate. This proximity continues to drive demand, as evidenced by this submarket having the third highest average asking lease rate of $9.94/SF. At the county level, the industrial market consists of over 215 million square feet of inventory, of which 178 million or 82 percent represents warehousing space. Miami-Dade County is home to over 200 million square feet of warehouse space. This is the largest concentration of warehouse space in Florida. It is estimated that there are only 2,500 acres left to develop in Miami-Dade County, amounting to an additional 40.8 million square feet. Across the three counties in South Florida, at a maximum, industrial space can only increase by 15 percent. 52

62 4.3 Evolving Warehouse Needs As experienced in the warehousing and distribution center industry throughout the US, new state-of-thepractice facilities continue to evolve and standardize, based on market demands. Newer warehouse and distribution space being built to handle additional business has been more standardized than older warehouse space, particularly when it comes to height and size characteristics, as well as access to and lay out of loading docks/bays. Looking specifically at the evolution of the Miami-Dade market, a comparison was conducted between buildings with at least 50,000 square feet of rental space built prior to 1980 and those built after Table Miami-Dade Industrial Market Submarket Analysis TOTAL UNDER AVG. ASKING TOTAL TOTAL 2017 NET SUBMARKET INVENTORY CONSTRUCTION LEASE RATE VACANCY AVAILABILITY ABSORPTION (SF) (MSF) (SF) ($/SF/IG) Airport/Doral % 8.3% 702, , Central Dade % 6.7% (114,180) 59, Hialeah % 9.0% 323,411 17, Kendall/ Tamiami % 2.6% 39,870 13, Medley % 8.0% 1,266, , Miami-Lakes % 4.1% 398,557 1,917, North Central Dade North East Dade % 6.2% (64,418) 1,368, % 5.2% 19, South Dade % 5.8% 271,748 40, Total % 7.1% 2,841,044 4,886, Manufacturing % 5.2% (66,456) Warehousing/ Distribution % 7.7% 2,473,465 4,868, R&D/Flex % 3.8% 37, Other Industrial % 2.4% 396,267 17, Source: CBRE Marketview, Miami Industrial, Q Height is an important attribute of warehousing space, reflecting the types of operations conducted there. Additional height allows for greater storage space within the same footprint; this is critical in urban locations where land availability is limited and expensive. For warehousing and distribution spaces built prior to 1980, there were at least 29 varying heights found in such buildings, excluding those which did not have a reported height in the CoStar database. These ranged from 11 feet to 40 feet. The most popular heights of this era were 20 feet (18 percent 53
 and 30 feet (25 percent). Truck access to warehouse and distribution center locations also has improved.")
63 of total rental space), 18 feet (13 percent), and 22 feet (10 percent). For those built since 2007, only 11 different heights are recorded, of which the minimum is 18 feet and the maximum is 42 feet. The most popular height is 32 feet (26 percent of the total rental space) and 30 feet (25 percent). Truck access to warehouse and distribution center locations also has improved. Many of the older properties have a limited number of loading docks and those that do exist cannot always accommodate the larger trucking equipment in use today. This is due to key characteristics including dock height and driveway/bay length. Even with the addition of new facilities, the local market continues to rely on the existing, dated, obsolete facilities; they are effectively used for smaller, niche operations and for operations with quick inventory turnover which negates the benefits of high ceilings. In regard to rentable space, the average size has also increased over time, despite the limitations of developable land for this use. For buildings built prior to 1980 with other 50,000 square feet of rental building area, the average size was just over 100,000 square feet. The largest building built in this time period had approximately 766,000 square feet of space and is still in use today as part of Publix Supermarket s distribution network. Over time, the average size of new buildings has increased to approximately 160,000 square feet although the largest buildings built in the last 10 years have capped out at 500,000 square feet for both the Centurion Cargo Center at the Miami International Airport and the USPS facility at the Miami-Opa Locka Executive Airport. 54

64 4.4 New Developments and Future Growth Looking forward, several large developments are underway or planned. The majority of these new buildings will be located in northwest Miami-Dade County adjacent to major transportation corridors. In addition, several of the largest developments represent mixed use facilities that will rely on trucks for retail and commercial deliveries, and generate significant auto traffic that will compete for roadway capacity. One of the most significant and well known mixed use developments is the American Dream mega-mall proposed in Miami- Dade County. While not freightspecific, the development is anticipated to exceed five million square feet of retail, entertainment, and dining space, surpassing the Mall of America. The location of this development at the intersection of I-75, Florida s Turnpike Extension, and Miami Gardens Drive would allow for ready access to these major roadways. With an estimated 14,000 workers and 30 million visitors per year, this development is expected to produce tens of thousands of additional trips each day, which can lead to even more congestion on already overcrowded roadways. The $4 billion project has been in the planning stage for over two years, with a current estimated completion date of Most recently, in May of 2018, the Mall secured zoning approval from the Miami-Dade County Commission and is now in the process of securing environmental and water permits. As this project moves forward, efforts need to be undertaken to ensure that freight traffic is not negatively impacted moving through the region as well as for trucks which need to access the facility for delivery. Adjacent to the American Dream Mall development is the proposed Graham Project, located to the south of the mall site. This project would include approximately 2,000 multi-family rental units, one million square feet of commercial space, and three million square feet of Business Park, the majority of which would be office 55
65 space, in addition to four hotels totaling 1,600 rooms. The development of the American Dream Mall and the Graham Project could impact freight-specific projects that are also advancing in the same subregion. Flagler Global Logistics has begun development of their 500-acre site, known as the Countyline Corporate Park. The eventual buildout will encompass over eight million square feet of industrial space. This development is further surrounded by housing projects underway including Dacar Management s Atlas Hialeah Heights and Lennar s Two Lakes, Satori, and Bonterra sites. With such a significant mix of users, transportation improvements conducted in this area need to be mindful of these users diverse needs. Other developments taking place within Miami-Dade County are on a smaller scale, but no less important. Many of these are located within existing industrial areas and thus would be less likely to cause conflicts with other land uses. Such developments include the cluster found to the east of NW 87 th Avenue and north of NW 74 th Street, which encompasses the two phases of the Airport North Logistics Center which are already completed and an additional proposed 2.6 million square foot development. The first building of the Miami International Tradeport, located off of NW 122 nd Street, was completed in early 2014, with a final buildout plan of approximately 1.5 million square feet of industrial space. Opa-Locka is also looking to expand the industrial footprint of the city with the first Amazon mega-warehouse in South Florida. Built on Miami-Opa Locka Executive Airport property, this facility will encompass 850,000 square feet of warehousing space and will employ 1,000 workers. This will place Amazon as the primary tenant of the 97-acre planned development in this city. While not an exhaustive inventory, the above developments represent examples of ongoing and planned projects occurring throughout the county. The clear message is that there is significant and conflicting demand for all developable property in the county. As these developments advance, transportation investments will be necessary to ensure regional mobility for all system users. Figure 4.5 provides a graphic of some of the major warehousing developments now underway. 4.5 Foreign Trade Zones In the United States, foreign trade zones (FTZ) are areas located near ports of entry. The idea behind them is that goods receive the same U.S. Customs treatment as if they were still outside the United States, but may be reconfigured or manufactured on US soil. Duties are only paid when goods are transferred to the US consumer market. This lowers the amount of tariffs and taxes paid by companies engaging in international trade by eliminating and/or delaying payment. Effective use of FTZs creates economic opportunities and competitive advantages for a region. At present, there are four FTZs in Miami-Dade County, but the structure of such zones is evolving. The defined zones are as follows: 56

66 Figure 4.5 New Industrial Warehousing Developments Underway Source: Mike Silver, CBRE presentation to TPO FTAC April
67 FTZ No. 32: Miami Free Zone 47-acre site with more than 850,000 sq. ft. of facilities FTZ No. 166: Homestead 1,000-acre site roughly 30 miles from both the Airport and Seaport FTZ No. 180: Wynwood Inactive zone that was never fully established FTZ No. 281: Miami-Dade County- The PORTMiami Free Zone, recently expanded to include Miami International Airport FTZ 281 is the newest FTZ designated in Miami-Dade County. The limits of this zone extend from SW 8 th Street in the south to the county border with Broward in the north. What is unique about this zone is that it will be among the first to be operated under the Alternative Site Framework s (ASF) streamlined process, adopted in January 2009 by the Foreign Trade Zones Board. Under ASF, two types of sites are designated: Magnet and Usage-Driven. Magnet sites are similar to the way FTZs work today, by designating an area in advance in order to attract multiple users to that area. These are not the main goal of the ASF, however, and six or fewer Magnet sites are to be created per grantee. One such designation is the South Florida Logistics Center. The newer designations, Usage-Driven sites, is for companies seeking to pursue FTZ activities. In this case, the FTZ designation is tied to a particular company and is limited to the space needed by that company. In the event of a company relocating, the facility will no longer be designated as a Usage-Driven site and a new occupant would need to reapply. In switching from the traditional FTZ designations to the ASF, unused FTZs will be removed. Currently, FTZs are designated based on speculation about where industries will locate. However, there is little correlation between these sites and actual use, resulting in unused locations such as FTZ No ASF will allow for companies to designate their existing site provided that it is located within the boundaries of the FTZ. In addition, all sites (both Usage-Driven and Magnet) will be given sunset limits of three to five years in order to remove excess designations that no longer fit the needs of the FTZ. While Miami-Dade has an extensive freight infrastructure, growth is limited given that much of the county has already been developed, particularly for residential use, and as the location of the Florida Everglades to the west and the environmental concerns associated with the conservation of this unique habitat preclude such growth. Nevertheless, acreage is still available. Parcels can be identified by selecting land which is presently Vacant government owned or controlled or Vacant, non-protected, privately owned, but will have either an Agriculture, Industrial and Office, Restricted Industrial and Office, Terminals, or Transportation Right of Way (ROW), Rail, Metrorail, Etc.) land use category in the future. 58
68 5.0 FREIGHT SECURITY AND CARGO THEFT 59
69 5.0 Freight Security and Cargo Theft Theft of goods in transport is a significant cost of business for the freight community. Thefts most commonly occur when products are stopped in transit, whether that be in a container sitting in a seaport, airport, or rail yard, or on a truck at a truck stop or truck terminal. Fortunately, over the last decade, most non-highway facilities have developed extensive security features that provide controlled access to shipments. In some instances, such as at airports and seaports, controlled access is mandated and provided by the federal government through agencies like Customs and Border Protection (CBP), and the Transportation Security Administration (TSA). Private facilities, like rail yards, are protected by perimeter fencing and private police forces. Trucks operate in a different, higher risk environment. While drivers must have required credentials to access freight hubs (airports, seaports and rail yards), once the trucks are loaded, they depart the secure environment. This leaves trucks and drivers especially vulnerable to cargo theft, vehicle theft, and bodily harm. As mentioned, this is more likely to occur while trucks are stopped, meaning that the facilities truck drivers use for fuel, food, and parking need to provide a minimal level of safety to prevent theft. Cargo and driver security alone highlights the need for adequate truck parking capacity as part of our freight infrastructure. This section discusses the overall impacts of cargo theft and current efforts to minimize related costs, and Section 6.0 discusses the role of truck parking in the distribution network as it relates to safety and security. 5.1 Cargo Security and Theft Prevention Cargo security is a part of supply chain security. While supply chain security covers topics such as how natural disasters and civil unrest could potentially affect the production or transit of a product, cargo security is more focused on the transportation of the product. In Florida, cargo security applies to products arriving by truck, railroad, water, or air; products leaving the area, or those just passing through. The theft of cargo is often described as a gateway crime that can lead to broader investigations in areas like organized crime, drug trafficking, health care fraud, and even terrorism. The official definition of cargo theft, per the FBI s Uniform Crime Reporting Program (UCR), is the criminal taking of any cargo including, but not limited to, goods, chattels, money, or baggage that constitutes, in whole or in part, a commercial shipment of freight moving in commerce, from any pipeline system, railroad car, motor truck, or other vehicle, or from any tank or storage facility, station house, platform, or depot, or from any vessel or wharf, or from any aircraft, air terminal, airport, aircraft terminal or air navigation facility, or from any intermodal container, intermodal chassis, trailer, container freight station, warehouse, freight distribution facility, or freight consolidation facility. For purposes of this definition, cargo shall be deemed as moving in commerce at all points between the point of origin and the final destination, regardless of any temporary stop while awaiting transshipment or otherwise. 60
70 5.2 Impacts of Cargo Theft The impacts of cargo theft are wide-ranging, including increased costs for consumers, higher delivery costs, loss of employment for drivers, and potentially the loss of a driver s life. Data on cargo theft, has been reported to the FBI on a very limited basis for several years, and the 2013 report is the first public release of the data. Multiple agencies report their crime statistics to the UCR, and while this is a comprehensive database, other private databases, such as SensiGuard Security Services, records only those cargo thefts reported by reliable sources, such as transportation security councils, insurance companies, and law enforcement organizations. While this does not result in a 100% capture of incidents, it provides a sufficient cross-section of cargo thefts and allows the Freight Watch International Supply Chain Intelligence Center (SCIC) to identify trends and deliver in-depth, accurate analysis of the scope of cargo theft in the United States. Additionally, the SCIC only records incidents involving the theft of cargo, not standalone conveyances such as trailers, containers or bobtail tractors. A general understanding of cargo theft trends is available from the quarterly and annual reports generated by the SCIC. As shown in Figure 5.1, Florida has the fourth highest rate of cargo theft in the country, representing 9 percent of total cargo theft. Disproportionate to other states, Florida has a high percentage (29 percent) of thefts consisting of Food & Drinks. Compared to prior years, the highest theft rates nationwide were found in November (13 percent), October (11 percent), and July (10 percent). In states like Florida, Texas and Georgia, where cargo theft rates are already some of the highest in the country, major natural disasters, like Hurricanes Harvey and Irma, can further compromise supply chains. SensiGuard recorded 649 cargo thefts in the United States in 2017, with an average value of $146,063. While the volume of thefts has continued to drop, the United States is still ranked as a HIGH threat for cargo thefts, with thieves operating as organized units which hone in on shipments that can be easily fenced. As thieves refine their methods, shippers and enforcement activities need to likewise refine their supply chain security. 5.3 Existing Efforts Due to the increased cost of business as a result of cargo theft and potential for harm, efforts have been undertaken at local, state, and national levels to combat cargo theft. Locally, the Miami-Dade Police Department has annual cargo theft seminars. The Transportation Security Council of the American Trucking Association keeps a current list of agencies, by state, that are involved with cargo security. In Florida, Regional Cargo Theft Task Forces and Related Cargo Theft Organizations that are listed include Miami-Dade Police, FBI Miami, Palm Beach County Sheriff's Office, Miami International Airport--Cargo Theft Unit, Florida Statewide Cargo Theft Task Force: Florida Highway Patrol--Office of Investigations & Intelligence, Central Florida FBI Cargo Theft Task Force, Marion County Sheriff's Office, and Jacksonville Sheriff's Office. 61
71 Figure Top 10 US States for Cargo Theft, 2017 Source: Freight Watch International Supply Chain Intelligence Center. The Florida Department of Highway Safety and Motor Vehicles has a cargo theft database called the Electronic Freight Theft Management System (EFTMS). The Florida Trucking Association recommends that fleet managers report theft first to CargoNet and then to the Florida EFTMS. While CargoNet and EFTMS are related systems, the Florida Trucking Association recommends data be entered into both separately. CargoNet offers free accounts for submitting thefts; only members have access to the database. Accounts are also gratis for submitting thefts to the EFTMS; only law enforcement can access the EFTMS database. Meanwhile, a company like SensiGuard provides global and nationwide cargo theft data analysis and summary reports, and charges for their products and services such as advanced logistics monitoring technology and tracking technology and software. While the advice from the Florida Trucking Association applies to highway shipments, the EFTMS covers all modes of transportation. The Florida Commercial Vehicle and Cargo Theft Task Force partners with multiple enforcement agencies and meets multiple times per year to coordinate statewide efforts to combat cargo theft and commercial vehicle crimes. There is also now a National Commercial Vehicle and Cargo Theft Prevention Task Force (NCTTF) that works in cooperation with private industry, insurance, and Federal, state and local governments in order to combat the continued threat posed by cargo theft perpetrators to the economy, the American citizens, and the national security of the United States of America. The Task Force members have identified a need for additional information sharing and national partnering. This web site is one step in strengthening this collaborative fight in combating cargo theft. 62
72 6.0 TRUCK PARKING 63
73 6.0 Role of Truck Parking Truck parking facilities fulfill an important role in the freight community by providing a space for drivers to stop for fuel, food, restroom breaks, sleeping, and more. These facilities can provide a range of services, based on how a particular location is used. For instance, some drivers work locally and only need a space to park overnight. Facilities serving these drivers will typically only offer the bare minimum of a space to park, along with a fence and security. On the other hand, drivers that are making long-haul movements and need a place to sleep overnight would be more apt to look for a facility offering more amenities such as showers, a restaurant, and restrooms, among others. Truck parking plays a pivotal role in keeping drivers safe both on and off the road. 6.1 Background Truck parking has always been an important component of the freight network, but has often been overlooked when it came to freight investment and public knowledge. With the passage of the Moving Ahead for Progress In the 21 st Century (MAP-21) Act in 2012, Section 1401 Jason s Law made the construction of safety rest areas, commercial motor vehicle parking facilities, and electric vehicle and natural gas vehicle infrastructure eligible for federal funding. In addition, the US DOT was required to survey states within 18 months of enactment regarding commercial vehicle traffic and the ability to provide parking for such vehicles. The passage of the Fixing America s Surface Transportation (FAST) Act in 2015, further allowed for truck parking to be eligible under formula funding, including the following: Surface Transportation Block Grant Program (STBG); National Highway Freight Program (NHFP); Highway Safety Improvement Program (HSIP); National Highway Performance Program (NHPP); and Congestion Mitigation and Air Quality Improvement Program (CMAQ). Despite the availability of federal funding for truck parking, new regulations and availability of suitable land in urbanized areas have continued to exasperate the issue. The Jason s Law Truck Parking Survey Results and Comparative Analysis released by FHWA in August 2015 supports these observations. A total of 36 state DOTs (72 percent) responded that they have a problem with commercial truck parking within their state, with 31 percent observing shortages at private truck stops and 59 percent observing shortages at public rest areas. Florida, for its part, responded affirmatively to each of these inquiries. Challenges that limit new and expanded truck parking facilities include competition for available land, land purchase costs, and local opposition. 6.2 Hours of Service Hours of Service (HOS) regulations impact how long a driver may drive in a given day or over a period of seven or eight days. The Hours of Service of Drivers Final Rule was published in the Federal Register in December 2011, with an effective date of February 2012 and a compliance date of July 2013 for remaining provisions. A summary of this Final Rule is contained in Table 6.1. This summary does not include the 64
74 additional mandates established under the Electronic Logging Device (ELD) Rule published in the Federal Register in December The ELD Rule states that a motor carrier operating commercial motor vehicles must install and require each of its drivers to use an ELD to record the driver s duty status no later than December 18, Drivers and motor carriers currently using Automatic Onboard Recorders (OABRDs) may, however, continue to use them for an additional two years beyond that date. Table Summary of Hours of Service Regulations Interstate LIMIT DESCRIPTION 11-Hour Driving Limit May drive a maximum of 11 hours after 10 consecutive hours off duty May not drive beyond the 14 th consecutive hour after coming on duty, following Hour Limit consecutive hours off duty. Off-duty time does not extend the 14-hour period May drive only if eight hours or less have passed since end of driver s last off-duty Rest Break or sleeper berth period or at least 30 minutes. Does not apply to drivers using either of the short-haul exceptions in May not drive after 60/70 hours on duty in 7/8 consecutive days. A driver may 60/70-Hour Limit restart a 7/8 consecutive day period after taking 34 or more consecutive hours off duty. Drivers using the sleeper berth provision must take at least eight consecutive hours Sleeper Berth in the sleeper berth, plus a separate two consecutive hours either in the sleeper Provision berth, off duty, or any combination of the two. Source: Federal Motor Carrier Safety Administration. An understanding of these HOS and ELD mandates is an important component of understanding continued parking shortages, despite efforts to expand existing facilities or build new ones. To maximize their working hours, drivers would ideally stop just short of their maximum hours of service. However, a parking facility may not be located at that exact moment in time. Further, the closest available parking facility may already be full. As a result, drivers must risk exceeding hours of service, or saving valuable hours of service to use locating a place to park. Time wasted can be significant as some areas have very limited truck parking and many over the road/long-haul drivers may not be familiar with a local geography. Hours of service regulations differ slightly for local, intrastate-only drivers. Table 6.2 shows these hours of service regulations for the state of Florida. For the most part, these regulations are slightly more relaxed than the regulations for interstate commerce. For example, truckers may drive for 12 hours after 10 hours off duty for intrastate commerce whereas they can only drive for 11 hours for interstate commerce. However, parking challenges exist for local drivers as well. Most residential communities have restrictions that require a driver to park his/her truck elsewhere. In Miami-Dade County this has created a significant demand for overnight truck parking lots. 65
75 Table Summary of Hours of Service Regulations Intrastate LIMIT DESCRIPTION 12-Hour Driving Limit May drive a maximum of 12 hours after 10 consecutive hours off duty May not drive beyond the 16 th consecutive hour after coming on duty, following Hour Limit consecutive hours off duty. May not drive after 70/80 hours on duty in 7/8 consecutive days. A driver may 70/80-Hour Limit restart a 7/8 consecutive day period after taking 34 or more consecutive hours off duty. Record of duty status is not required providing the motor carrier maintains true time 150-Air Mile Radius records showing the time the driver reports for duty, the number of hours on-duty each day, and the time the driver goes off duty. Weekly limit does not apply to persons operating commercial motor vehicles solely within Florida during harvest periods while transporting any unprocessed agricultural products or unprocessed food or fiber that is subject to seasonal Harvest Periods harvesting from place of harvest to the first place of processing or storage or from place of harvest directly to market, or while transporting livestock, livestock feed, or farm supplies directly related to growing or harvesting agricultural products. Source: Florida Highway Patrol Office of Commercial Vehicle Enforcement. 6.3 Miami-Dade Truck Parking Studies Miami-Dade has realized parking shortages for truckers over the course of the last decade. The Miami-Dade TPO conducted two truck parking studies that were completed in September 2010 and November These studies sought to determine the availability of truck parking, the demand for truck parking, and potential locations for additional facilities to be developed. It was estimated that there were only 293 truck parking spots for both local drivers and long-haul drivers. However, the demand was determined to be in excess of 12,000 spots, which would require over 1,100 acres of land to develop. In a county with limited undeveloped land, a wide mix of land uses, and high land values, finding appropriate locations to build such facilities has proven to be a challenge despite efforts by the TPO, the Miami-Dade Freight Advisory Committee (FAC), and FDOT District 6 to encourage the development of new truck parking locations. In 2016, FDOT District 6 performed market and economic analyses regarding the feasibility of building and operating truck stop facilities at two sites owned by the State of Florida within the Greater Miami area. The proposed site at the Golden Glades Interchange had some positive attributes, including being surrounded by several major highways including I-95 and the Florida s Turnpike. The site was found to have some difficulties with traffic and access for trucks, but a gas station and convenience store could be successful as the current and projected number of cars parked each day in the lot across from SR 7 is very significant. This $55 million 66

76 project is anticipated to begin in August 2018 and be completed in January Figure 6.1 below shows the site concept. The project is currently in a Project Development and Environment re-evaluation phase. Figure 6.1 Golden Glades Interchange Truck Travel Center Concept Source: Federal Motor Carrier Safety Administration. 6.4 FDOT s Truck Parking Availability System (TPAS) Truck parking is also an issue at the state level in Florida. In an effort to help advance the topic of truck parking, FDOT has developed a real time Truck Parking Availability System (TPAS). The goal of TPAS is to install an Intelligent Transportation System (ITS) to detect available truck parking at approximately 74 public facilities across Florida s Interstate System. Additionally, the system will collect information at some private locations. These locations will include I-4, I-10, I-75, and I-95, welcome centers, weigh stations, and rest areas. This technology will utilize in-pavement sensors to detect vehicle presence in a parking space at rest areas and welcome centers which can be manually verified with closed-circuit televisions (CCTV) cameras. Weigh stations, for their part, will have sensors to monitor when trucks enter or exit a weigh station as well as the CCTV cameras. The information collected by these sensors will then be shared via smartphone applications so that truckers and dispatchers can search for available parking. This type of technology is important as it gives truckers knowledge of the road ahead of them. By knowing whether or not there is parking available at the next facility, truckers can make an informed decision to either 67
77 keep driving or modify their route or anticipated driving hours to park at a different facility. FDOT was successful in competing for a $10.8 million Infrastructure for Rebuilding America (INFRA) Grant for the initial implementation of the TPAS. This project has been implemented in various phases with some of the most recent installations occurring in February 2018 along I-10 at rest areas and weigh stations in Escambia, Santa Rosa, Okaloosa, Holmes, Jackson, Gadsden, Leon, and Jefferson Counties as well as the Florida Welcome Center in Escambia. 6.5 Current Parking Availability With a demand of 12,000 truck parking spaces, as documented by the Miami-Dade TPO studies, the supply of parking spaces is critical. As part of the Jason s Law Truck Parking Survey conducted in 2015, FHWA collected information on existing truck parking locations, both private and public, across the nation. Public facility data for this survey was sourced from FHWA while private facility data was sourced from Trucker s Friend. Table 6.3 provides a map index and additional details on each of the locations and Figure 6.2 provides a map of truck parking facilities in Miami-Dade County. This Federal Dataset was compiled several years ago and does not reflect recent truck parking developments within the county. For instance, World Property Service Inc. Truck Parking located at NW 142 nd Street off of NW 102 nd Avenue, and F and M Parking at NW 122 nd Avenue are both capable of serving several hundred trucks, but are not included in the Federal inventory. These locations are outside of the UDB, which limit the types of services they may offer drivers. However, given the limited supply, many drivers may prefer no amenities for a night as opposed to an unsafe parking location. FDOT District 6, building on work initiated by the Miami-Dade TPO, continues to explore and pursue opportunities to advance new truck parking projects. Table Truck Parking Locations in Miami-Dade County MAP TOTAL BUSINESS INTERSECTION INDEX SPACES 1 Mobil Coconut Palm Drive & Krome Avenue 12 2 Exxon SW 200 th Street & Krome Avenue 15 3 Snapper Creek HEFT North of Don Shula Expressway 24 4 Shell US 41 & Krome Avenue 30 5 USA Truck Service Plaza Okeechobee Rd/Frontage Rd & NW 77 th Avenue 90 6 FX NW South River Drive & Beacon Station Road 2 7 Pilot Travel Center NW South River Drive & NW 122 nd Street 65 8 Citgo Okeechobee Road & NW 138 th Street 10 9 Mobil NW 167 th Street & NW 27 th Avenue 8 Source: Federal Highway Administration. 68

78 Figure Truck Parking Locations in Miami-Dade County Source: Federal Highway Administration. 69
79 6.6 Future Developments The future development of truck parking locations will continue to be a local challenge. While additional truck parking locations are available in other counties, such as Broward and Palm Beach and points further north, which can serve some of the Miami-Dade market, those counties also face shortages. For most developers, the construction of a truck parking facility will not yield the highest profits, as evidenced by the lack of availability. As an example, recent land and property sales have included the sale of 181 acres for $40 million, 70 acres for $42 million, and 59 acres of developed distribution space for $59 million. Considering even the cheapest of these at approximately $220,000 per acre, the development of truck parking as determined by the Miami-Dade TPO s studies would require an investment of several billion dollars for the land alone. Companies operating within Miami-Dade County need to work with the local truck driving community in order to ensure that facilities are built into future development plans. FDOT District 6 has tentatively funded a Commercial Motor Vehicle Facility component at a proposed PORTMiami Inland Terminal (Inland Cargo and Container Distribution Center) through the National Highway Freight Program (NHFP) - $14,768,000, FY21 ( ). The funds could be available for use at a location that is selected by the county. The TPO will continue to coordinate and monitor the port s progress and selection of a site. 70
80 7.0 FREIGHT SYSTEM PERFORMANCE 71
81 7.0 Freight System Performance 7.1 Background On December 4, 2015, President Obama signed the Fixing America s Surface Transportation (FAST) Act (Pub. L. No ) into law the first federal law in over a decade to provide long-term funding certainty for surface transportation infrastructure planning and investment. The FAST Act authorizes $305 billion over fiscal years 2016 through 2020 for highway, highway and motor vehicle safety, public transportation, motor carrier safety, hazardous materials safety, rail, and research, technology, and statistics programs. The FAST Act maintains focus on safety, keeps intact the established structure of the various highway-related programs we manage, continues efforts to streamline project delivery and, for the first time, provides a dedicated source of federal dollars for freight projects. With the enactment of the FAST Act, states and local governments are now moving forward with critical transportation projects with the confidence that they will have a federal partner over the long term. One of the key provisions of the FAST Act predecessor, Moving Ahead for Progress in the 21 st Century (MAP- 21), was the establishment of a performance and outcome based program. The objective was for states to invest resources in projects that would support progress towards the achievement of national goals. Performance goals were established in seven areas: Safety, Infrastructure Condition, Congestion Reduction, System Reliability, Freight Movement and Economic Vitality, Environmental Sustainability, and Reduced Project Delivery Delays. When the new transportation bill, the FAST Act, was passed, these provisions remained unchanged, with three exceptions, including one for freight which reads as follows: MAP-21 required DOT to establish performance measures in a number of areas, including the assessment of freight movement on the Interstate System. MAP-21 also required each State to set performance targets for these measures. The FAST Act now requires that if the Administrator determines that a State has failed to meet (or to make significant progress toward meeting) its freight performance targets within two years after the establishment of the targets, the State must describe in its next performance report to DOT the actions it will take to achieve these targets. While MAP-21 was first signed into law in 2012, the final rule that established a set of performance measures for state DOTs and MPOs to use was not published until January In relation to freight performance, this final rule includes two provisions for state DOTs to follow: Truck Travel Time Reliability (TTTR). This freight performance measure solely applies to the Interstate System and is calculated using the National Performance Management Research Data Set (NPMRDS). Data is first divided into five time periods: AM Peak (6 AM 10 AM, weekdays); Mid-Day 72
 truck travel time. Congestion at truck freight bottlenecks.")
82 (10 AM 4 PM, weekdays); PM Peak (4 P. 8 PM, weekdays); Overnight (8 PM. 6 AM., all week); and Weekend (6 A.M. 8 P.M., weekends). TTTR is then determined by dividing the 95 th percentile truck travel time by the normal (or 50 th percentile) truck travel time. Congestion at truck freight bottlenecks. The State DOT shall document the location of truck freight bottlenecks within the State including those identified in the National Freight Strategic Plan. If a State has prepared a State Freight Plan under 49 USC , within the last two years, then the State Freight Plan may serve as the basis for identifying truck freight bottlenecks. If the State Freight Plan has not been updated since the previous State Biennial Performance Report, then an updated analysis of congestion at truck freight bottlenecks must be completed. The inventory of bottlenecks shall include information such as location, average annual daily truck traffic, travel-time data, and capacity features causing the bottlenecks, among others. In lay-terms a good way to describe the TTTR was found on the Wisconsin DOT website. The TTTR was related to a Planning Time Index (PTI) which incorporates your expected travel time plus the time you need to pad your trip because the roadway and travel time can be unpredictable. The PTI referenced in Figure 7.1 is the same as the TTTR Index. Figure 7.1 Info Graphic for PTI/TTTR Index To comply with the TTTR performance requirements, state DOTs were required to establish 2- and 4-year targets by May 20, 2018 and the targets are to be reported in the state s baseline performance period report due by October 1, State DOTs have the option to adjust 4-year targets in their mid-performance period progress report, due October 1, MPOs must then either support the state target or establish their own quantifiable 4-year targets within 180 days of the state target establishment. FDOT officially announced their freight targets on May 18, 2018 and the TPO has until November 14, 2018 to establish their 4 year TTTR Index target. 73

83 This Plan Update performed an analysis of historic and current TTTR Index conditions in Miami-Dade County. Figure 7.2 shows the results of data made available by FHWA through the NPMRDS. The results show that many of the high-level roadways in the Miami-Dade Freight Network are included in the NPMRDS and that the average TTTR Indices for 2015 and 2016 are very high. FHWA was contacted to better understand these results and it was indicated that the deployment of the NPMRDS detector system had not been completed in Miami-Dade County until February of 2017 and data after that time is much more accurate. Figure 7.2 Miami-Dade County Historical NPMRDS Data Source: NPMRDS Figure 7.3 provides a dashboard for Miami-Dade Highway stakeholders during 2017 peak cargo months, September, October and November, and Appendix D provides Speed Scans for each roadway. 74

84 Source: NPMRDS Figure 7.3 Miami-Dade County Highway Stakeholder TTTR Index Dashboard 2018 Miami-Dade County Freight Plan Update 75

85 As previously noted the state DOT is required to identify truck freight bottlenecks within the State including those identified in the National Freight Strategic Plan. FDOT has prepared 2 statewide bottleneck analyses in the last decade. The top bottlenecks for all traffic at the statewide and districtwide level were identified as part of the 2011 Bottlenecks on Florida SIS study. The results of that study indicated there are hundreds of bottlenecks identified across the state and summarized the Top Twenty Statewide SIS Highway Bottlenecks. The study showed a majority of the top twenty bottlenecks were located in the heavily urbanized areas especially in the Miami Dade area where fifteen of the top twenty were located, all of which fell on the following facilities: Florida s Turnpike SR 826 Palmetto Expressway SR 836 Dolphin Expressway I-95 I-75 SR Airport Expressway Note that in 2011 data tools did not differentiate between freight and passenger bottlenecks. In 2015, FDOT conducted a bottleneck study using vehicle probe data from FHWA s National Performance Measure Research Data Set (NPMRDS) that provided freight truck flows along SIS highway corridors and identified freight specific areas of congestion and bottlenecks The 2015 study showed a significant amount of the freight bottlenecks along the highway corridors were found in areas within and surrounding the urban areas of Jacksonville, Tampa Bay, Orlando, Ft. Lauderdale and Miami. Each of the corridors identified having at least one area suffering from a freight bottleneck. The results for Miami-Dade County are shown to the right. The graphic shows that for the 2013 PM Peak Period (4:00 PM to 7:00 PM) I-95 from SR 112 to the Golden Glades Interchange, US 27 from the HEFT to SR 826, the HEFT from NW 41 st Street to NW 106 th Street and SR B26 from NW 25 th Street to US 27 as freight bottlenecks PM Peak Freight Bottlenecks Congestion Low High Bottleneck Source: FDOT Bottlenecks on Florida SIS Year
86 7.2 Miami-Dade Freight Performance Targets As mentioned earlier the FDOT established their 2 and 4-year freight targets for Interstate Highways on May 18, 2018 along with other system performance measures. For informational purposes, Table 7.1 shows historic performance for the TTTR for Miami-Dade County Interstate Highways and the statewide Interstate System in comparison the 2 and 4 year freight targets identified by FDOT. The Table shows that the Miami- Dade TTTR Index is much higher than the Statewide Indices which is expected as the Florida Interstate System has long stretches of Interstate where there very little local traffic congestion occurs. If the TPO chooses to adopt the state target, the TPO is effectively stating that its highway investments will contribute to the state s overall TTTR target. Note that the TPO only need declare a 4-year target. Table TTTR Target for Miami-Dade County Interstates Annual TTTR Index by Year 2-Year 4-Year Study Area Target Target Miami-Dade County Interstates N/A TBD Statewide Interstates Source: FDOT MAP-21 Mobility Performance Measures Development, Final Report, August 24, 2017; and 2017 PM3 Performance Measures Results, Memorandum, dated February 8, 2018, from Cambridge Systematics, Inc. to FDOT. 7.3 FDOT Statewide Initiatives Beyond the Federal requirements, the Miami-Dade TPO may seek to monitor additional performance measures. At the state level, some of this work has already been completed. On an annual basis, the FDOT publishes a Source Book, which contains current and historical data and analysis describing the performance of Florida s transportation system. Figure 7.4 lists the measures in the Source Book, including multiple provisions for freight trucks, airports, rail, and seaports. While many of these statistics are reported within the Source Book at a composite level (State, District, etc.), they could also be determined for an individual MPO/TPO/TPA by FDOT. 7.4 FDOT District 6 Initiatives FDOT District 6 has identified a proactive strategy to help advance its freight and logistics system, focused on partnering with local communities to develop subarea freight plans; freight-focused plans will help identify freight mobility strategies at the project level. The Town of Medley, one of the leading freight hubs in Miami- Dade County and South Florida, was selected to be the first community to go through this process. Medley has long been a leader as an industrial center providing service to PORTMiami, Port Everglades, MIA, Florida East Coast (FEC) Railway, and the South Florida business community. With access to SR 826, I-75, Florida s Turnpike, and U.S. 27, and connections with the region s major freight activity centers, Medley is accessible 77
87 PEOPLE FREIGHT Figure Multimodal Mobility Performance Measures Matrix MODE QUANTITY QUALITY ACCESSIBILITY UTILIZATION Auto/ Truck Transit Pedestrian and Bicycle Aviation Rail Seaport Truck Aviation Rail Vehicle Miles Traveled Person Miles Traveled % of non-single Occupancy Vehicle Travel Revenue Miles Passenger Trips Passenger Boardings Passengers Passengers Combination Truck Miles Traveled Truck Miles Traveled Truck Tonnage Combination Truck Ton Miles Traveled Truck Value of Freight Tonnage Value of Freight Tonnage Seaport Tonnage Twenty-Foot Equivalent Units Value of Freight Source: Florida Department of Transportation. % Travel Meeting LOS Criteria % Miles Meeting LOS Criteria Travel Time Reliability» On-Time Arrival» Travel Time Variability Vehicle Hours of Delay Person Hours of Delay Average Travel Speed Number of Fatalities Number of Serious Injuries Rate of Fatalities Serious Injuries Rate Revenue Miles between Failures Pedestrian Level of Service Pedestrian and Bicycle Fatalities and Serious Injuries Bicycle Level of Service Departure Reliability Departure Reliability Travel Time Reliability» On-Time Arrival» Travel Time Variability Combination Truck Hours of Delay Combination Truck Average Travel Speed Combination Truck Cost of Delay Time Spent Commuting Job Accessibility Auto Weekday Span of Service Resident Access to Transit Job Accessibility Transit % Pedestrian Facility Coverage % Bicycle Facility Coverage % Population within 1 mile of Bike Lane and Shared-Use Paths Active Rail Access Seaport Rail Access % Travel Heavily Congested % Miles Heavily Congested Vehicles per Lane Mile Hours Heavily Congested Passenger Trips per Revenue Mile Demand to Capacity Ratios Truck Empty Backhaul Tonnage % Miles Heavily Congested Vehicles per Lane Mile 78
88 to local, regional, and state markets. The Medley study was followed by the Op-Locka, Miami River and Doral studies which have all been completed. These four served as a foundation in developing freight-focused projects for this Plan Update. These planning level studies assess freight accessibility to/from and within each sub-area to develop strategies to enhance access and improve freight mobility. Figure 7.5 lists all the sub-area freight planning efforts currently programmed by District 6. The Miami River Freight Improvement Plan is unique among the sub-area freight planning efforts as it does not focus on a specific town or city. Instead, this study has developed viable options to improve intermodal freight movement and assess the potential of short sea shipping along the Miami River. These studies are being utilized by this Update to identify projects that will directly enhance freight mobility in Miami-Dade County. Figure 7.5 FDOT District 6 Subarea Freight Planning Studies Sub-Area Freight Planning Efforts Name Financial FDOT FY Contract Management Contract No. Number Execution Consulting Firm Status Town of Medley Freight CTS C-9076 Improvement Plan Engineering, Inc. Completed Opa-Locka Freight Cambridge C-9P92 Improvement Plan Systematics, Inc. Completed Miami River Freight Atkins North C-9R48 Improvement Plan America, Inc. Completed Doral Freight Marlin C-9S79 Improvement Plan Engineering, Inc. Completed Miami Gardens Freight C-9X11 PE Consulting Improvement Plan (BDI) Engineering, Inc. In Progress Hialeah Freight Improvement Plan Planned Ad. Homestead Freight Improvement Plan TBD Freight Village Analysis TBD Study (Countywide) Source: Florida Department of Transportation District 6 79
89 8.0 FREIGHT SYSTEM NEEDS AND PRIORITIES 80
90 8.0 Freight System Needs and Priorities Recently Miami-Dade County has invested heavily in key infrastructure projects that will transform how freight moves throughout the region. These major projects, including the PORTMiami Tunnel, NW 25 th St Viaduct and on-port rail at PORTMiami, have long been in the planning stages. For these facilities to finally be constructed recognizes how important freight is to the local economy and the livability of County residents. Even with all these investments completed and underway, significant need remains. Short-, mid- and long-term lists of highway freight needs for Miami-Dade County were developed using stakeholder interviews, review of past plans, the TPO Transportation Improvement Plan (TIP), and 2040 LRTP, the FDOT, Miami-Dade Expressway Authority and Florida s Turnpike Enterprise work programs and master plans, the FDOT District 6 Subarea Plans, FDOT SIS plans and in consultation with our modal partners. Projects were allocated to Short-, mid- and long term programs based on priorities provided by stakeholders and project readiness for implementation. For the purposes of future programming Short Range projects were identified for construction from Fiscal Years (FY) 2019 to This time frame was selected for several reasons as it is inclusive of the current TPO TIP, the FDOT, Turnpike and MDX Work Programs and for consistency with the First 5 Years of the upcoming TPO 2045 Long Range Transportation Plan (2045 LRTP) when it is adopted in Fiscal Year Following this reasoning the 2 nd Five Year time frame is from FY 2026 to FY 2030 and the Long Range time frame is proposed for consistency with the outer years of the 2045 LRTP from FY 2031 to FY Twenty different resources and documents were utilized to develop the lists and they are sourced in a footnote to each modal list of projects proposals. The lists also include the identification of localized hot spots which were identified from projects not implemented from the 2014 Freight Plan Update and by utilizing projects shown in the first four completed FDOT subarea freight planning studies. Individual lists were developed for the seaports, airports, rail, and highways. Highway lists were developed for Freight-Related and Freight- Direct projects. Freight-related projects are projects that are needed for all traffic and will also benefit freight. Freight-direct projects are projects that will have an immediate and significant impact on freight mobility. The following sections present the lists for each mode. 8.1 Seaport Projects PORTMiami has experienced significant investment since the 2014 Freight Plan Update and many of their capital projects shown in the 2014 Update have been completed. The Port is currently developing a new master plan that will not be completed before the adoption of this Update. The list of needs for the Port is provided in Table 8.1 which was developed in close coordination with PORTMiami staff. 81
91 8.2 Airport Projects MIA has recently made extensive investments in its cargo infrastructure. The $500 million Cargo Development Program included 17 new cargo buildings with over 3.5 million square feet that were completed prior to the 2014 Freight Plan Update. MDAD staff is now working on the development of an Amendment to their Strategic Master Plan called the Cargo Optimization, Redevelopment and Expansion Plan (CORE) which was explained in detail in Section 3 of this update. Table 8.2 provides the list of Airport needs developed in close coordination with MDAD. 8.3 Railroad Projects Extensive infrastructure improvements are not planned for the railroads in Miami-Dade County. For the most part, planned improvements focus on key track upgrades, connection improvements, yard expansion and safety improvements. Table 8.3 details the projects identified in coordination with the FEC and CSX railroads. The US 27 Ramp to the Hialeah Yard is included here as a rail project because it has significant impact to the FEC Hialeah Intermodal Terminal. 8.4 Highway Projects Highway needs include corridors and connectors and major and minor facilities. As discussed earlier, projects were identified that are Freight Related where they will have impact on a broader transportation purpose and Freight Direct where they will have an immediate and direct impact on freight mobility. Given the role trucks play in the County s freight system, the extent of the list is much greater than those of the other modes. The list of needs was prioritized by identifying short-, mid- and long-term proposals for construction. Figures 8.1, 8.2 and 8.3 show the locations of the short-, mid- and long-term Freight Direct proposals, Table 8.4 provides the Freight-Direct and Table 8.5 provides the Freight-Related projects. 82
92 Project Type Project Description Source Seaport Table Seaport Project Needs 2018 MIAMI-DADE COUNTY FREIGHT PLAN UPDATE POM Gantry Crane Rail Repair and Replacement Maintenance/Other (13) POM Bays Seawall Upgrades Maintenance/Other (13) POM North Bulkhead Repairs Maintenance/Other (13) POM Bays 0-65 Seawall Rehabilitation Maintenance/Other (13) POM SFCT Cargo Yard Densification (ertg) Capacity (13) POM Cargo Gates Capacity (13) POM Procurement Super Post-Panamax Gantry Cranes Capacity (13) POM Seaboard Redevelopment Phase V Capacity (13) POM Shed E Demolition and Paving Capacity (13) POM Shed G Demolition and Paving Capacity (13) POM Seaboard Building 1306 Demolition and Paving Capacity (13) POM Seaboard Building 1630 Demolition and Paving Capacity (13) POM Federal Inspection Facility Capacity (13) POM Inland Terminal Capacity (13) POM Port Crane Management Facility Maintenance/Other (13) POM Facilities Move Maintenance/Other (13) POM Improvements to Gate Complex Seaport (18) POM Bays Sea Wall Construction Berth (18) POM Repair to Vehicular Bascule Bridge Seaport (18) POM Redevelopment of Port Blvd. INROAD (18) POM Gantry Cranes Acquisition Program BERTH (18) POM Expand and Modernize Port Utilities Seaport (18) POM Cargo Terminals Seaport (18) POM Extend Railroad Tracks Seaport (18) POM Roadway Realignments Seaport (18) POM Channel Modifications Seaport (18) POM Berth O - West New Apron Berth (18) POM Channel Modifications Seaport (18) POM Crane Maintenance Facility Seaport (18) POM Cargo Yard Stacker Cranes Program Seaport (18) POM Cargo Yard Improvements Yard (18) POM Fill SW Corner (Transhipment Yard) Transhipment yard (18) POM New Berth SW Corner 1 Berth (18) POM New Berth SW Corner 2 Berth (18) POM Cargo Berth 5 Berth (18) POM Cargo Berth 6 Berth (18) POM Cargo Berth 7 Berth (18) POM Multimodal Terminal Intermodal Container Transfer Facility (18) Sources: (1) 2014 Miami-Dade County Freight Plan Update (2) FDOT JACIP application 2/2018 (3) MDAD meeting 10/4/2017 (4) MIA CORE Program Presentation 11/2/2017 (5) PORTMiami Powerpoint at FTAC 1/10/2018 (6) Bob LeDoux, FEC 1/11/2018 MD Freight Plan Update Study Advisory Committee meeting (7) FTE Tentative 5-year Work Program FY19-23 Summary of Projects as of 9/29/2017 (8) Freight Plan Update SAC mtg 3/8/2018 (9) Draft Doral Area Freight Plan FDOT D6 (10) The Town of Medley Freight Mobility Improvement Plan FDOT 6: Final Report (11) City of Opa Locka Freight Implementation Plan FDOT 6: Final Report (12) FDOT SIS First 5-year Plan Fy (13) Alissa Penaloza, PORTMiami, 8/31/2017 (14) MDX FY Work Program Board Approved 1/31/2017 (15) Miami-Dade 2040 LRTP 10/23/2014 (16) FDOT SIS Second 5 - year plan FY (17) FDOT Strategic Intermodal System Cost Feasible Plan (18) FDOT Strategic Intermodal System: 2045 Multi-Modal Unfunded Needs Plan (19) Miami River Freight Improvement Plan (20) FDOT Final Draft Review and comment 05/14/
93 Table Airport Project Needs 2018 MIAMI-DADE COUNTY FREIGHT PLAN UPDATE Project Type Project Description Source MIA Fuel Tanker Parking Facility Ops Improvement at West Cargo Base (1) MIA Perimeter Road Widening and Realignment Access (1) MIA North East Apron and Drainage Improvements Cargo Ramp (1) MIA Building 702 Conversion and Hardstand Project Airport Ops (2) MIA New Cargo Clearance Center Airport Ops (4) Airports MIA Building 702 Extension (Optional) Airport Ops (4) MIA Building 702 Freighter Conversion and Airside Improvements Airport Ops (4) MIA Demo Building 703/703A Airport Ops (4) MIA Fuel Tender Relocation Airport Ops (4) MIA Taxiway R Realignment Airport Ops (4) MIA Construct Cargo Truck Staging Area Airport Ops (4) MIA Building 716 Apron Extension Airport Ops (4) MIA Partial Demolition Building North 1/3 Airport Ops (4) MIA Taxiway R Realignment and Extension Airport Ops (4) MIA New Cargo Clearance Center Airport Ops (4) MIA Relocate Fuel Tender Staging Area Airport Ops (4) MIA Demolition Building 704 Airport Ops (4) MIA Airside Expansion (Hardstands/GSE) Airport Ops (4) MIA Cargo Building Expansion 714 (Hardstands/GSE) Airport Ops (4) MIA Redeveloped Cargo Building 716 and Hardstands Airport Ops (4) MIA New Vertical Core Facility Concept Airport Ops (4) MIA Taxi Lot Relocation Airport Ops (8) MIA Consolidated Maintenance Facility Airport Ops (8) MIA Relocation of NW 15th Street Perimeter Road Bridge Access (8) Opa-Locka Rehab Aprons Airport Ops (1) Opa-Locka OPF Taxiway Repair Underway - Airport Ops (1) Miami Exec RIM Program Airport Ops (3) Miami Exec 128th Street Connector Improvements Access (3) Miami Exec SR 874 Connector Access (3) Miami Exec SW 157th Avenue Access Improvements Access (3) MIA Homestead General X51 Widen Building Six Parking Lots Roadway Access (1) MIA South Terminal Apron Expansion Airport Ops (4) MIA Central Base Apron Expansion Airport Ops (4) TMB Taxway H Eastward Extension Ongoing (20) TMB RIM HS1 Runway Incursion Mitigation (20) Sources: (1) 2014 Miami-Dade County Freight Plan Update (2) FDOT JACIP application 2/2018 (3) MDAD meeting 10/4/2017 (4) MIA CORE Program Presentation 11/2/2017 (5) PORTMiami Powerpoint at FTAC 1/10/2018 (6) Bob LeDoux, FEC 1/11/2018 MD Freight Plan Update Study Advisory Committee meeting (7) FTE Tentative 5-year Work Program FY19-23 Summary of Projects as of 9/29/2017 (8) Freight Plan Update SAC mtg 3/8/2018 (9) Draft Doral Area Freight Plan FDOT D6 (10) The Town of Medley Freight Mobility Improvement Plan FDOT 6: Final Report (11) City of Opa Locka Freight Implementation Plan FDOT 6: Final Report (12) FDOT SIS First 5-year Plan Fy (13) Alissa Penaloza, PORTMiami, 8/31/2017 (14) MDX FY Work Program Board Approved 1/31/2017 (15) Miami-Dade 2040 LRTP 10/23/2014 (16) FDOT SIS Second 5 - year plan FY (17) FDOT Strategic Intermodal System Cost Feasible Plan (18) FDOT Strategic Intermodal System: 2045 Multi-Modal Unfunded Needs Plan (19) Miami River Freight Improvement Plan (20) FDOT Final Draft Review and comment 05/14/
94 Table Railroad Project Needs 2018 MIAMI-DADE COUNTY FREIGHT PLAN UPDATE Project Type Project Description Source FEC Miami Freight Forwarding Yard Freight Capacity-Access (1) FEC N. Miami to Ojus Double Track Freight Capacity-Line Expansion (1) FEC NE 203RoadStreet & NE 215th Street Intersection Improvements between US-1 & W Dixie Hwy Safety-Grade Crossing (1) SFRC MR MIC Double Track Last Mile of SFRC System Capacity (1) Rail FEC N. Miami to Little River Track Upgrade Freight Capacity-Rehabilitation (1) SFRC/SFRTA Positive Train Control Safety-Grade Crossing (1) US 27 Ramp Connection to Miami Hialeah FEC Intermodal Terminal Freight Capacity-Access (6) US 27 Southeast Florida Rail Bypass Freight Capacity-Line Expansion (6) FEC Hialeah from Expand Hialeah Yard to Capacity Rail Yard (18) FEC at Auto Handling Facility Terminal (18) Railroad crossing closures and repairs on Downtown Lead (19) rail spur Sources: (1) 2014 Miami-Dade County Freight Plan Update (2) FDOT JACIP application 2/2018 (3) MDAD meeting 10/4/2017 (4) MIA CORE Program Presentation 11/2/2017 (5) PORTMiami Powerpoint at FTAC 1/10/2018 (6) Bob LeDoux, FEC 1/11/2018 MD Freight Plan Update Study Advisory Committee meeting (7) FTE Tentative 5-year Work Program FY19-23 Summary of Projects as of 9/29/2017 (8) Freight Plan Update SAC mtg 3/8/2018 (9) Draft Doral Area Freight Plan FDOT D6 (10) The Town of Medley Freight Mobility Improvement Plan FDOT 6: Final Report (11) City of Opa Locka Freight Implementation Plan FDOT 6: Final Report (12) FDOT SIS First 5-year Plan Fy (13) Alissa Penaloza, PORTMiami, 8/31/2017 (14) MDX FY Work Program Board Approved 1/31/2017 (15) Miami-Dade 2040 LRTP 10/23/2014 (16) FDOT SIS Second 5 - year plan FY (17) FDOT Strategic Intermodal System Cost Feasible Plan (18) FDOT Strategic Intermodal System: 2045 Multi-Modal Unfunded Needs Plan (19) Miami River Freight Improvement Plan (20) FDOT Final Draft Review and comment 05/14/

95 Figure Short Term Freight Direct Highway Projects ( ) 2018 Miami-Dade County Freight Plan Update 86

96 Figure Medium Term Freight Direct Highway Projects ( ) 2018 Miami-Dade County Freight Plan Update 87

97 Figure Long Term Freight Direct Highway Projects ( ) 2018 Miami-Dade County Freight Plan Update 88
98 2018 MIAMI-DADE COUNTY Project Type Map Index # FREIGHT PLAN UPDATE Project From To Description Source 1 Le Jeune Road NW 28th St North of NW 31st St Corridor Traffic Ops. Improvements (1/15) 2 Le Jeune Road NW 28th St Intersection Traffic Ops. Improvements (1/15) 3 NW 58th St NW 74th Avenue Intersection Traffic Ops. Improvements (1/15) 4 NW 72nd Avenue NW 74th Avenue SR 836 Corridor Traffic Ops. Improvements (1/15) 5 NW 74th St NW 84th Avenue NW 74th Avenue Corridor Traffic Ops. Improvements (1/15) 6 NW South River Drive NW 107th Avenue NW 74th Avenue Arterial Capacity Improvements (1) 7 Milam Dairy Road NW 58th St NW 74th St Corridor Traffic Ops. Improvements (1) N/A Medley freight hub Street light improvements Corridor Traffic Ops. Improvements (1) 8 NW 25th St NW 87th Avenue MIA Cargo Area Signal Timing Improvement (9) 9 NW 36th St NW 7100 Block NW 79th Avenue Signal Timing Improvement (9) 10 NW 72nd Ave Corporate Way NW 25th St Signal Timing Improvement (9) 11 NW 72nd Ave NW 74th St NW 74th St Connector Signal Timing Improvement (9) 12 NW 74th St NW 74th Avenue SR 826 Signal Timing Improvement (9) 13 NW 117th Avenue NW 12th St NW 41st St add two Lanes to four Lanes Divided Arterial (9) 14 NW 117th Avenue NW 25th St NW 41st St add two Lanes to four Lanes Divided Arterial (9) 15 US 27/Okeechobee Road W 8th Avenue NW 74th St Signal Timing Improvement (9) 16 PORTMiami Access I PORTMiami Access I-395 N/A At-Grade Railroad Crossings PORTMiami Via 2nd Avenue and 5th St PORTMiami Via 1st Avenue and 6th St Signal Timing Improvement (9) Signal Timing Improvement (9) Evaluate the need for rail grade separations at affected locations N/A At-Grade Railroad Crossings Countywide Monitor rail movements for future grade spearations (10) 18 Curtiss St at NW 42nd Avenue Extend left turn lane storage to 1,000 feet on Curtiss St at WB approach to NW 42nd Ave; close median at Musick St Freight Direct Highway Projects 2019 to 2025 (Short) 19 NW 135th St Opa-locka City Limits Improve signal coordination along NW 135th St (11) 20 NW 135th St NW 27th Avenue Change EB approach to one shared through right plus two through plus two left; sign to indicate EB trucks making LT to NW 27th Avenue use outer lane only; pull back SBLT stop line, add pavement marking to align new EB through and left turn traffic pattern (10) (11) (11) 21 NW 27th Avenue Opa-locka City Limits Improve signal coordination along NW 27th Ave (11) 22 NW 22nd Avenue Opa-locka City Limits Improve signal coordination along NW 22nd Ave (11) Sources: (1) 2014 Miami-Dade County Freight Plan Update (2) FDOT JACIP application 2/2018 (3) MDAD meeting 10/4/2017 (4) MIA CORE Program Presentation 11/2/2017 (5) PORTMiami Powerpoint at FTAC 1/10/2018 (6) Bob LeDoux, FEC 1/11/2018 MD Freight Plan Update Study Advisory Committee meeting (7) FTE Tentative 5-year Work Program FY19-23 Summary of Projects as of 9/29/2017 (8) Freight Plan Update SAC mtg 3/8/2018 (9) Draft Doral Area Freight Plan FDOT D6 (10) The Town of Medley Freight Mobility Improvement Plan FDOT 6: Final Report (11) City of Opa Locka Freight Implementation Plan FDOT 6: Final Report (12) FDOT SIS First 5-year Plan Fy (13) Alissa Penaloza, PORTMiami, 8/31/2017 (14) MDX FY Work Program Board Approved 1/31/2017 (15) Miami-Dade 2040 LRTP 10/23/2014 (16) FDOT SIS Second 5 - year plan FY (17) FDOT Strategic Intermodal System Cost Feasible Plan (18) FDOT Strategic Intermodal System: 2045 Multi-Modal Unfunded Needs Plan (19) Miami River Freight Improvement Plan (20) FDOT Final Draft Review and comment 05/14/2018 Table Freight Direct Highway Projects 89
99 2018 MIAMI-DADE COUNTY Project Type Map Index # Project From To Description Source 23 NW 42nd Avenue at NW 135th St 24 NW 42nd Avenue Opa-locka City Limits Add additional SB through lane and exclusive SB right turn lane at NW 42nd Avenue and NW135th St Improve signal coordination along NW 42nd Avenue/Le Jeune Road 25 Truck Parking Faciltiy at Golden Glades Interchange (12) Monitor implementation of ongoing "Iron Triangle Study" recommendations by FDOT Improve Miami River navigation channel signing and aids 28 Tunnel PD&E Study for Brickell Avenue Bridge (19) 29 NW North River Drive railroad crossings (19) 29 Upgrade private driveway rail crossings on NW North River Drive 107 Monitor NW 36th St Corridor Planning Study SR 826 US 1 Multimodal planning study to consider street cross-section traffic operations, bicycle/pedestrian/transit and freight elements. 108 Improve signal coordination along NW 27th Avenue SR 826 SR 112 (19) Monitor and manage traffic signal time and coordination with bascule bridge operations along Miami River Install a Port of Miami River wayfinding sign system for NW North River Drive and NW South River Drive FREIGHT PLAN UPDATE (11) (11) (19) (19) (19) (19) Freight Direct Highway 2019 to 2025 cont'd (Short) 32 NW 27th Avenue/NW North River Drive intersection (19) 106 NW South River Drive at NW 36th St intersection (19) 33 NW North River Drive at NW 36th St intersection (19) (19) (19) N/A Investigate potential FTZ warehouse sites or development as private sector lead (19) 34 SR 25/Okeechobee Road/US 27 NW 138th St NW 79th Avenue Corridor Traffic Ops. Improvements (1/15) 35 NW South River Drive NW 36th St Intersection Traffic Ops. Improvements (1/15) 36 NW North River Drive SR 112 NW 27th Avenue Corridor Traffic Ops. Improvements (1/15) 37 NW 82nd Avenue NW 41st St NW 25th St Arterial Capacity Improvements (1/15) 38 W 16th Avenue S Okeechobee Rd NW South River Dr Corridor Traffic Ops. Improvements (1/15) 39 NW 12th St NW 107th Avenue SR 826 Arterial Capacity Improvements (1) Freight Direct Highway Projects 2026 to 2030 (Medium) Sources: (1) 2014 Miami-Dade County Freight Plan Update (2) FDOT JACIP application 2/2018 (3) MDAD meeting 10/4/2017 (4) MIA CORE Program Presentation 11/2/2017 (5) PORTMiami Powerpoint at FTAC 1/10/2018 (6) Bob LeDoux, FEC 1/11/2018 MD Freight Plan Update Study Advisory Committee meeting (7) FTE Tentative 5-year Work Program FY19-23 Summary of Projects as of 9/29/2017 (8) Freight Plan Update SAC mtg 3/8/2018 (9) Draft Doral Area Freight Plan FDOT D6 (10) The Town of Medley Freight Mobility Improvement Plan FDOT 6: Final Report (11) City of Opa Locka Freight Implementation Plan FDOT 6: Final Report (12) FDOT SIS First 5-year Plan Fy (13) Alissa Penaloza, PORTMiami, 8/31/2017 (14) MDX FY Work Program Board Approved 1/31/2017 (15) Miami-Dade 2040 LRTP 10/23/2014 (16) FDOT SIS Second 5 - year plan FY (17) FDOT Strategic Intermodal System Cost Feasible Plan (18) FDOT Strategic Intermodal System: 2045 Multi-Modal Unfunded Needs Plan (19) Miami River Freight Improvement Plan (20) FDOT Final Draft Review and comment 05/14/2018 Table Freight Direct Highway Projects (continued) 90
100 2018 MIAMI-DADE COUNTY Project Type Map Index # FREIGHT PLAN UPDATE Project From To Description Source 40 NW 12th St NW 87th Avenue Intersection Traffic Ops. Improvements (1) 41 NW 25th St NW 89th Court SR 826 Arterial Capacity Improvements (1) 42 NW 36th St/ NW 41th St HEFT Le Jeune Road Corridor Traffic Ops. Improvements (1) 43 SR 826/Palmetto Expressway Golden Glades Dadeland Freeway Capacity Improvements (Unfunded) (1) 44 SR 836/I-395/MacArthur Causeway NW 137th Avenue Miami Beach Freeway Capacity Improvements (Unfunded) (1) 45 NW 107th Avenue Okeechobee Road 1000 ft north of NW 122nd St Arterial Capacity Improvements (1) 46 NW 87th Avenue Extension Okeechobee Road NW 58th St Arterial Capacity Improvements (1) 48 NW 12th St NW 127th Avenue TURNPIKE add two Lanes to six Lane Divided Arterial with TSM&O (9) 49 NW 25th St Fl-825/SW 137th Avenue NW 127th Avenue New Road (9) 50 NW 25th St NW 127th Avenue TURNPIKE add two Lanes to six Lane Divided Arterial with TSM&O (9) Freight Direct Highway Projects 2026 to 2030 (Medium) 51 NW 25th St and NW 67th Avenue Intersection Modification (9) 52 NW 36th St and NW 79th Avenue Intersection Modification (9) 53 NW 36th St and NW 72nd Avenue Intersection Modification (9) 54 NW 36th St and NW 7100 Block Intersection Modification (9) 55 NW 41st St NW 127th Avenue TURNPIKE add two Lanes to a four Lane Divided Arterial (9) 56 NW 58th St SR 826 Milam Dairy Road add two Lanes to a four Lane Divided Arterial (9) 57 NW 74th St NW 87th Avenue SR 826 TSM&O (9) 58 NW 74th St SR 826 Okeechobee Road add two Lanes to a eight Lane Divided Arterial (9) 59 NW 74th St and NW 77th Ct Intersection Modification (9) Sources: (1) 2014 Miami-Dade County Freight Plan Update (2) FDOT JACIP application 2/2018 (3) MDAD meeting 10/4/2017 (4) MIA CORE Program Presentation 11/2/2017 (5) PORTMiami Powerpoint at FTAC 1/10/2018 (6) Bob LeDoux, FEC 1/11/2018 MD Freight Plan Update Study Advisory Committee meeting (7) FTE Tentative 5-year Work Program FY19-23 Summary of Projects as of 9/29/2017 (8) Freight Plan Update SAC mtg 3/8/2018 (9) Draft Doral Area Freight Plan FDOT D6 (10) The Town of Medley Freight Mobility Improvement Plan FDOT 6: Final Report (11) City of Opa Locka Freight Implementation Plan FDOT 6: Final Report (12) FDOT SIS First 5-year Plan Fy (13) Alissa Penaloza, PORTMiami, 8/31/2017 (14) MDX FY Work Program Board Approved 1/31/2017 (15) Miami-Dade 2040 LRTP 10/23/2014 (16) FDOT SIS Second 5 - year plan FY (17) FDOT Strategic Intermodal System Cost Feasible Plan (18) FDOT Strategic Intermodal System: 2045 Multi-Modal Unfunded Needs Plan (19) Miami River Freight Improvement Plan (20) FDOT Final Draft Review and comment 05/14/2018 Table Freight Direct Highway Projects (continued) 91
101 2018 MIAMI-DADE COUNTY Project Type Map Index # FREIGHT PLAN UPDATE Project From To Description Source 60 NW 74th St and NW 72nd Avenue Intersection Modification (9) 61 NW 74th St and NW 69th Avenue Intersection Modification (9) 62 NW 74th St FL-826 Okeechobee Road add two Lanes to a eight Lane Divided Arterial (9) 63 NW 90th St NW 117th Avenue NW 84 Avenue New Road and Add Lanes to four Lanes Divided Arterial (9) 64 NW 90th St NW 84th Avenue NW 79th Avenue New Construction two Lane Divided Roadway (9) 65 SW 137th Avenue NW 12th St NW 41st St New two Lane Divided Roadway (9) 66 NW 127th Avenue NW 12th St NW 41st St New four Lane Divided Arterial (9) 68 NW 122nd Avenue NW 12th St NW 41st St New four Lane Divided Arterial (9) 67 NW 122nd Avenue NW 41st St NW 58th St New four Lane Divided Arterial (9) 69 NW 117th Avenue NW 41st St NW 58th St add two Lanes to a four Lane Divided Arterial (9) 70 PORTMiami Access I-395 PORT Miami Via 2nd Avenue and 5th St Geometric Modifications (9) 71 NW 106th St South River Drive to NW 116th Way add two Lanes to a four Lane Divided Arterial (10) 72 NW 138th St At NW 115th Avenue 73 SR 25 / Okeechobee Road HEFT to NW 74th St 47 SR 25 / Okeechobee Road Town of Medley N/A Medley Townwide 74 NW 42nd Ave/NW 135th St Access NW 42nd Avenue and NW 135th St within 1000 feet of intersection 75 Douglas Rd/Gratigny Parkway Douglas Rd/Gratigny Access Resurfacing to fix flood retention issues during raining conditions Use of Traffic Adaptive Signal System throughout the corridor Implement Active Arterial Management Techniques, including dynamic message sign system, CCTV coverage and detection systems that can collect traffic data Implementation of a Virtual Freight Network (VFN) that identifies operational strategies using intelligent transportation technology to improve freight mobility within Reduce access/close driveways along intersection legs of NW 42nd Ave/NW 135th St Improve Le Jeune Rd/Douglas Roadaccess to/from Gratigny interchange 76 NW 74th St Palmetto Expy FEC Intermodal Yard Modify Connector (17) N/A Develop truck staging area near NW 37th Avenue (19) 77 Proposed ramps to and from the east on SR 112/Airport Expressway at NW 37th Avenue (10) (10) (10) Freight Direct Highway Projects 2026 to 2030 (Medium) N/A Reconstruct NW South River Drive (19) N/A NW South River Drive improvement (19) (10) (11) (11) (19) N/A N/A Access management along south frontage of NW North River Drive Local street improvements in industrial district north of NW North River Drive (19) (19) N/A Develop railroad intermodal ramp (19) N/A N/A Explore development of a short sea shipping concept Investigate bulkhead repair program utilizing SIS and other funds Miami River (19) Miami River (19) Sources: (1) 2014 Miami-Dade County Freight Plan Update (2) FDOT JACIP application 2/2018 (3) MDAD meeting 10/4/2017 (4) MIA CORE Program Presentation 11/2/2017 (5) PORTMiami Powerpoint at FTAC 1/10/2018 (6) Bob LeDoux, FEC 1/11/2018 MD Freight Plan Update Study Advisory Committee meeting (7) FTE Tentative 5-year Work Program FY19-23 Summary of Projects as of 9/29/2017 (8) Freight Plan Update SAC mtg 3/8/2018 (9) Draft Doral Area Freight Plan FDOT D6 (10) The Town of Medley Freight Mobility Improvement Plan FDOT 6: Final Report (11) City of Opa Locka Freight Implementation Plan FDOT 6: Final Report (12) FDOT SIS First 5-year Plan Fy (13) Alissa Penaloza, PORTMiami, 8/31/2017 (14) MDX FY Work Program Board Approved 1/31/2017 (15) Miami-Dade 2040 LRTP 10/23/2014 (16) FDOT SIS Second 5 - year plan FY (17) FDOT Strategic Intermodal System Cost Feasible Plan (18) FDOT Strategic Intermodal System: 2045 Multi-Modal Unfunded Needs Plan (19) Miami River Freight Improvement Plan (20) FDOT Final Draft Review and comment 05/14/2018 Table Freight Direct Highway Projects (continued) 92
102 2018 MIAMI-DADE COUNTY Project Type Map Index # Project From To Description Source Sources: (1) 2014 Miami-Dade County Freight Plan Update (2) FDOT JACIP application 2/2018 (3) MDAD meeting 10/4/2017 (4) MIA CORE Program Presentation 11/2/2017 (5) PORTMiami Powerpoint at FTAC 1/10/2018 (6) Bob LeDoux, 78 NW 116th Way Okeechobee Road South River Drive Corridor Traffic Ops. Improvements (1/15) Way-Finding Sign Improvement Program Corridor Traffic Ops. Improvements (1/15) 79 NW 25th St HEFT NW 89th Court Corridor Traffic Ops. Improvements (1) 80 SR 997/Krome Truck By-Pass Along Flagler Ave/Civic Court NE 6th Ave Arterial Capacity Improvements (1) 81 NW 107th Avenue NW 25th St NW 41st St / Campbell Dr Arterial Capacity Improvements (1) 82 NW 117th Avenue NW 12th St NW 58th St Corridor Traffic Ops. Improvements (1) 83 Medley Bridge/Canal Improvement Program Integration of Truck Route System & Regional ITS Network improvements NW 121st Way, NW 116th Way, NW 105th Way, NW 79th Ave Corridor Traffic Ops. Improvements (1) ITS Improvements (1) 84 SR 836 SR 825/SW 137th Avenue NW 127th Avenue add two Managed Lanes (9) 85 SR 836 NW 127th Avenue HEFT add two Expressway Lanes (9) 86 NW 25th St Viaduct NW 117th Avenue NW 107th Avenue Transition to At Grade (9) NW 25th St Viaduct MIA Cargo Area New Intermodal Center + Viaduct Ext (9) 87 NW 25th St Viaduct WB to SB at SR 826 Intersection Improvement (9) 88 NW 25th St and NW 75th Avenue Intersection Modification (9) 89 NW 36th St and NW 79th Avenue Lane Reconfiguration (9) 90 NW 36th St FREIGHT PLAN UPDATE at NW 67th & 66th Avenue & Perimeter Road Highway Freight Direct Projects 2031 to 2045 (Long) Intersection Modifications (9) 91 NW 74th St and NW 72nd Ave Access Management (9) 92 NW 87th Avenue NW 58th St NW 74th St add two Lanes to a six Lane Divided Arterial (9) 93 NW 107th Avenue NW 90th St NW 122th St add two Lanes to a four Lane Divided Arterial (9) 94 NW 117th Avenue NW 58th St NW 74th St add two Lanes to four Lane Divided Arterial (9) 95 NW 117th Avenue NW 74th St NW 90th St New four Lane Divided Arterial (9) Sources: (1) 2014 Miami-Dade County Freight Plan Update (2) FDOT JACIP application 2/2018 (3) MDAD meeting 10/4/2017 (4) MIA CORE Program Presentation 11/2/2017 (5) PORTMiami Powerpoint at FTAC 1/10/2018 (6) Bob LeDoux, FEC 1/11/2018 MD Freight Plan Update Study Advisory Committee meeting (7) FTE Tentative 5-year Work Program FY19-23 Summary of Projects as of 9/29/2017 (8) Freight Plan Update SAC mtg 3/8/2018 (9) Draft Doral Area Freight Plan FDOT D6 (10) The Town of Medley Freight Mobility Improvement Plan FDOT 6: Final Report (11) City of Opa Locka Freight Implementation Plan FDOT 6: Final Report (12) FDOT SIS First 5-year Plan Fy (13) Alissa Penaloza, PORTMiami, 8/31/2017 (14) MDX FY Work Program Board Approved 1/31/2017 (15) Miami-Dade 2040 LRTP 10/23/2014 (16) FDOT SIS Second 5 - year plan FY (17) FDOT Strategic Intermodal System Cost Feasible Plan (18) FDOT Strategic Intermodal System: 2045 Multi-Modal Unfunded Needs Plan (19) Miami River Freight Improvement Plan (20) FDOT Final Draft Review and comment 05/14/2018 Table Freight Direct Highway Projects (continued) 93
")
103 Table Freight Direct Highway Projects (continued) 2018 Miami-Dade County Freight Plan Update 94
104 2018 MIAMI-DADE COUNTY FREIGHT PLAN UPDATE Project Type Project From To Description Source SR 821/HEFT SR 874 I-75 Underway - Widen, Add Managed Lanes (1) NW 12th Street NW 107th Avenue SR 826 Underway- Widen from 4 lanes to 6 lanes, improve signal coordination (1) SR 997/Krome Avenue South of Flagler Avenue SW 296th Street (Truck Route) Underway - Widen (12) I-75 at Miami Gardens Drive Underway - Modify Interchange (17) SR 836 Operational, Capacity and Interchange Improvements NW 57th Avenue NW 17th Avenue SR 836 Interchange Modifications at 87th Avenue SR 836 West of 82nd Avenue NW 97th Avenue SR 826/Palmetto Expressway I-75 SR 836 Underway - New SR 836 Eastbound Auxiliary Lane from NW 57th Avenue to Le Jeune Road; SR 836 Eastbound additional lane from Le Jeune Road to NW 27th Avenue; SR 836 Westbound additional lane from 17th Avenue to 57th Avenue and improvements to the interchanges at NW 57th Avenue, Le Jeune Road, NW 27th Avenue and NW 17th Avenue. Underway - Reconstruction of the NW 87th Avenue Interchange and SR 836 Mainline to 500 feet West of NW 82nd Avenue. Underway - Add managed lanes Interchange Improvements SR 826/Palmetto Expressway (NB) Okeechobee Road NW 103rd St Underway- Add 1 NB auxiliary lane (1) SR 836/I-95 Interchange Ramps NW 17th Avenue I-95 Modify Interchange (12) SR 826/Palmetto Expressway SR 826 Eastbound Ramp SR 9A/I-95 Northbound Modify Interchange (12) SR 826/Palmetto Expressway I-75 I-95 Managed Lanes (12) I-75 S. of NW 170th St MiamI-Dade County Line Managed Lanes (12) SR 821/HEFT SW 216th St Eureka Dr Widen from 6 to 10 lanes (1) SR 821/HEFT Eureka Dr Kendall Dr Widen to 8-, 10-, 12-lanes plus auxiliary lanes (1) SR 821/HEFT Kendall Dr I-75 Widen from 6/8 lanes to 10 lanes (1) NW 20th St NW 27th Avenue I-95 Roadway infrastructure improvements (1) NW 25th St NW 117th Avenue SR 821/HEFT Interchange Improvements Hainlin Mill Drive Widen 25th St to include reversible lanes. Provide adequate left-turn bay lengths, incldue access management median opening closures within 1,000 feet of the intersection and provide adequate turning ratio Increase operational capacity, improve safety, address roadway and structural deficiencies, and enhance overall traffic operations on the Turnpike / SR 821 at Hainlin Mill Drive Interchange. Also includes improvements along the Turnpike / SR 821 and surface streets. (14) (14) (1) Freight Related Highway Projects Current to 2025 (Short) HEFT From MP 0 to MP 5.1, and ramps from MP 5.1 MP 9.2 Work includes milling and resurfacing, guardrail installation, and signing and pavement marking improvements. (1) (7) (7) SR 25/Okeechobee Rd/US 27 E. of NW 117th Avenue E. of NW 107 Avenue Modify Interchange (12) SR 112/I-195 Frontage Road & Ramp Realignment Miami Design District New Road (12) Sources: (1) 2014 Miami-Dade County Freight Plan Update (2) FDOT JACIP application 2/2018 (3) MDAD meeting 10/4/2017 (4) MIA CORE Program Presentation 11/2/2017 (5) PORTMiami Powerpoint at FTAC 1/10/2018 (6) Bob LeDoux, FEC 1/11/2018 MD Freight Plan Update Study Advisory Committee meeting (7) FTE Tentative 5-year Work Program FY19-23 Summary of Projects as of 9/29/2017 (8) Freight Plan Update SAC mtg 3/8/2018 (9) Draft Doral Area Freight Plan FDOT D6 (10) The Town of Medley Freight Mobility Improvement Plan FDOT 6: Final Report (11) City of Opa Locka Freight Implementation Plan FDOT 6: Final Report (12) FDOT SIS First 5-year Plan Fy (13) Alissa Penaloza, PORTMiami, 8/31/2017 (14) MDX FY Work Program Board Approved 1/31/2017 (15) Miami-Dade 2040 LRTP 10/23/2014 (16) FDOT SIS Second 5 - year plan FY (17) FDOT Strategic Intermodal System Cost Feasible Plan (18) FDOT Strategic Intermodal System: 2045 Multi-Modal Unfunded Needs Plan (19) Miami River Freight Improvement Plan (20) FDOT Final Draft Review and comment 05/14/2018 Table Freight Related Highway Projects 95
105 2018 MIAMI-DADE COUNTY FREIGHT PLAN UPDATE Project Type Project From To Description Source SR 9A/I-95 Southbound Ramp to Westbound SR 836 Golden Glades Interchange Improvements (Mainline Spur MP 0x) Golden Glades Interchange Improvements N/B Direct Connect Bridge SR 9a/I-95 Southbound Ramp Westbound SR 836 Modify Interchange (12) SR 91/Turnpike Southbound Modify Interchange (12) SR 91/Turnpike Southbound Bridge (12) Golden Glades Interchange SB Turnpike SB I-95 at NW 135th St Modify Interchange (17) Golden Glades Interchange: SR-826/Palmetto Expy NW 17th Avenue at SR 826 NB I-95 at NW 183rd St Modify Interchange (17) SR 91/Florida's Turnpike I-95 / Golden Glades Operational improvements from Golden Glades interchange to Turnpike / SR 91 SB to I-95 SB. SR 836/I-395 West of I-95 MacArthur Cswy Bridge Bridge (12) SR 25/Okeechobee Rd/US 27 E. of NW 107 Avenue E. of NW 116th Way Grade Separation (12) Golden Glades I-95, SR 826 and Florida's Turnpike Modify Interchange (12) I-95 NB Biscayne River Canal SR 860/Miami Gardens Drive Add two Auxiliary Lanes (12) SR 836 New HEFT Ramp Connections SR 836 SR 924/Gratigny Parkway Partial Interchange at NW 67th Avenue Homestead Extension of Florida's Turnpike SR 924 NW 67th Avenue SR 112 Ramp Improvements at NW 37th Avenue SR 112 NW 37th Avenue SR 874/Don Shula Expressway SW 72nd St SR 874 SR 836 Extension - Westbound Access Ramp SR 836 Extension Westbound NW 107th Avenue SR 836 Infrastructure Modifications for Open Road Tolling (West SECTION) NW 137th Avenue NW 62nd Avenue New connections from SR 836 to the Homestead Extension of the Florida's Turnpike (HEFT) including eastbound SR 836 to northbound HEFT general purpose lanes, and southbound HEFT general purpose lanes to westbound SR 836. New westbound on and off ramp from NW 67th Avenue and new eastbound on-ramp from NW 67th Avenue. New partial interchange at SR 112 and NW 37th Avenue. New movements SR 112 include eastbound on-ramp at NW 37th Avenue as well as a westbound off-ramp at NW 37th Avenue. New southbound exit ramp to SW 72nd St and new northbound entrance ramp to SR 874 from SW 72nd St. New public-use access ramp from West of NW 107th Avenue to SR 836 westbound extension. Modification of toll plaza, installation of gantries and system signage, and modification to SR 836 and ramps near existing toll plaza. (7) (14) (14) Freight Related Highway Projects Current to 2025 (Short) cont'd SR 997/Krome Avenue SW 312th St/Campbell Drive SW 136 St Add two Lanes to four Lanes Divided (12) SR 826/Palmetto Expressway Connector At Golden Glades Modify Interchange (12) SR 25/Okeechobee Rd/US 27 Broward County Line West of HEFT Add two Auxiliary Lanes (12) SR 836 / I-95 Interchange Improvements NW 17th Avenue I-95 Widening and operational improvements to SR 836 EB from NW 17th Ave to I-95, widening of the SR 836 bridges over the Miami River and improvements to the SR 836 WB mainline and new connector serving SB I-95 traffic destined WB on SR 836 and to the Civic Center. (14) (14) (14) (14) (14) Conduct transit circulator feasibility study to serve Palmer Lake and western Miami River corridor Sources: (1) 2014 Miami-Dade County Freight Plan Update (2) FDOT JACIP application 2/2018 (3) MDAD meeting 10/4/2017 (4) MIA CORE Program Presentation 11/2/2017 (5) PORTMiami Powerpoint at FTAC 1/10/2018 (6) Bob LeDoux, FEC 1/11/2018 MD Freight Plan Update Study Advisory Committee meeting (7) FTE Tentative 5-year Work Program FY19-23 Summary of Projects as of 9/29/2017 (8) Freight Plan Update SAC mtg 3/8/2018 (9) Draft Doral Area Freight Plan FDOT D6 (10) The Town of Medley Freight Mobility Improvement Plan FDOT 6: Final Report (11) City of Opa Locka Freight Implementation Plan FDOT 6: Final Report (12) FDOT SIS First 5-year Plan Fy (13) Alissa Penaloza, PORTMiami, 8/31/2017 (14) MDX FY Work Program Board Approved 1/31/2017 (15) Miami-Dade 2040 LRTP 10/23/2014 (16) FDOT SIS Second 5 - year plan FY (17) FDOT Strategic Intermodal System Cost Feasible Plan (18) FDOT Strategic Intermodal System: 2045 Multi-Modal Unfunded Needs Plan (19) Miami River Freight Improvement Plan (20) FDOT Final Draft Review and comment 05/14/2018 (19) Table Freight Related Highway Projects (continued) 96
106 2018 MIAMI-DADE COUNTY FREIGHT PLAN UPDATE Project Type Project From To Description Source SR 821/HEFT US 1 Campbell Drive Add two Lanes to six Lanes Expressway (7) SR 826/Palmetto Expressway I-75 NW 17th Avenue Managed Lanes (16) SR 25/Okeechobee Road/US 27 East of NW 87th Avenue NW 79th Ave Add two to Build eight Lanes (12) SR 25/Okeechobee Road/US 27 East of NW 116th way East of NW 87th Ave Grade Separation (12) SR 25/Okeechobee Road/US 27 at SR 826/Palmetto Expressway Various Ramps (12) SR 924/Gratigny Parkway Extension West to the HEFT HEFT Existing SR 924 Expressway extension from SR 924 West to the Homestead Extension of the Florida's Turnpike (HEFT). Segment 1-107th Avenue to HEFT including feasibility analysis for a potential ramp at 87th Avenue, Segment 2-97th Avenue to 107th Avenue, and Segment 3-97th Avenue to SR 826. This work program includes funding for Design-Build of Segment 1 WB and Segment 2, and Final Design for Segments 1 EB and 3 EB. SR 924/Gratigny Parkway Extension East to I-95 Existing SR 924 at NW 32nd Avenue I-95 Expressway Extension (14) (14) SR 826/Palmetto Expressway NW 103rd St NW 154th St Ultimate Improvement, Modify Interchange (17) NW 21st Street/NW 32nd Avenue NW 37th Avenue NW 28th St Construct high level bridge (1) SR 25/Okeechobee Rd/US 27 Krome Avenue NW 79th Avenue Expressway Conversion-Construct Grade Separated Overpasses at Major Intersections. New Interchange at NW 79th Avenue, Krome Ave/SR 997, NW 103 St/NW 87th Avenue SR 25/Okeechobee Rd/US 27 Krome Avenue SR 826 Conversion to limited access toll facility (1) NW North River Dr NW 107th Avenue NW 74th Avenue NW South River Dr & Medley Bridges connecting to Okeechobee Rd/US 27 Medley's NW South River Drive Bridges US 27/Okeechobee Road NW North River Dr NW 107th Avenue NW 74th Avenue Medley Bridge/Canal Improvement Program NW 121st St Way, NW 116th Way,NW 105th Way, NW 79th Avenue Widen North River Drive to include shoulders and improved access management Widen bridges and intersections between Okeechobee Roadand NW South River Dr. Address inadequate geometry and improve freight and truck movements Widen North River Drive to include shoulders and improved access management Improve the connections between Okeechobee Roadand Medley through a combination of bridge widening and canal improvements Sources: (1) 2014 Miami-Dade County Freight Plan Update (2) FDOT JACIP application 2/2018 (3) MDAD meeting 10/4/2017 (4) MIA CORE Program Presentation 11/2/2017 (5) PORTMiami Powerpoint at FTAC 1/10/2018 (6) Bob LeDoux, FEC 1/11/2018 MD Freight Plan Update Study Advisory Committee meeting (7) FTE Tentative 5-year Work Program FY19-23 Summary of Projects as of 9/29/2017 (8) Freight Plan Update SAC mtg 3/8/2018 (9) Draft Doral Area Freight Plan FDOT D6 (10) The Town of Medley Freight Mobility Improvement Plan FDOT 6: Final Report (11) City of Opa Locka Freight Implementation Plan FDOT 6: Final Report (12) FDOT SIS First 5-year Plan Fy (13) Alissa Penaloza, PORTMiami, 8/31/2017 (14) MDX FY Work Program Board Approved 1/31/2017 (15) Miami-Dade 2040 LRTP 10/23/2014 (16) FDOT SIS Second 5 - year plan FY (17) FDOT Strategic Intermodal System Cost Feasible Plan (18) FDOT Strategic Intermodal System: 2045 Multi-Modal Unfunded Needs Plan (19) Miami River Freight Improvement Plan (20) FDOT Final Draft Review and comment 05/14/2018 (1) (1) (10) (1) (1) Table Freight Related Highway Projects (continued) Highway Freight Related Projects 2031 to 2045 (Long) Freight Related Highway Projects 2026 to 2030 (Medium) 97
107 2018 MIAMI-DADE COUNTY FREIGHT PLAN UPDATE Project Type Project From To Description Source Connect 4 Express SR 836 SR 924 New expressway connecting SR 836, SR 112 and SR 924. Includes system interchanges with SR 112 and SR 924 and potential service interchanges with NW 54th St, NW 79th St and NW 103 Road with connectors to NW 37th Avenue. I-95 at NW 20th St NW 20th St New Interchange (18) SR 836 SW Extension (MDX) NW 137th Avenue SW Kendall New expressway connecting SR 836, SR 112 and SR 924. Includes system interchanges with SR 112 and SR 924 and potential service interchanges with NW 54th St, NW 79th St and NW 103 Road with connectors to NW 37th Avenue. SR 836 Managed Lanes NW 87th Avenue HEFT Managed Lanes (18) SR 836 Managed Lanes East of SR 826 West of SW 27 Avenue Managed Lanes (18) NW 25th St Viaduct NW 82nd Avenue NW 107th Avenue Grade Seaparated Viaduct (18) SR 826/Palmetto Expressway SR 836 US 1 Managed Lanes (18) SR 826/Palmetto Expressway/ Okeechobee Road SR 826 US 27/Okeechobee Road Modify Interchange (18) SR 25/Okeechobee Road SR 826 Krome Avenue Ultimate Improvement (17) I-75 SR-826 NW 170th St Ultimate Improvement (17) I-75 at NW 138th St Modify Interchange (18) I-75 / SR 826 Int. I-75 SR 826 Modify Interchange (18) I-75 Corridor Improvements NW 138th St SR 826 Ultimate Improvement (18) I-75 / Miami Gardens Dr. Interchange HEFT NW 170th St. Ultimate Improvement (18) I-75 / HEFT Interchange Collector Distributor Road Miami Gardens Dr Modify Interchange (18) SR 90 at I-95 Modify Interchange (18) I-95 US 1 Broward County line Managed Lanes and Transitway Ultimate Improvement (18) I-195 Terminus of I-195 I-95 Ultimate Improvement (18) (18) (18) Sources: (1) 2014 Miami-Dade County Freight Plan Update (2) FDOT JACIP application 2/2018 (3) MDAD meeting 10/4/2017 (4) MIA CORE Program Presentation 11/2/2017 (5) PORTMiami Powerpoint at FTAC 1/10/2018 (6) Bob LeDoux, FEC 1/11/2018 MD Freight Plan Update Study Advisory Committee meeting (7) FTE Tentative 5-year Work Program FY19-23 Summary of Projects as of 9/29/2017 (8) Freight Plan Update SAC mtg 3/8/2018 (9) Draft Doral Area Freight Plan FDOT D6 (10) The Town of Medley Freight Mobility Improvement Plan FDOT 6: Final Report (11) City of Opa Locka Freight Implementation Plan FDOT 6: Final Report (12) FDOT SIS First 5-year Plan Fy (13) Alissa Penaloza, PORTMiami, 8/31/2017 (14) MDX FY Work Program Board Approved 1/31/2017 (15) Miami-Dade 2040 LRTP 10/23/2014 (16) FDOT SIS Second 5 - year plan FY (17) FDOT Strategic Intermodal System Cost Feasible Plan (18) FDOT Strategic Intermodal System: 2045 Multi-Modal Unfunded Needs Plan (19) Miami River Freight Improvement Plan (20) FDOT Final Draft Review and comment 05/14/2018 Table Freight Related Highway Projects (continued) Highway Freight Related Projects 2031 to 2045 (Long) 98
108 9.0 FINDINGS AND STRATEGIES 99
109 9.0 Findings and Strategies With an established and mature logistics infrastructure, and critical investments in place or under construction to modernize and advance the region, Miami-Dade County is well positioned for continued growth in freightrelated industries. With the next wave of project needs identified, an effective investment strategy is critical to Miami-Dade s future. The list of projects developed in this update will be considered for funding in the development of the TPO s Year 2045 Long Range Transportation Plan (2045 TPO LRTP). However it must be noted that the LRTP is cost constrained and that needs will far exceed traditional funding sources. The TPO and its partners should collaborate to leverage as additional public funding resources for freight projects and to coordinate with the private sector on leveraging opportunities, including, the proposed PORTMIami Intermodal Terminal, truck parking and development of the CORE program at MIA. As global shifts continue, and Florida advances its global logistics competitiveness, Miami-Dade County needs to continue to develop and implement strategies that ensure it remains competitive and positioned for growth. Maximizing freight and logistics opportunities will complement other investments designed to transition Miami into a world class city. The following highlights key short-term and ongoing strategies to advance Miami-Dade County s freight program: Maximize use of available funding programs. Maximize the use of Federal, State, County and City traditional funds to implement project needs. In addition, there are a significant number of programs available to help advance freight projects. Programs like the Infrastructure For Rebuilding America (INFRA), State Infrastructure Banks (SIB), FDOT SIS, and FDOT Intermodal Funds have been used to advance critical projects in Miami-Dade County. Applications, as appropriate, should be routinely submitted to these and other programs to ensure Miami-Dade County and its partners are competing for all available funding. Leverage investments through public/private partnerships. Miami-Dade County is home to one of the largest public/private partnerships (P3); this partnership helped successfully deliver the PORTMiami Tunnel. Regardless of the scale of the project, P3s can help accelerate critical investments through shared risk. Opportunities for additional P3s should be identified and pursued, as appropriate to help advance remaining freight system needs. In addition, these types of partnerships can help put together local funding matches when pursuing available funding grants from State and Federal partners. Continue to monitor and support the pending requests for the designation of US 27 as a Critical Urban Freight Corridor and Critical Rural Freight Corridor, as applicable, of the National Highway Freight Network and FDOT Strategic Intermodal System designation for the Miami-Opa Locka Executive Airport. Both of these strategies are key to unlocking additional funding sources for 2 significant components of the Miami-Dade County Freight Network. Official request documents are provided in Appendices A and C. Coordinate and monitor PORTMiami s progress on the identification of an Inland Terminal PORTMiami is in the process of evaluating locations for the development of an off-site location for 100
110 potential intermodal, transload, laydown and other potential uses. Growth at the port for both cruise and cargo operations must be rationalized and some cargo operations could be located away from the port with good highway and rail connections. At the time of this Update, the port had identified 16 potential locations. Three locations were reviewed for use and conceptual design. The concepts are provided in Appendix B. Continue to coordinate with FDOT District 6 on the development of subarea freight studies. FDOT District 6 has funded a series of subarea freight studies that were critical in the development of freight infrastructure and operations projects that directly enhance freight mobility for this update. Continue to coordinate with local stakeholders on the development of truck parking facilities. This update has documented the lack of private incentive to develop a major due to land costs. The TPO should continue to collaborate with Miami-Dade County and the FDOT on identifying public property and/or funding to support the development of a major full service trucking facility. The TPO should monitor progress of funding for the FDOT 6 NHS Intermodal Connector projects including opportunities to be funded through Federal grants, the FDOT SIS program, County funds. Monitor the progress of advocacy groups for the prevention of cargo theft. The Florida Commercial Vehicle and Cargo Theft Task Force partners with multiple enforcement agencies and meets multiple times per year to coordinate statewide efforts to combat cargo theft and commercial vehicle crimes. There is also now a National Commercial Vehicle and Cargo Theft Prevention Task Force (NCTTF) that works in cooperation with private industry, insurance, and Federal, State and local governments in order to combat the continued threat posed by cargo theft perpetrators to the economy. The Task Force members have identified a need for additional information sharing and national partnering and developed a website as a step in strengthening this collaborative fight in combating cargo theft. Promote economic contributions of freight and logistics industry. Transportation and economic development investments take place within a competitive environment. The funding PORTMiami has received to prepare it for the next generation of cargo vessels was hard fought for through demonstration of overall benefits. The ability to quantify the economic impacts associated with freight project investments will be critical in the successful solicitation of local, State, and Federal funds. Impact tools and marketing materials should be developed and used to educate key decision-makers. Maximize use of available funding programs. There are a significant number of programs available to help advance freight projects. Programs like the Infrastructure For Rebuilding America (INFRA), State Infrastructure Banks (SIB), FDOT Strategic Intermodal System (SIS), and FDOT District 6 Intermodal Funds have been used to advance critical projects in Miami-Dade County. Applications, as appropriate, should be routinely submitted to these and other programs to ensure Miami-Dade County and its partners are competing for all available funding. Leverage investments through public/private partnerships. Miami-Dade County is home to one of the largest public/private partnerships; this partnership helped successfully deliver the PORTMiami 101
111 Tunnel. Regardless of the scale of the project, P3s can help accelerate critical investments through shared risk. Opportunities for additional P3s should be identified and pursued, as appropriate to help advance remaining freight system needs. In addition, these types of partnerships can help put together local funding matches when pursuing available funding grants from State and Federal partners. Continue to coordinate with local stakeholders on the development of truck parking facilities. The future development of truck parking locations will continue to be a local challenge and will require support from stakeholders. Evaluate the effectiveness of the freight system. The FAST ACT requires implementation of a monitoring program to help track the performance of the freight system as well as the effectiveness of the freight program. The TPO must identify a four year target for performance passed on Truck Travel Time Reliability information from the National Performance Measure Research Data Set (NPMRDS). Engage the freight community in the identification of freight bottlenecks. In anticipation of the FDOT-identified list of freight bottlenecks it is recommended the TPO and stakeholders utilize the NPMRDS to identify bottlenecks. Appendix D provides documentation of the speed scans for the Fall of 2017 Truck traffic in Miami-Dade County. In addition, the Miami-Dade TPO Freight Transportation Advisory Committee should also be engaged with freight industry input on bottlenecks. Ensure trade and logistics remain a targeted industry. Significant work has been undertaken over the last several years by the Florida Chamber Foundation and the Beacon Council, along with many others, to elevate trade and logistics to the list of targeted industries. As a result, different types of economic incentives are available to the industry to drive growth. It is critical that the industry remain designated and that economic development professionals use available incentive to attract and grow businesses in Miami-Dade County. Support work force development programs. The trade and logistics industries are aging and the availability of a trained workforce has become one of the most critical concerns to many companies. Workforce Florida, FDOT, and the Florida Chamber have all expressed the need for more training programs; in fact, FDOT recently conducted a study designed to explore the development of an Intermodal and Logistics Academy. Miami-Dade County should take an active role in workforce development. Continue to develop, test and expand pilot programs. Miami-Dade County is home to several innovative pilot programs developed to address critical bottlenecks in our international trade regulations and operations. The Perishables Coalition, the Transshipment Committee, and Customs and Border Patrol s Reimbursable Services Authority all represent exceptions to Federal trade regulations or new ways to manage the programs. More recently the International Air Transport Association (IATA) recognized MIA as the first IATA Designated Pharma Hub Airport in the U.S. and only the second in the world. Local leaders should continue to expand these pilots and identify new innovations. Monitor ILC developments and partner as appropriate. The larger master planned ILC proposals in the heartland of South Florida have the potential to significantly expand the logistics capacity of the 102
112 region and the State as they come online. These developments are taking longer than expected to break ground, but when they do it will be important for Miami-Dade County businesses and government leadership to engage with these developers to establish business relationships. In the longer term, this connection will be even more critical as the County s ability to expand warehouse capacity diminishes. Promote regional freight mobility. Finally, it is important to recognize that the Miami Urbanized Area covers three counties in South Florida. This integrated region is home to over six million residents and millions of annual tourists. The freight companies serving this market do not recognize County lines; they only care about overall access and mobility. The Miami-Dade TPO has partnered with its counterparts in Broward and Palm Beach counties to ensure there is a regional plan. It will be important to ensure consistency, as appropriate, between the County and regional plans. 103
113 Appendix A Miami-Dade Transportation Planning Council Resolution #11-18 Supporting US 27 as Part of NHFN 104
114 105
115 106
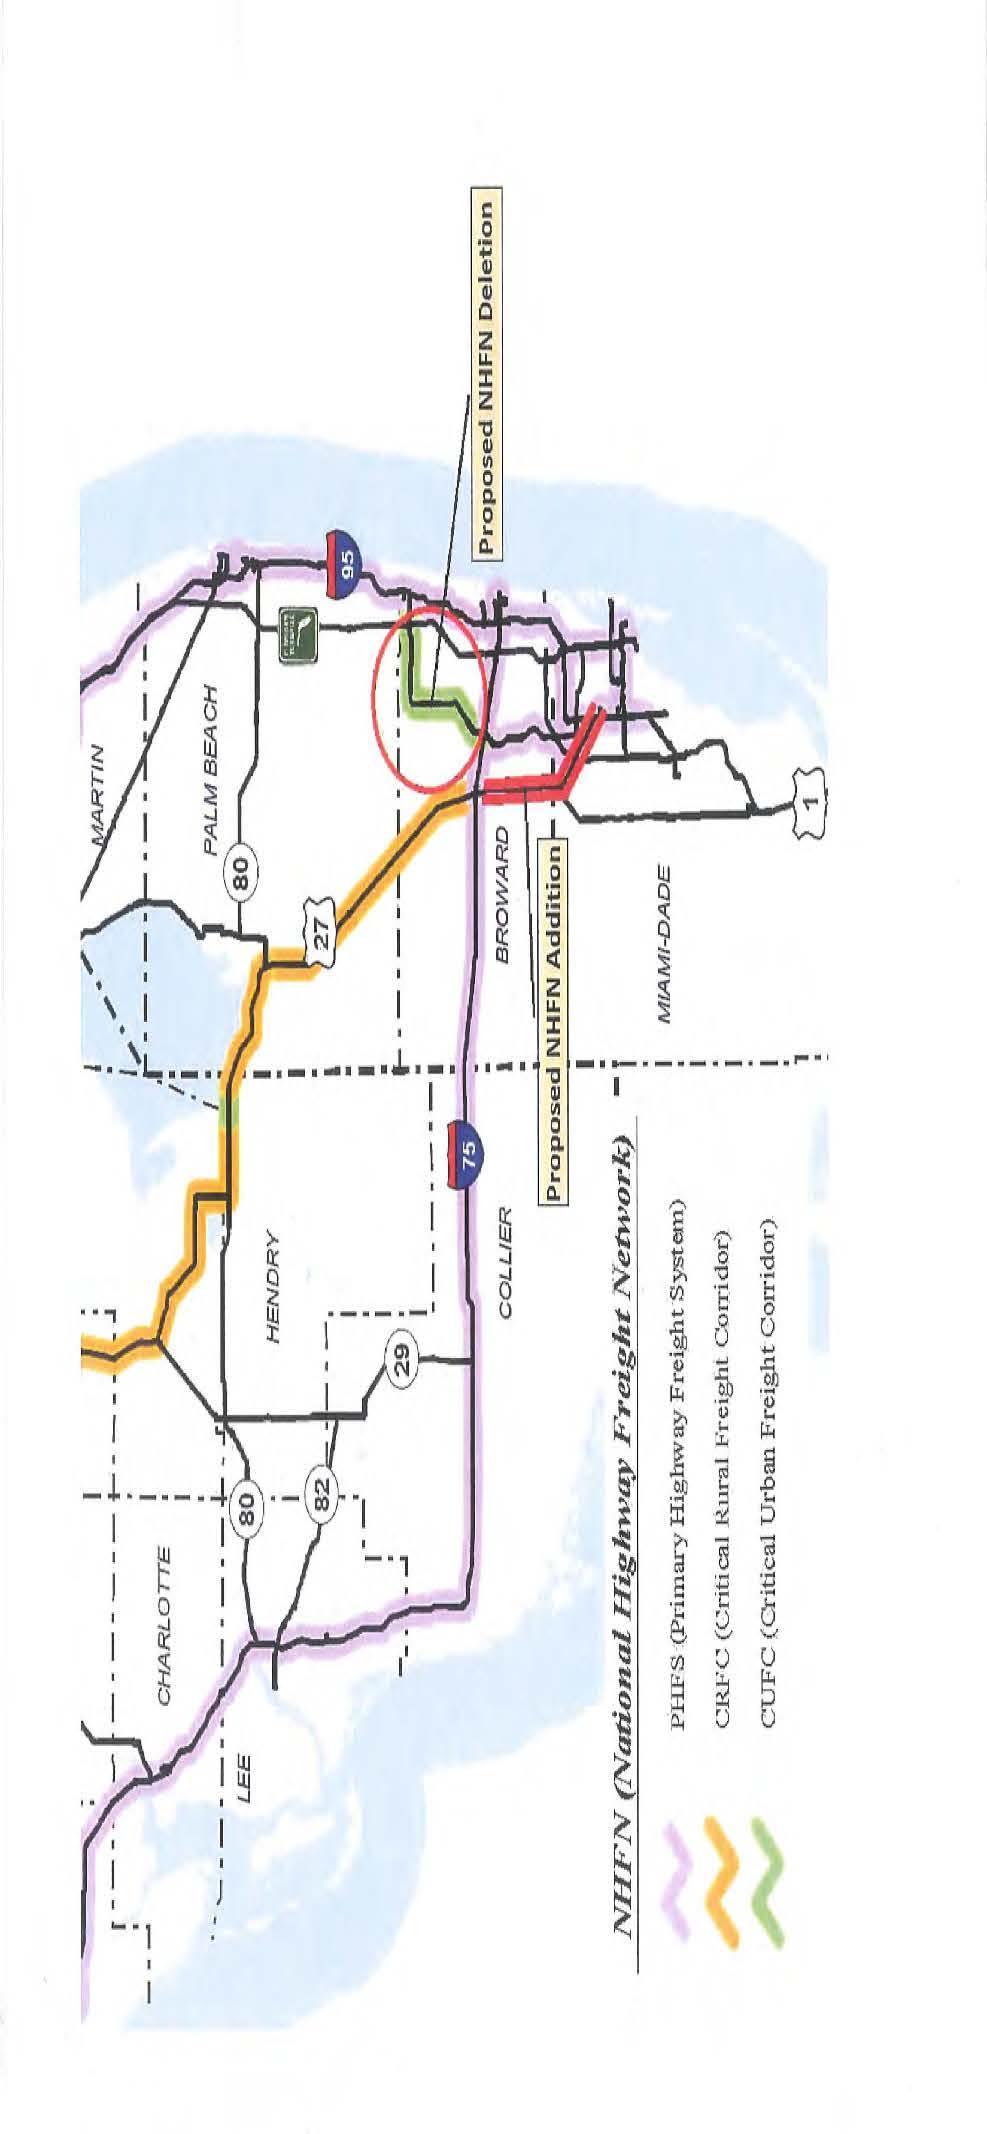
116 107
117 Appendix B Inland Terminal Concepts (From Doral Subarea Freight Plan) 108
118 109
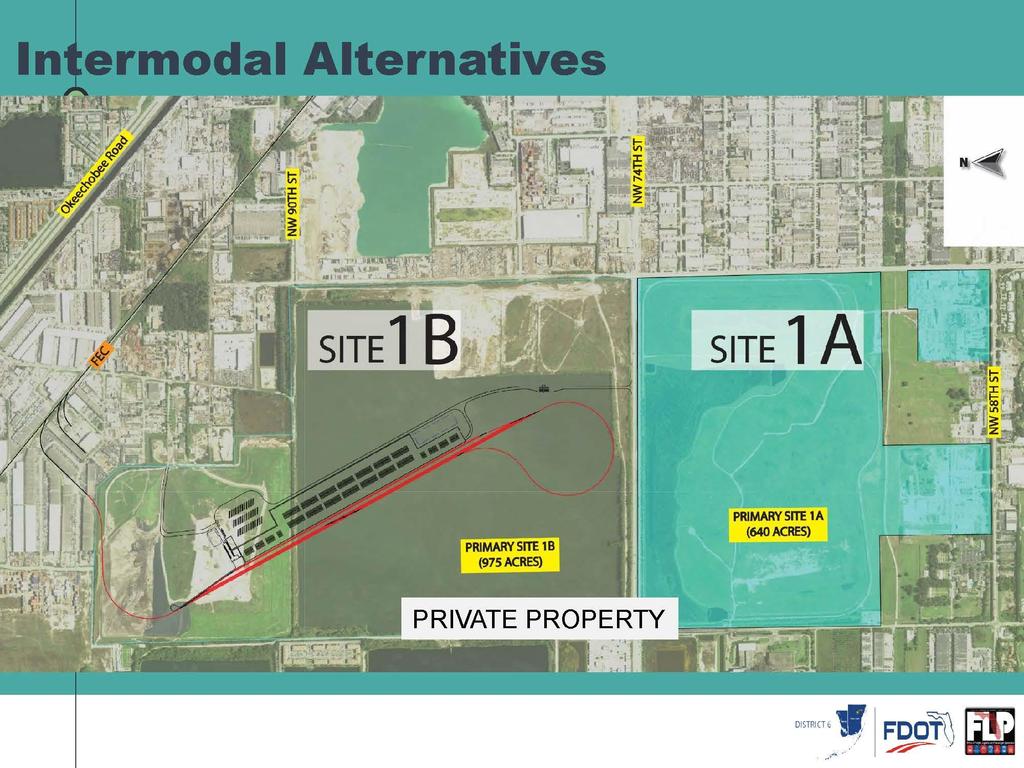
119 110
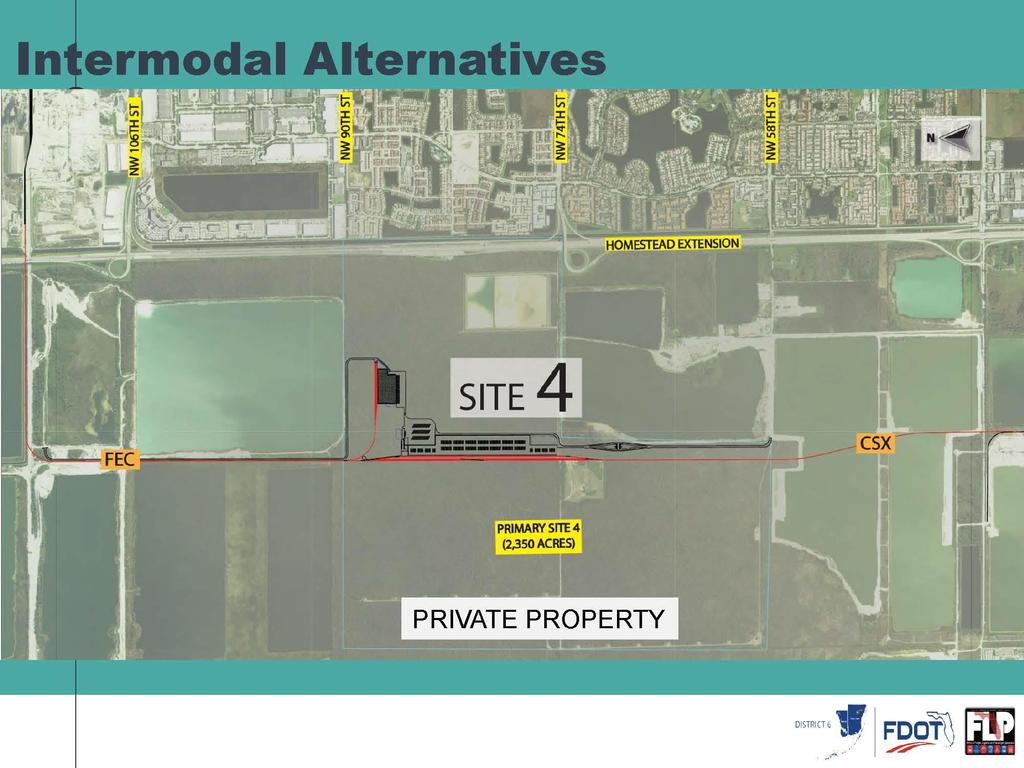
120 111
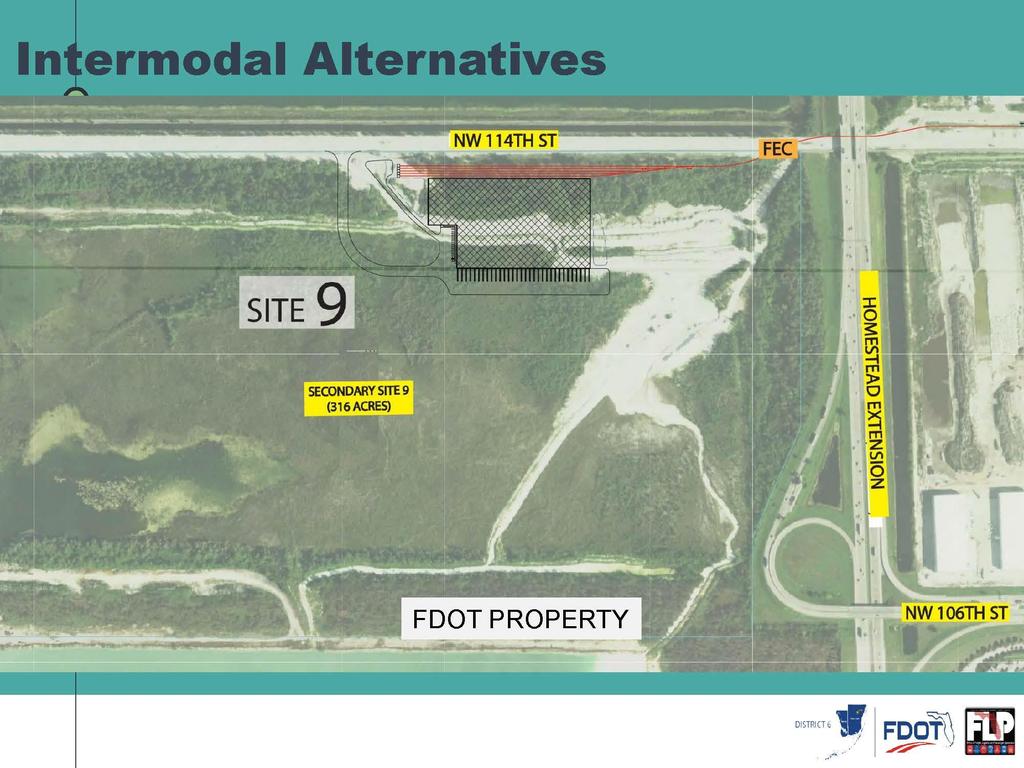
121 112
122 Appendix C Request for SIS Designation for Miami-Opa Locka Executive Airport 113
123 114
124 115
125 116
126 117
127 118
128 119
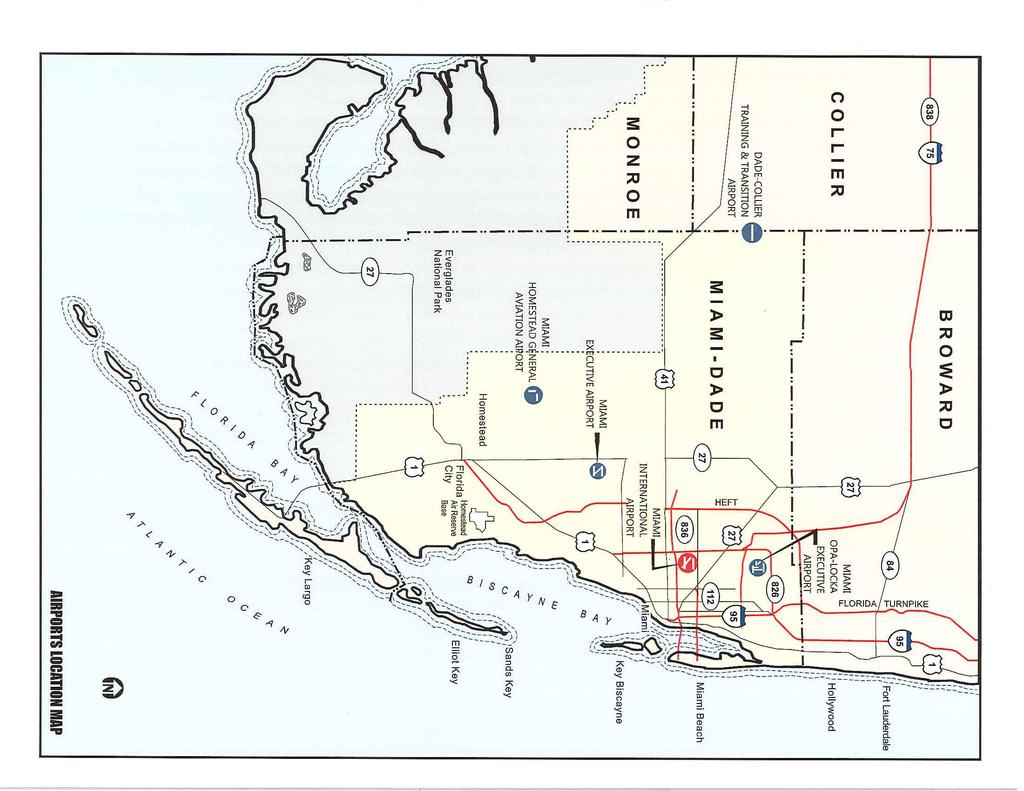
129 120
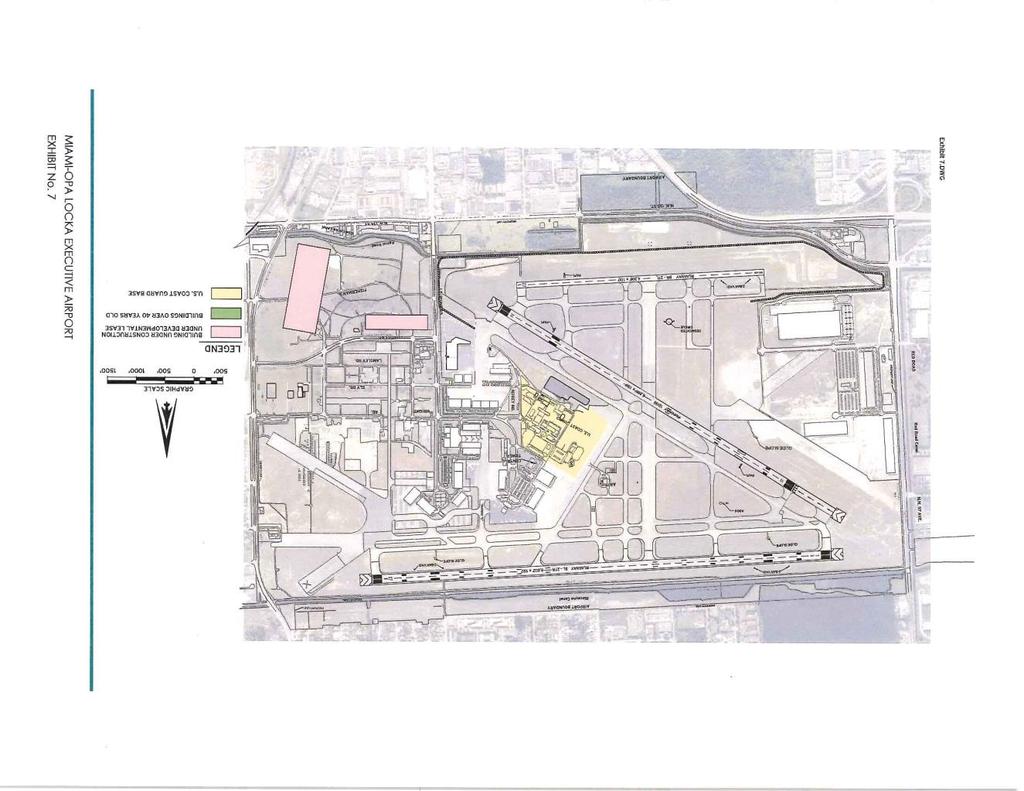
130 121
131 Appendix D Miami-Dade County Speed Scans NPMRDS 122
132 123
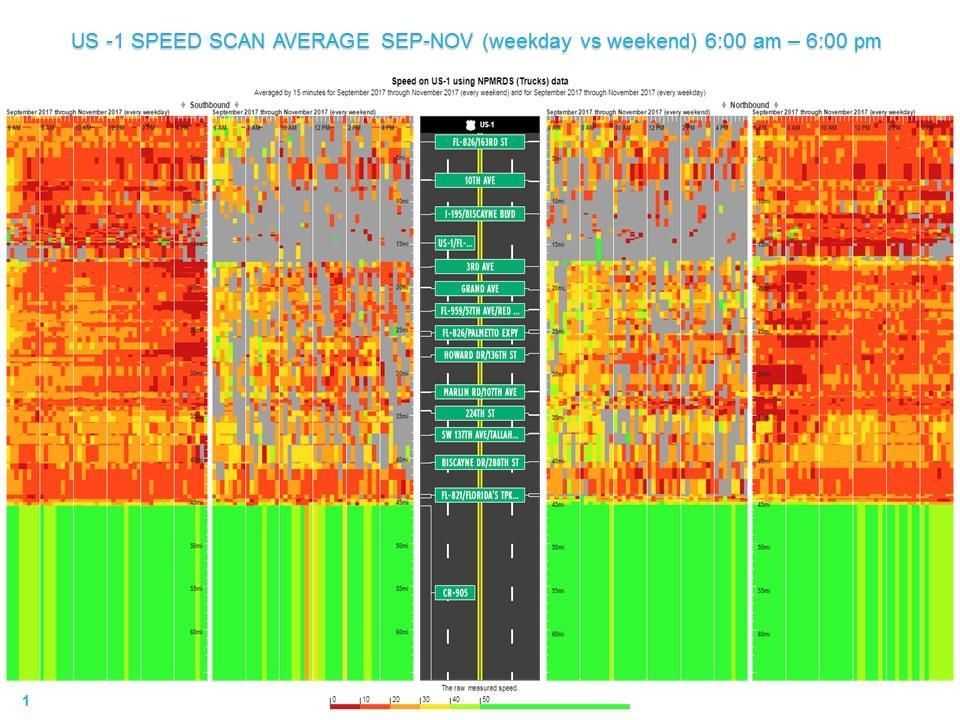
133 124
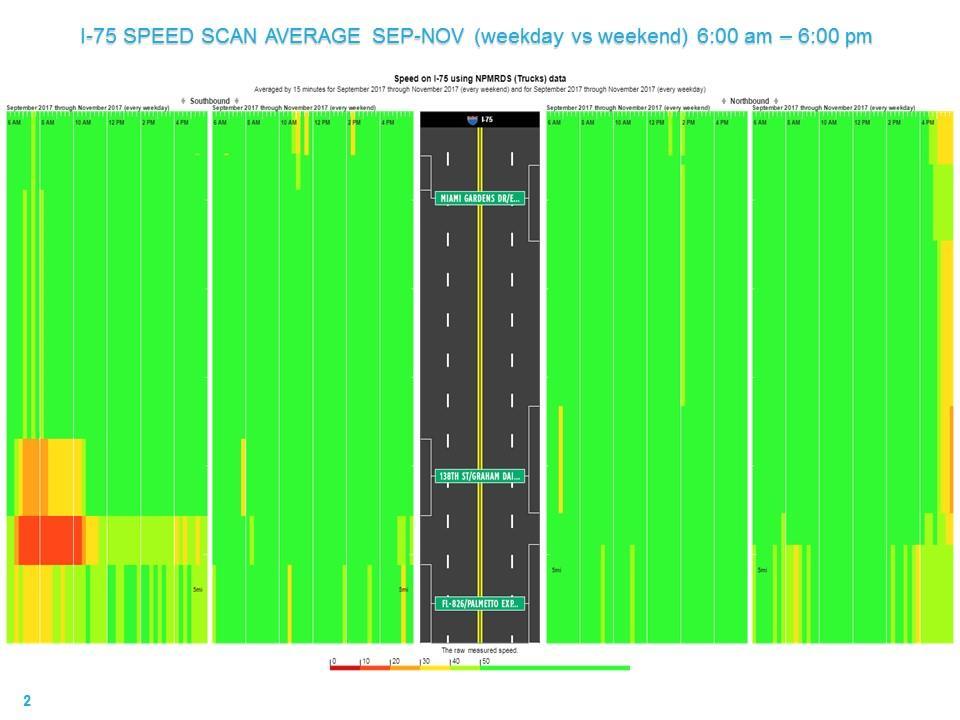
134 125
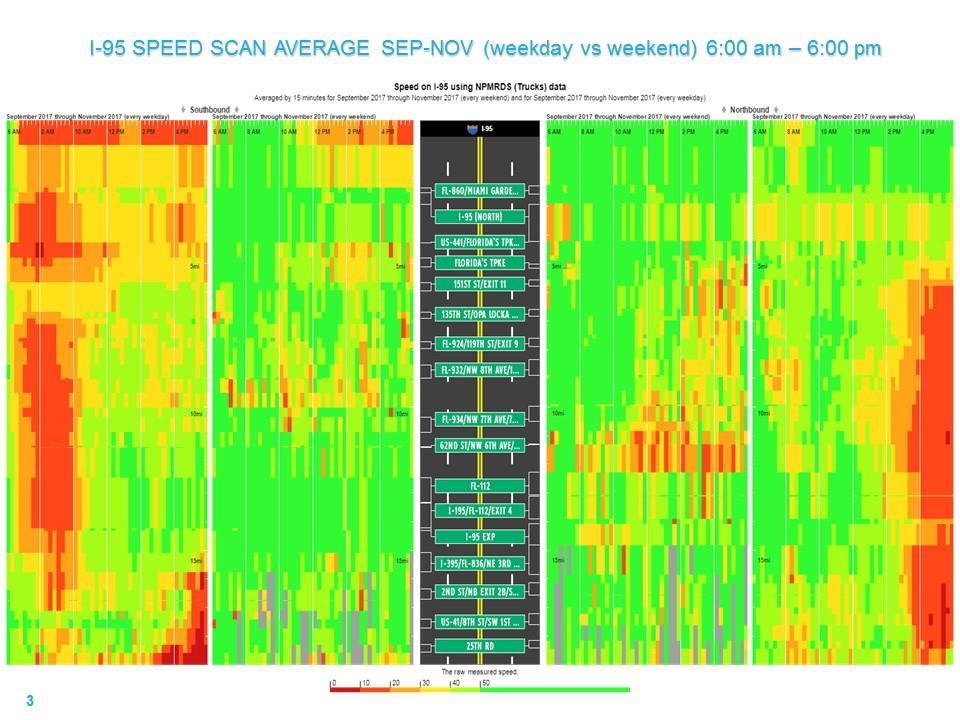
135 126
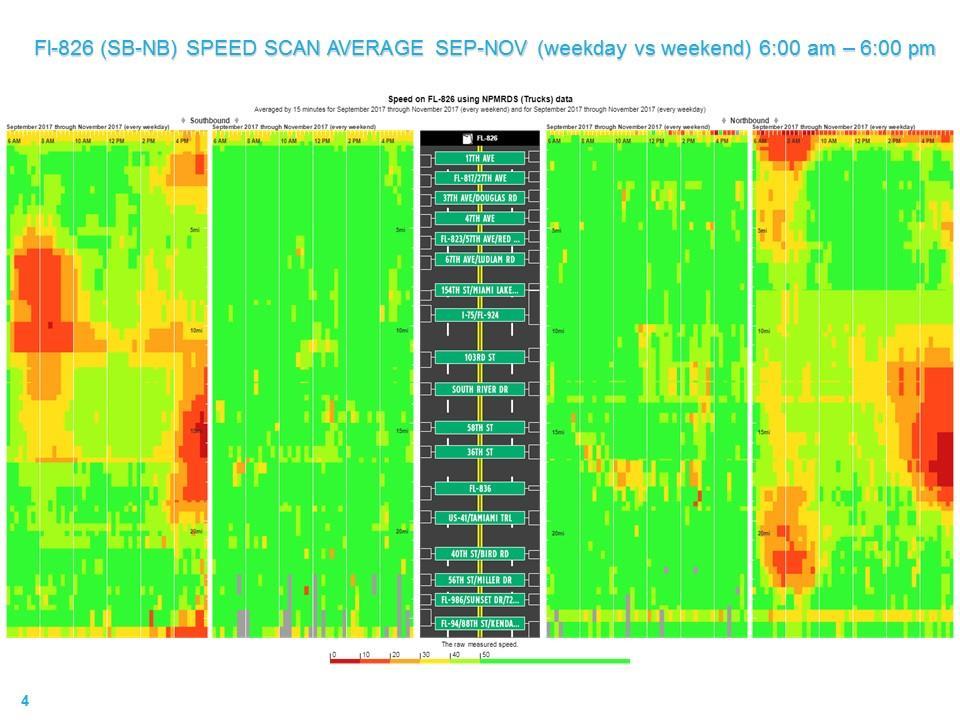
136 127
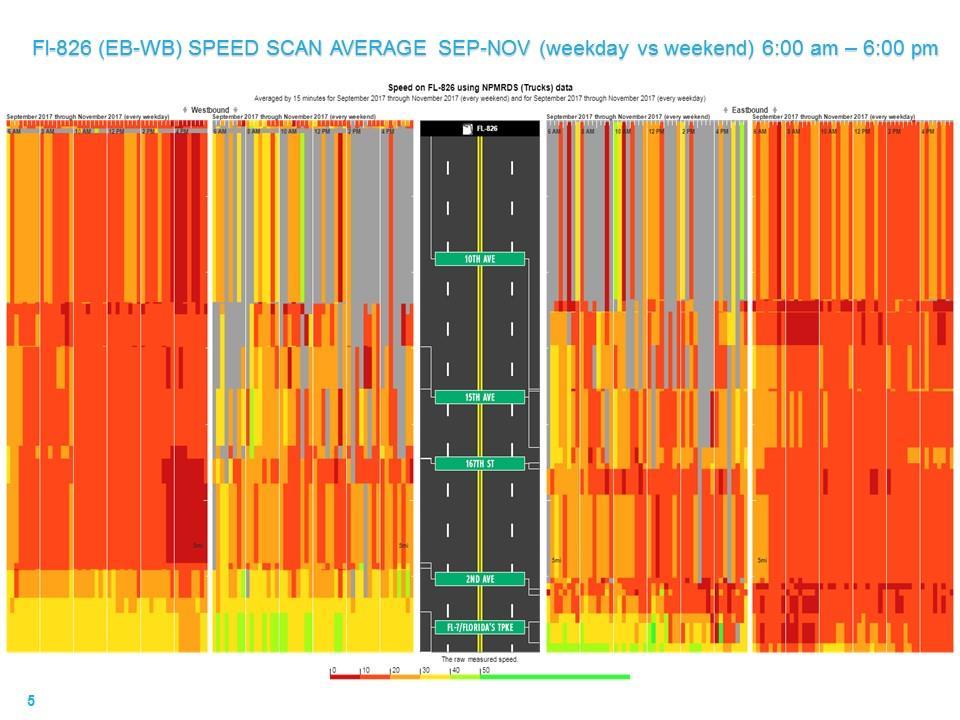
137 128
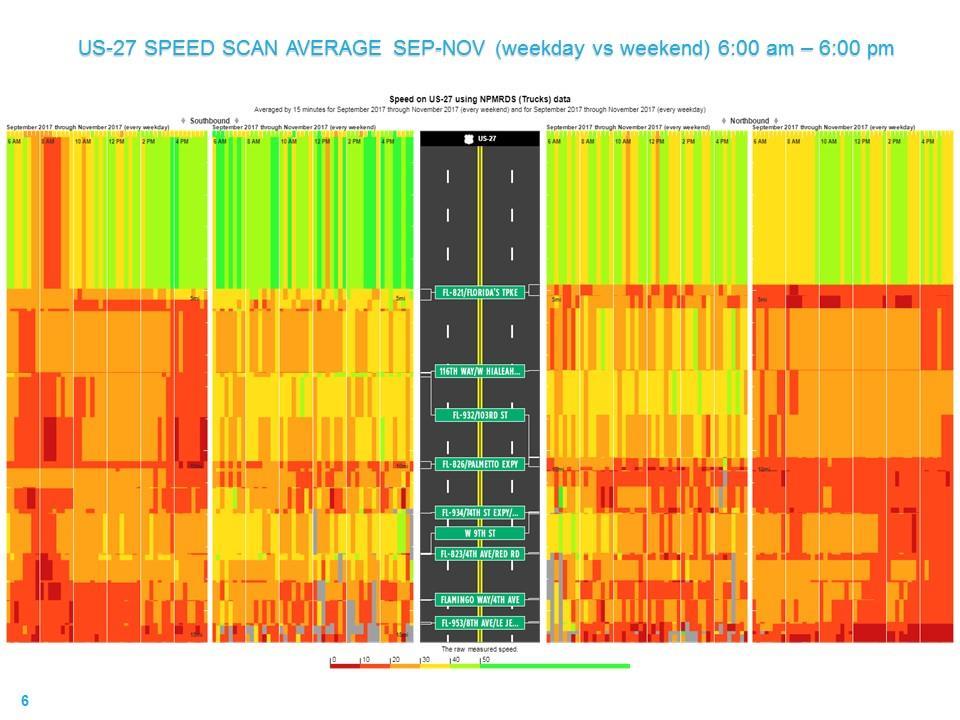
138 129
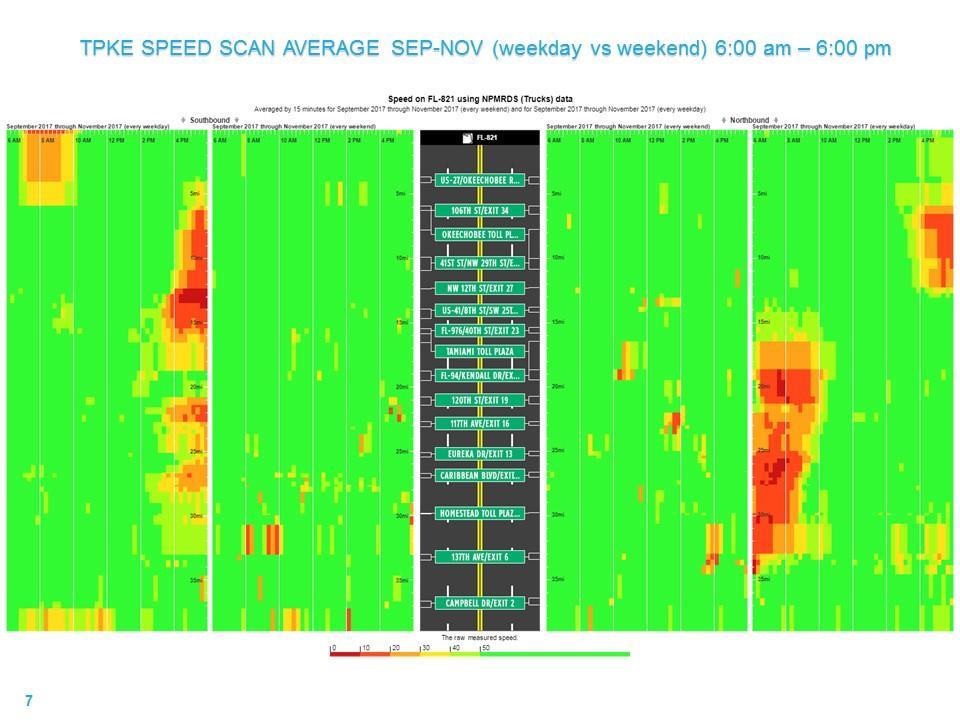
139 130
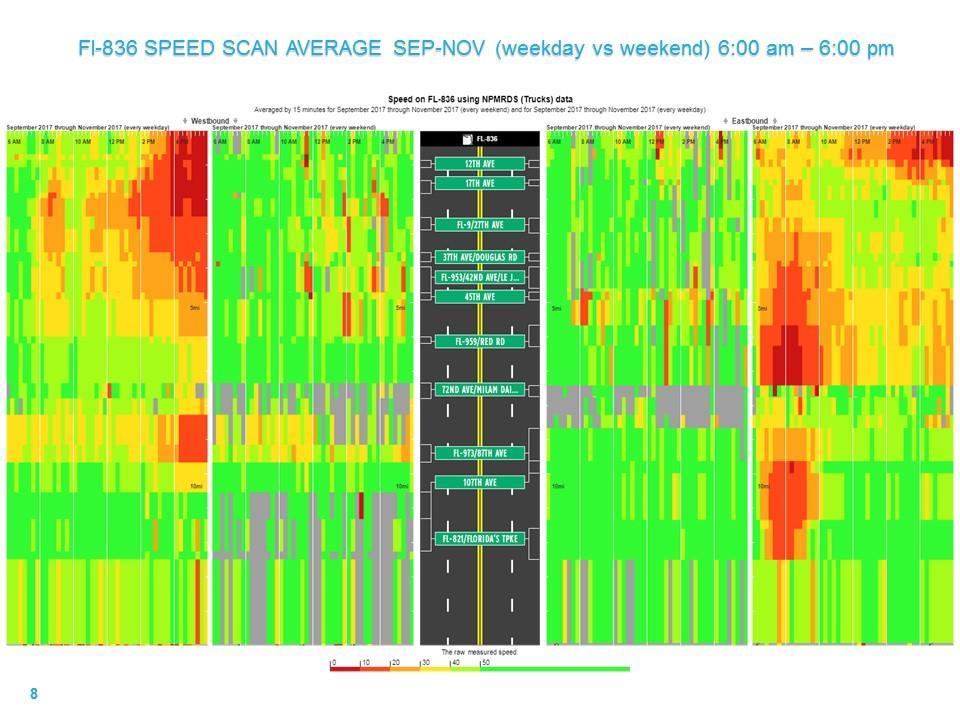
140 131
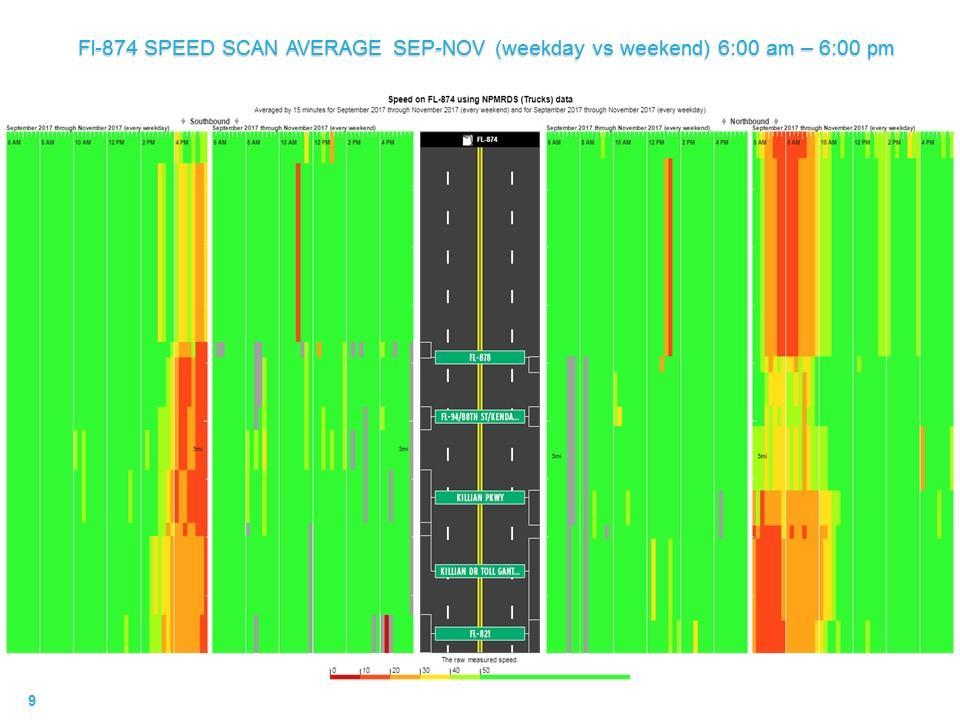
141 132
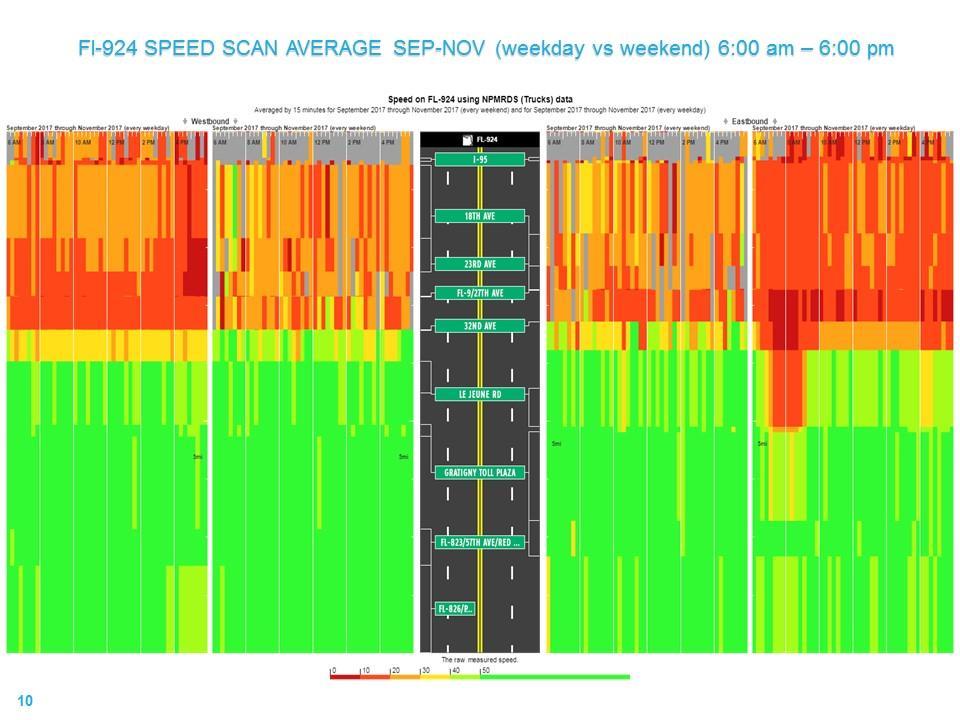
142 133