WEVE PRIMARY RESEARCH BASE 2017 N = 2,065 UK ADULTS
|
|
|
- Kristopher Bennett
- 5 years ago
- Views:
Transcription

1 WEVE PRIMARY RESEARCH BASE 2017 N = 2,065 UK ADULTS


2 WE ARE THE HUMAN INTELLIGENCE NETWORK. Weve s base of 23 million UK adults provides access to a nationally representative primary research base for robust market & sector insight. The billions of network events we see each day as part of a telco build up a picture of our customers. We use our primary research to understand the drivers and behaviours at every stage of our customers journeys for better planning and execution of campaigns. Live August 2016: SMS invite, linking through to online survey Sent to 70, year old smartphone owners Response sample = 2,065 UK Adults Data can be cut by any age, social grade, gender, etc.

3 1. Understanding the supermarket shopper Within the context of a supermarket environment, understand consumer shopping habits, providing insight on a nationally representative scale and at a more granular level within outlined shopper profiles. 2. Understand how different media influences behaviour Within the context of a supermarket environment, understand how media (in particular mobile) can influence shopper behaviour.
4 SUPERMARKET SHOPPER PROFILES
5 HEALTH DEAL SWITCHERS MUM MILLENNIALS CONSCIOUS SEEKERS Base: 2065
6 ABC1 ½ make calls or text in store Spending 319 per month MUMS Most likely to shop on weekday or weekend mornings at ASDA Base: 2065
7 Live in London Spending 193 per month Spend more on impulse purchases MILLENIALS Most likely to shop on weekday evenings at a small, local express Tesco Base: 2065

8 Female Living in London Spending 264 per month HEALTH CONSCIOUS Likely to shop at a large, out of town Waitrose Base: 2065
9 Female & aged /3 compare prices on their mobile before visiting a store Waiting for payday to do a shop DEAL SEEKERS Likely to shop on a weekend morning at Aldi or Lidl Base: 2065
10 Female aged Spending 270 per month Quality is most important to them SWITCHERS Likely to value quality and use Aldi for their main shop Base: 2065
11 WHERE DO CONSUMERS SHOP?


12 DIFFERENT SUPERMARKETS ARE USED FOR MAIN AND TOP UP SHOPS What supermarket do you use for your main shop? 50% Main Shop Regular Use 38% 25% 13% 0% Base: 2065


13 4/5 SHOPPERS TOP UP SHOP AT A DIFFERENT SUPERMARKET TO THEIR MAIN SHOP Does the supermarket you top up differ from where you mainly shop? ALMOST ALWAYS MOSTLY SOMETIMES RARELY NEVER 16% 20% 44% 14% 5% more likely to be Aldi shoppers more likely to be Tesco shoppers Base: 2065
14 AND THEY RE LOOKING FOR PRICE, QUALITY + CONVENIENCE 50% 53% 57% are willing to travel to other supermarkets to save money shop at different brands to get products of different quality will shop at whichever brand is more convenient at the time Base: 2065
15 AND THAT CONVENIENCE IS DRIVING PEOPLE ONLINE THE AVERAGE GROCERY SPEND PER MONTH IS % of grocery spend comes from online shopping 79% of online shopping comes from mobile (23% overall) 57% of mobile shopping comes from mobile web Base: 2065
16 WHAT ARE CONSUMERS BUYING?
17 SOME AISLES NEED A BIG PUSH TO GET SHOPPERS TO VISIT THEM Per how many shops are the following aisles visited? 4.6 CONFECTIONARY 2.1 MILK & DAIRY 3.4 DRY PACKAGED 5 ALCOHOL GOODS 3.7 CLEANING PRODUCTS 2.6 BREAD & BAKED GOODS 4.9 BAKING SUPPLIES 3.1 DRINKS 3.5 PET SUPPLIES EVERY SHOP Base: FRUIT & VEG 2.9 COLD MEAT & SEAFOOD 3.4 FROZEN GOODS 3.6 CANNED GOODS 3. 9 CEREAL 4.2 SPICES, CONDIMEN 5 BABY ITEMS TS & SAUCES 4.5 HEALTH & BEAUTY
18 SHOPPERS ARE BUYING A MIX OF OWN LABEL & BRANDED 4% 25% 50% 20% 1% All branded Majority branded, with some own label Even mix of own label and branded Majority own label, with some brands All own labelled 21% Switching from branded to own labeled Base: 2065
19 AND WHY DO THEY SWITCH? 36% ONLY BUY BRANDED PRODUCTS ON PROMOTION 35% BUY BRANDED PRODUCTS BECAUSE THEY RE BETTER QUALITY 35% TRUST BRANDED PRODUCTS MORE 65% OWN LABEL ARE JUST AS GOOD BASE: 2065

20 WHAT ARE SHOPPERS WHAT ARE SHOPPERS FAVOURITE BRANDS? FAVOURITE BRANDS?
21 WHAT TIMES DO DIFFERENT PROFILES SHOP?

22 2 IN 5 AGREE THEY RE SHOPPING MORE FREQUENTLY 10% 42% 23% 25% Do one big shop Larger shops and Buy essentials and Shop frequently and rarely top up top up when I need top up frequently and buy as I need Likely to shop at Morrisons and Lidl Average spend 273 More likely to shop at Tesco, Asda and Sainsbury s Average spend 281 More likely to shop at Aldi, M&S Food and Sainsbury s Average spend 249 More likely to shop at Waitrose, M&S Food and Coop Average spend 241 Base: 2065
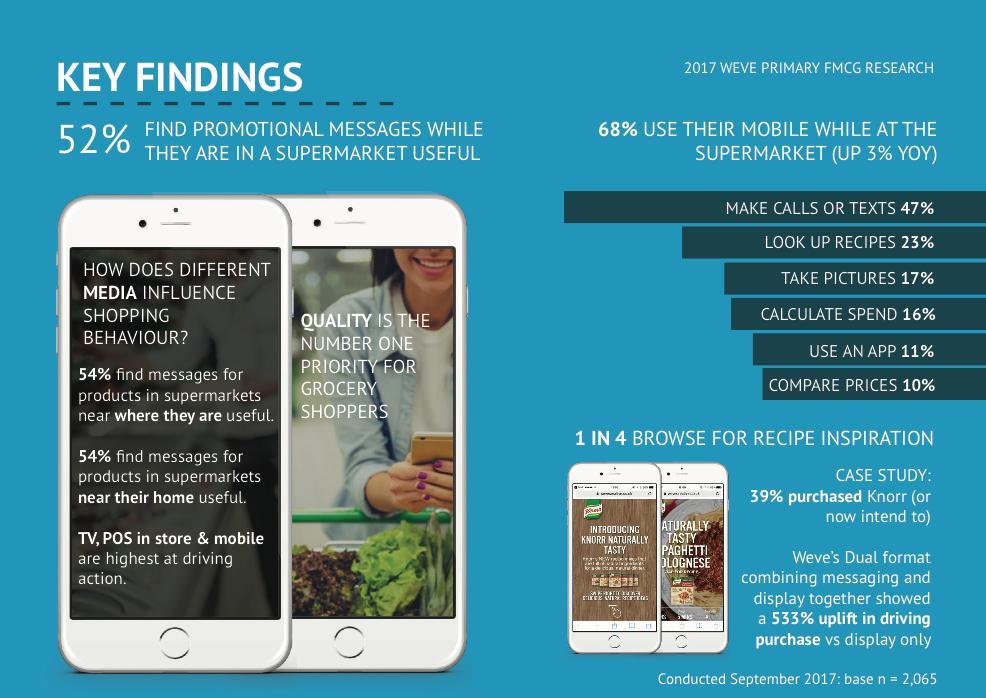
23 DIFFERENT PROFILES SHOP AT DIFFERENT TIMES Mums Weekday/weekend morning Millennials 59% find it useful to receive messages about products while shopping Weekday evening 50% find it useful to receive messages about products while shopping Base: 2065


24 AND OUR RESEARCH SHAPES OUR AWARD WINNING CAMPAIGNS BELVITA DRIVE NEW PRODUCT SALES Objective Drive people to Tesco stores to buy new belvita Soft Bakes. Strategy Weve targeted year old females living in proximity to Tesco stores, using previous FMCG research to understand when they would be doing their weekly shop. A full motion MMS+ format was sent to announce the new product. Sales data was analysed for belvita to identify the sales uplift driven by the Weve campaign and to measure campaign performance beyond the click. 22% UPLIFT IN SALES IN TEST VS CONTROL STORES


25 Context is key to engaging with the right audience at the right time - but timing is just one layer of context OTHER MEDIA REAL TIME PHYSICAL TIME CONDITIONS/TEMP
26 WHY DO PEOPLE SHOP THE WAY THEY DO?


27 70% QUALITY 63% PRICE WHEN 56% VALUE PURCHASING 37% NUTRITION GROCERY 18% QUANTITY ITEMS, SUSTAINABILITY 12% BRAND 11% QUALITY & PRICE ARE CONSIDERED ON PACK PROMOTIONS 8% MOST But, we are seeing increased value placed on nutrition and sustainability ALLERGIES NEW PRODUCTS 5% 2% IMPORTANT Base: 2065 PACKAGING 2%
28 LOYALTY SCHEMES ARE A BIG PART OF THE SHOP 44% save up points to use for a big event like Christmas 51% are more likely to shop with a supermarket that is part of a loyalty scheme 48% agree loyalty cards/points are an important part of their shop 46% constantly redeem points throughout the year 50% use points regularly throughout the year 77% are part of a loyalty card / points scheme with a supermarket Base: 2065
29 1. Understanding the supermarket shopper Within the context of a supermarket environment, understand consumer shopping habits, providing insight on a nationally representative scale and at a more granular level within outlined shopper profiles. 2. Understand how different media influences behaviour Within the context of a supermarket environment, understand how media (in particular mobile) can influence shopper behaviour.

30 TV, POS IN STORE & MOBILE 62% ARE HIGHEST AT DRIVING ACTION 32% 31% 28% RECALL 21% 21% 19% ACTION FOOTFALL 10% 9% 10% 8% 8% 8% 10% 10% 8% 8% 4% 4% 4% 3% 3% 2% 2% 2% 2% 1% TV POS in store Mobile Print OOH Desktop VoD Radio Cinema


31 BUT MOBILE CAN BE USED TO AMPLIFY OTHER MEDIA MOBILE IS PRESENT AT EVERY M E D I A GETTING READY AT HOME TRAVEL TO WORK WORK LUNCH WORK TRAVEL HOME HOME MOMENT
32 +3% YOY 68% USE THEIR MOBILE PHONE WHILE IN A SUPERMARKET 32

33 2% SEARCH FOR OTHER SUPERMARKETS 4% SEARCH FOR OTHER BRANDS 5% SCAN ITEMS AND WHAT ARE THEY USING THEIR PHONES FOR? 10% COMPARE PRICES 11% USE AN APP 16% CALCULATE SPEND 17% TAKE PICTURES 23% LOOK UP RECIPES 47% MAKE CALLS OR TEXTS


34 34% purchased Knorr (or now intend to) as a direct result of the Weve campaign. 1 in 4 ARE BROWSING FOR RECIPE INSPIRATION

35 1 IN 2 SHOPPERS FIND PROMOTIONAL 52% find promotional messages while they are in a supermarket useful 54% find messages for products in supermarkets near where they are useful 54% find messages for products in supermarkets near their homes useful MESSAGES USEFUL Base: 2065


36 WHAT WEBSITES DO PEOPLE VISIT IN A SUPERMARKET? TOP APP AND WEB LOGS WITHIN ONE OF WEVE S SUPERMARKET PARTNERS
37
38 Timothea Horwell Marketing & Research Manager Danny Saba Marketing & Research Executive