Grand Challenges and Opportunities in Supply Chain Network Analysis and Design
|
|
|
- William Atkinson
- 5 years ago
- Views:
Transcription


1 Grand Challenges and Opportunities in Supply Chain Network Analysis and Design To cite this version:. nalysis and Design. Roberto Cominetti and Sylvain Sorin and Bruno Tuffin. NetGCOOP 2011 : International conference on NETwork Games, COntrol and OPtimization, Oct 2011, Paris, France. IEEE, <hal > HAL Id: hal Submitted on 2 Feb 2012 HAL is a multi-disciplinary open access archive for the deposit and dissemination of scientific research documents, whether they are published or not. The documents may come from teaching and research institutions in France or abroad, or from public or private research centers. L archive ouverte pluridisciplinaire HAL, est destinée au dépôt et à la diffusion de documents scientifiques de niveau recherche, publiés ou non, émanant des établissements d enseignement et de recherche français ou étrangers, des laboratoires publics ou privés.
2 Grand Challenges and Opportunities in Supply Chain Network Analysis to Design Isenberg School of Management University of Massachusetts Amherst, Massachusetts NetGCoop 2011 International Conference on Network Games, Control, and Optimization Paris, France October 12-14, 2011
3 Acknowledgments I would like to thank the organizers of NetGCoop for inviting me to speak at this conference. Special acknowledgments and thanks to my students and collaborators who have made research and teaching always stimulating and rewarding.
4 Outline Background and Motivation Why User Behavior Must be Captured in Network Design Methodologies for Formulation, Analysis, and Computations An Empirical Application to Electric Power Supply Chains Network Design Through Mergers and Acquisitions A Challenging Network Design Problem and Model for Critical Needs with Outsourcing Applications to Vaccine Production and Emergencies Extensions to Perishable Product Supply Chains without and with Competition Summary, Conclusions, and Suggestions for Future Research
5 Background and Motivation
6 Supply chains are the critical infrastructure and backbones for the production, distribution, and consumption of goods as well as services in our globalized Network Economy. Supply chains, in their most fundamental realization, consist of manufacturers and suppliers, distributors, retailers, and consumers at the demand markets. Today, supply chains may span thousands of miles across the globe, involve numerous suppliers, retailers, and consumers, and be underpinned by multimodal transportation and telecommunication networks.

7 A General Supply Chain
8 Examples of Supply Chains food and food products high tech products automotive energy (oil, electric power, etc.) clothing and toys humanitarian relief healthcare supply chains supply chains in nature.

9 Food Supply Chains

10 High Tech Products

11 Automotive Supply Chains

12 Energy Supply Chains

13 Clothing and Toys

14 Healthcare Supply Chains

15 Humanitarian Relief

16 Supply Chains in Nature
17 Supply chains may be characterized by decentralized decision-making associated with the different economic agents or by centralized decision-making. Supply chains are, in fact, Complex Network Systems. Hence, any formalism that seeks to model supply chains and to provide quantifiable insights and measures must be a system-wide one and network-based. Indeed, such crucial issues as the stability and resiliency of supply chains, as well as their adaptability and responsiveness to events in a global environment of increasing risk and uncertainty can only be rigorously examined from the view of supply chains as network systems.
18 Characteristics of Supply Chains and Networks Today large-scale nature and complexity of network topology; congestion, which leads to nonlinearities; alternative behavior of users of the networks, which may lead to paradoxical phenomena; possibly conflicting criteria associated with optimization; interactions among the underlying networks themselves, such as the Internet with electric power networks, financial networks, and transportation and logistical networks; recognition of their fragility and vulnerability; policies surrounding networks today may have major impacts not only economically, but also socially, politically, and security-wise.
19 Changes in the availability of supplies, price shocks, as well as disruptions to transportation modes or telecommunications may have negative effects and consequences that propagate throughout the supply chain. On the other hand, increases in demand for a product, entirely new demand markets, decreases in transaction costs, new suppliers, and even new modes of transaction, may provide new opportunities for profit maximization for manufacturers, distributors, as well as retailers, and new linkages that were not previously possible.

20 Our Approach to Supply Chain Network Analysis and Design
21 Why User Behavior Must be Captured in Network Design

22 Supply Chain Network Design Must Capture the Behavior of Users
23 Behavior on Congested Networks Decision-makers select their cost-minimizing routes. User-Optimized Decentralized Selfish U O vs. vs. vs. Centralized Unselfish S O System-Optimized Flows are routed so as to minimize the total cost to society.
24 Two fundamental principles of travel behavior, due to Wardrop (1952), with terms coined by Dafermos and Sparrow (1969). User-optimized (U-O) (network equilibrium) Problem each user determines his/her cost minimizing route of travel between an origin/destination, until an equilibrium is reached, in which no user can decrease his/her cost of travel by unilateral action (in the sense of Nash). System-optimized (S-O) Problem users are allocated among the routes so as to minimize the total cost in the system, where the total cost is equal to the sum over all the links of the link s user cost times its flow. The U-O problems, under certain simplifying assumptions, possesses optimization reformulations. But now we can handle cost asymmetries, multiple modes of transport, and different classes of travelers, without such assumptions.
25 We Can State These Conditions Mathematically!
26 The U-O and S-O Conditions Definition: U-O or Network Equilibrium Fixed Demands A path flow pattern x, with nonnegative path flows and O/D pair demand satisfaction, is said to be U-O or in equilibrium, if the following condition holds for each O/D pair w W and each path p P w : { C p (x = λw, if xp > 0, ) λ w, if xp = 0. Definition: S-O Conditions A path flow pattern x with nonnegative path flows and O/D pair demand satisfaction, is said to be S-O, if for each O/D pair w W and each path p P w : { = Ĉ p(x) µw, if x p > 0, µ w, if x p = 0, where Ĉ p(x)= a L ĉ a(f a) f a δ ap, and µ w is a Lagrange multiplier.
27 The importance of behavior will now be illustrated through a famous example known as the Braess paradox which demonstrates what can happen under U-O as opposed to S-O behavior. Although the paradox was presented in the context of transportation networks, it is relevant to other network systems in which decision-makers act in a noncooperative (competitive) manner.
28 The Braess (1968) Paradox Assume a network with a single O/D pair (1,4). There are 2 paths available to travelers: p 1 = (a,c) and p 2 = (b,d). For a travel demand of 6, the equilibrium path flows are x p 1 = x p 2 = 3 and The equilibrium path travel cost is C p1 = C p2 = a b 2 3 c d 4 c a (f a ) = 10f a, c b (f b ) = f b + 50, c c (f c ) = f c +50, c d (f d ) = 10f d.
29 Adding a Link Increases Travel Cost for All! Adding a new link creates a new path p 3 = (a,e,d). The original flow distribution pattern is no longer an equilibrium pattern, since at this level of flow the cost on path p 3,C p3 = 70. The new equilibrium flow pattern network is x p 1 = x p 2 = x p 3 = 2. The equilibrium path travel cost: C p1 = C p2 = C p3 = a b e 2 3 c d 4 c e (f e ) = f e + 10


 Transportation")
30 The 1968 Braess article has been translated from German to English and appears as: On a Paradox of Traffic Planning, D. Braess, A. Nagurney, and T. Wakolbinger (2005) Transportation Science 39,


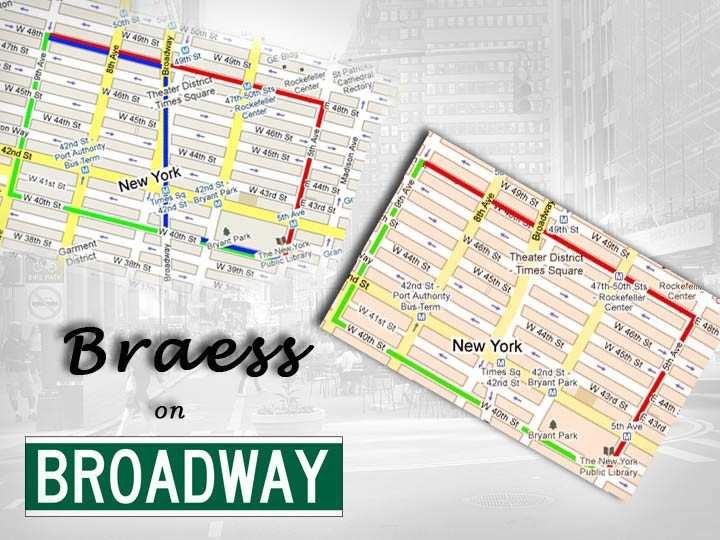
31 The Braess Paradox Around the World Stuttgart, Germany - The traffic worsened until a newly built road was closed Earth Day - New York City - 42 nd Street was closed and traffic flow improved Seoul, Korea - A 6 lane road built over the Cheonggyecheon River that carried 160,000 cars per day and was perpetually jammed was torn down to improve traffic flow.
32

33 Interview on Broadway for America Revealed on March 15, 2011
34 Under S-O behavior, the total cost in the network is minimized, and the new route p 3, under the same demand, would not be used. The Braess paradox never occurs in S-O networks.
35 Methodologies for Formulation, Analysis, and Computations
36 The Variational Inequality Problem We utilize the theory of variational inequalities for the formulation, analysis, and solution of both centralized and decentralized supply chain network problems. Definition: The Variational Inequality Problem The finite-dimensional variational inequality problem, VI(F, K), is to determine a vector X K, such that: F(X ) T,X X 0, X K, where F is a given continuous function from K to R N, K is a given closed convex set, and, denotes the inner product in R N.
37 The variational inequality problem contains, as special cases, such mathematical programming problems as: systems of equations, optimization problems, complementarity problems, and is related to the fixed point problem. Hence, it is a natural methodology for a spectrum of supply chain network problems from centralized to decentralized ones as well as to design problems.
38 Geometric Interpretation of VI(F, K) and a Projected Dynamical System (Dupuis and Nagurney (1993), Nagurney and Zhang (1996)) In particular, F(X ) is orthogonal to the feasible set K at the point X. Normal Cone X 0 X X X F(X ) X F(X ) Feasible Set K Associated with a VI is a Projected Dynamical System, which provides a natural underlying dynamics associated with travel (and other) behavior to the equilibrium.
39 To model the dynamic behavior of complex networks, including supply chains, we utilize projected dynamical systems (PDSs) advanced by Dupuis and Nagurney (1993) in Annals of Operations Research and by Nagurney and Zhang (1996) in their book Projected Dynamical Systems and Variational Inequalities with Applications. Such nonclassical dynamical systems are now being used in evolutionary games (Sandholm (2005, 2011)), ecological predator-prey networks (Nagurney and Nagurney (2011a, b)), and even neuroscience (Girard et al. (2008)).
40 1 a b e 2 3 c d 4 Recall the Braess network with the added link e. What happens as the demand increases?
41 For Networks with Time-Dependent Demands We Use Evolutionary Variational Inequalities
).")
42 The U-O Solution of the Braess Network with Added Link (Path) and Time-Varying Demands Solved as an Evolutionary Variational Inequality (Nagurney, Daniele, and Parkes (2007)).
43 In Demand Regime I, Only the New Path is Used. In Demand Regime II, the travel demand lies in the range [2.58, 8.89], and the Addition of a New Link (Path) Makes Everyone Worse Off! In Demand Regime III, when the travel demand exceeds 8.89, Only the Original Paths are Used!
44 The new path is never used, under U-O behavior, when the demand exceeds 8.89, even out to infinity!


45 Other Networks that Behave like Traffic Networks The Internet and electric power networks
46 Electric Power Supply Chains The U.S. electric power industry: Half a trillion dollars of net assets, $220 billion annual sales, 40% of domestic primary energy (Energy Information Administration (2000, 2005)). Deregulation: Wholesale market Bilateral contracts Power pool. Electric power supply chain networks: Generation technologies Insensitive demands Transmission congestion. In 2007, the total transmission congestion cost in New England was about $130 million (ISO New England Annual Market Report, 2007).
47 Electric Power Supply Chains We have developed an empirical, large-scale electric supply chain network equilibrium model, formulated it as a VI problem, and were able to solve it by exploiting the connection between electric power supply chain networks and transportation networks using our proof of a hypothesis posed in the classic book, Studies in the Economics of Transportation, by Beckmann, McGuire, and Winsten (1956). The paper, An Integrated Electric Power Supply Chain and Fuel Market Network Framework: Theoretical Modeling with Empirical Analysis for New England, by Z. Liu and A. Nagurney was published in Naval Research Logistics (2009), 56,
48 Features of the Model The model captures both economic transactions and physical transmission constraints. The model considers the behaviors of all major decision-makers including gencos, consumers and the independent system operator (ISO). The model considers multiple fuel markets, electricity wholesale markets, and operating reserve markets.
49 An Empirical Example of an Electric Power Supply Chain for New England There are 82 generating companies who own and operate 573 generating units. We considered 5 types of fuels: natural gas, residual fuel oil, distillate fuel oil, jet fuel, and coal. The whole area was divided into 10 regions: 1. Maine, 2. New Hampshire, 3. Vermont, 4. Connecticut (excluding Southwest Connecticut), 5. Southwestern Connecticut (excluding the Norwalk-Stamford area), 6. Norwalk-Stamford area, 7. Rhode Island, 8. Southeastern Massachusetts, 9. Western and Central Massachusetts, 10. Boston/Northeast Massachusetts.
50 Graphic of New England
51 The Electric Power Supply Chain Network with Fuel Supply Markets Fuel Markets for Fuel Type 1 1, 1 1, M Generating Units of Gencos 1, 1, 1 G, 1, N G1 in Regions genco, region, unit) Power Pool 1, 1 1, K Demand Market Sectors Region 1 Fuel Markets for Fuel Type a a, 1 a, M 1, r, 1 G, r, N Gr r, 1 r, K Demand Market Sectors Region r Fuel Markets for Fuel Type A A, 1 A, M 1, R, 1 G, R, N GR R, 1 R, K Demand Market Sectors Region R
52 We tested the model on the data of July 2006 which included = 744 hourly demand/price scenarios. We sorted the scenarios based on the total hourly demand, and constructed the load duration curve. We divided the duration curve into 6 blocks (L 1 = 94 hours, and L w = 130 hours; w = 2,...,6) and calculated the average regional demands and the average weighted regional prices for each block. The empirical model had on the order of 20,000 variables.
53 Actual Prices Vs. Simulated Prices ($/Mwh)
54 Sensitivity Analysis We used the same demand data, and then varied the prices of natural gas and residual fuel oil. We assumed that the percentage change of distillate fuel oil and jet fuel prices were the same as that of the residual fuel oil price. The next figure presents the average electricity price for the two peak blocks under oil/gas price variations. The surface in the figure represents the average peak electricity prices under different natural gas and oil price combinations.
55 Sensitivity Analysis
56 If the price of one type of fuel is fixed, the electricity price changes less percentage-wise than the other fuel price does. This is mainly because fuel diversity can mitigate fuel price shocks. Additional simulation results can be found in our Naval Research Logistics paper, including: How natural gas prices can be significantly influenced by oil prices through electric power networks and markets. How changes in the demand for electricity influence the electric power and fuel markets. The model and results are useful in determining and quantifying the interactions between electric power flows and prices and the various fuel supply markets. Such information is important to policy-makers who need to ensure system reliability as well as for the energy asset owners and investors who need to manage risk and to evaluate their assets.
57 Supply chain network design (and redesign) can be accomplished through link and node additions (as well as their removals). It can be accomplished by modifying the link capacities (expanding certain ones and, if applicable, reducing or selling off others). It can also be accomplished through the integration of networks as in mergers and acquisitions. It can be accomplished through the design of the network from scratch as we shall demonstrate.
58 Supply Chain Network Design Through Mergers and Acquisitions
59 Current Merger & Acquisition Activity M&As totaled over $2 trillion in 2009, down 32% from full-year 2008 and down 53% from the record high in 2007, according to data from Thomson Reuters. Mergers announced in October 2010 include Bain Capital / Gymboree, at $1.789 billion and Dynamex / Greenbriar Equity Group ($207 million). Some of the most visible recent mergers have occurred in the airline industry with Delta and Northwest completing their merger in October 2008 and United and Continental closing on the formation of United Continental Holdings Oct. 1, 2010.
60 Global 2010 M&A activity is estimated to rise as much as 35% from 2009 figures (Sanford C. Bernstein research firm). Successful mergers can add tremendous value; however, the failure rate is estimated to be between 74% and 83% (Devero (2004)). It is worthwhile to develop tools to better predict the associated strategic gains, which include, among others, cost savings (Eccles, Lanes, and Wilson (1999)).
61 Mergers and Acquisitions and Network Synergies A successful merger depends on the ability to measure the anticipated synergy of the proposed merger (cf. Chang (1988)). A. Nagurney (2009) A System-Optimization Perspective for Supply Chain Network Integration: The Horizontal Merger Case, Transportation Research E 45, 1-15.
62 M A 1 D A 1,1 Firm A Firm B A B M A n M B M 1 M B n M B D A nd A,1 D1,1 B D B nd B,1 D A 1,2 D A nd A,2 D B 1,2 D B nd B,2 R1 A R A nr A R1 B R B nr B Figure 1: Case 0: Firms A and B Prior to Horizontal Merger
63 M A 1 D A 1,1 0 Firm A Firm B A B M A n A M B M 1 M B nm B D A nd A,1 D1,1 B D B nd B,1 D A 1,2 R A 1 D A n D A,2 D B 1,2 D B n D B,2 R A nr A R1 B R B nr B Figure 2: Case 1: Firms A and B Merge
64 M A 1 D A 1,1 0 Firm A Firm B A B M A n A M B M 1 M B n M B D A nd A,1 D1,1 B D B nd B,1 D A 1,2 R A 1 D A nd A,2 D B 1,2 D B nd B,2 R A nr A R1 B R B nr B Figure 3: Case 2: Firms A and B Merge
65 M A 1 D A 1,1 0 Firm A Firm B A B M A n A M B M 1 M B nm B D A nd A,1 D1,1 B D B nd B,1 D A 1,2 R A 1 D A nd A,2 D B 1,2 D B nd B,2 R A nr A R1 B R B nr B Figure 4: Case 3: Firms A and B Merge
66 Synergy Measure The measure that we utilized in Nagurney (2009) to capture the gains, if any, associated with a horizontal merger Case i; i = 1,2,3 is as follows: [ TC S i 0 TC i = TC 0 ] 100%, where TC i is the total cost associated with the value of the objective function a L i ĉ a(f a ) for i = 0,1,2,3 evaluated at the optimal solution for Case i. Note that S i ; i = 1,2,3 may also be interpreted as synergy.
67 This model can also be applied to the teaming of organizations in the case of humanitarian operations.

68 Bellagio Conference on Humanitarian Logistics See:
69 Some Examples of Oligopolies airlines freight carriers automobile manufacturers oil companies beer / beverage companies wireless communications fast fashion brands certain financial institutions.
70 The Supply Chain Network Oligopoly Model M1 1 D1,1 1 Firm 1 1 Firm I I M 1 n M I M 1 M I n M I D 1 nd 1,1 D1,1 I D I nd I,1 D 1 1,2 D 1 nd 1,2 D I 1,2 D I nd I,2 R 1 R nr Figure 5: Supply Chain Network Structure of the Oligopoly Nagurney Computational Management Science (2010) 7,
71 Mergers Through Coalition Formation Firm 1 Firm Firm 1 Firm n Firm n Firm I 1 n 1 I M 1 1 M 1 n 1 D1,1 1 Mn 1 M D 1 1 M n 1 n n 1 M M I n nd 1,1Dn 1 1,1 D n 1 M I n n 3 1 D,1 D I nd I,1 D1,2 1 D 1 n 1 D,2Dn 1 1,2 D n 1 nd 1,2 D I n D I,2 R 1 R nr Figure 6: Mergers of the First n 1 Firms and the Next n 2 Firms
72 In addition, supply chain network design can be accomplished through the evolution and integration of disparate network systems, including social networks. Two References: A. Nagurney, T. Wakolbinger, and L. Zhao (2006) The Evolution and Emergence of Integrated Social and Financial Networks with Electronic Transactions: A Dynamic Supernetwork Theory for the Modeling, Analysis, and Computation of Financial Flows and Relationship Levels, Computational Economics 27, J. M. Cruz, A. Nagurney, and T. Wakolbinger (2006) Financial Engineering of the Integration of Global Supply Chain Networks and Social Networks with Risk Management, Naval Research Logistics 53,
73 1 i m 1 j n Flows are Relationship Levels 1 i m The Supernetwork 1 k o 1 j Supply Chain Network n 1 k o Social Network Flows are Product Transactions Figure 7: The Multilevel Supernetwork Structure of the Integrated Supply Chain / Social Network System
74 1 i m 1 j n n+1 Flows are Relationship Levels 1 i m The Supernetwork 1 k o Financial Network 1 j with Intermediation n 1 k o Social Network Flows are Financial Transactions Figure 8: The Multilevel Supernetwork Structure of the Integrated Financial Network / Social Network System
75 A Challenging Network Design Problem and Model for Critical Needs with Outsourcing
76 The number of disasters is increasing globally, as is the number of people affected by disasters. At the same time, with the advent of increasing globalization, viruses are spreading more quickly and creating new challenges for medical and health professionals, researchers, and government officials. Between 2000 and 2004, the average annual number of disasters was 55% higher than in the period 1994 through 1999, with 33% more humans affected in the former period than in the latter (cf. Balcik and Beamon (2008) and Nagurney and Qiang (2009)).

77 Natural Disasters ( )
78 However, although the average number of disasters has been increasing annually over the past decade the average percentage of needs met by different sectors in the period 2000 through 2005 identifies significant shortfalls. According to Development Initiatives (2006), based on data in the Financial Tracking System of the Office for the Coordination of Humanitarian Affairs, from , the average needs met by different sectors in the case of disasters were: 79% by the food sector; 37% of the health needs; 35% of the water and sanitation needs; 28% of the shelter and non-food items, and 24% of the economic recovery and infrastructure needs.
).")
79 Hurricane Katrina in 2005 Hurricane Katrina has been called an American tragedy, in which essential services failed completely (Guidotti (2006)).

80 Haiti Earthquake in 2010 Delivering the humanitarian relief supplies (water, food, medicines, etc.) to the victims was a major logistical challenge.

81 The Triple Disaster in Japan on March 11, 2011 Now the world is reeling Annafrom Nagurney the aftereffects Grand Challengesof andthe Opportunities tripleindisaster Supply Chain Network A
.")
82 H1N1 (Swine) Flu As of May 2, 2010, worldwide, more than 214 countries and overseas territories or communities have reported laboratory confirmed cases of pandemic influenza H1N1 2009, including over 18,001 deaths ( Parts of the globe experienced serious flu vaccine shortages, both seasonal and H1N1 (swine) ones, in late 2009.

83 Fragile Networks We are living in a world of Fragile Networks.
84 Background and Motivation Underlying the delivery of goods and services in times of crises, such as in the case of disasters, pandemics, and life-threatening major disruptions, are supply chains, without which essential products do not get delivered in a timely manner, with possible increased disease, injuries, and casualties. It is clear that better-designed supply chain networks would have facilitated and enhanced various emergency preparedness and relief efforts and would have resulted in less suffering and lives lost.
85 Supply chain networks provide the logistical backbones for the provision of products as well as services both in corporate as well as in emergency and humanitarian operations. Here we focus on supply chains in the case of Critical Needs Products.
86 Critical Needs Products Critical needs products are those that are essential to the survival of the population, and can include, for example, vaccines, medicine, food, water, etc., depending upon the particular application. The demand for the product should be met as nearly as possible since otherwise there may be additional loss of life. In times of crises, a system-optimization approach is mandated since the demands for critical supplies should be met (as nearly as possible) at minimal total cost.
87 An Overview of Some of the Relevant Literature M. J. Beckmann, C. B. McGuire, and C. B. Winsten (1956) Studies in the Economics of Transportation, Yale University Press, New Haven, Connecticut. S. C. Dafermos and F. T. Sparrow (1969) The Traffic Assignment Problem for a General Network, Journal of Research of the National Bureau of Standards 73B, D. E. Boyce, H. S. Mahmassani, and A. Nagurney (2005) A Retrospective on Beckmann, McGuire, and Winsten s Studies in the Economics of Transportation, Papers in Regional Science 84, A. Nagurney (2009) A System-Optimization Perspective for Supply Chain Network Integration: The Horizontal Merger Case, Transportation Research E 45, 1-15.
88 A. Nagurney, T. Woolley, and Q. Qiang (2010) Multiproduct Supply Chain Horizontal Network Integration: Models, Theory, and Computational Results, International Journal of Operational Research 17, A. Nagurney (2010) Formulation and Analysis of Horizontal Mergers Among Oligopolistic Firms with Insights into the Merger Paradox: A Supply Chain Network Perspective, Computational Management Science 7, A. Nagurney (2010) Supply Chain Network Design Under Profit Maximization and Oligopolistic Competition, Transportation Research E 46, Z. Liu and A. Nagurney (2011) Supply Chain Outsourcing Under Exchange Rate Risk and Competition, Omega 39,
89 This part of the presentation is based on the paper: Supply Chain Network Design for Critical Needs with Outsourcing, A. Nagurney, M. Yu, and Q. Qiang (2011), Papers in Regional Science 90, where additional background as well as references can be found.
90 We assume that the organization (government, humanitarian one, socially responsible firm, etc.) is considering n M manufacturing facilities/plants; n D distribution centers, but must serve the n R demand points. The supply chain network is modeled as a network G = [N,L], consisting of the set of nodes N and the set of links L. Let L 1 and L 2 denote the links associated with in house supply chain activities and the outsourcing activities, respectively. The paths joining the origin node to the destination nodes represent sequences of supply chain network activities that ensure that the product is produced and, ultimately, delivered to those in need at the demand points. The optimization model can handle both design (from scratch) and redesign scenarios.
91 Supply Chain Network Topology with Outsourcing The Organization 1 Manufacturing at the Plants M 1 M 2 M nm Shipping D 1,1 D 2,1 D nd,1 Distribution Center Storage D 1,2 D 2,2 D nd,2 Shipping R 1 R 2 R 3 R nr Demand Points
92 The Links The possible manufacturing links from the top-tiered node 1 are connected to the possible manufacturing nodes of the organization, which are denoted, respectively, by: M 1,...,M nm. The possible shipment links from the manufacturing nodes, are connected to the possible distribution center nodes of the organization, denoted by D 1,1,...,D nd,1. The links joining nodes D 1,1,...,D nd,1 with nodes D 1,2,...,D nd,2 correspond to the possible storage links. There are possible shipment links joining the nodes D 1,2,...,D nd,2 with the demand nodes: R 1,...,R nr.
93 There are also outsourcing links, which may join the top node to each bottom node (or the relevant nodes for which the outsourcing activity is feasible, as in production, storage, or distribution, or a combination thereof). The organization does not control the capacities on these links since they have been established by the particular firm that corresponds to the outsource link. The ability to outsource supply chain network activities for critical needs products provides alternative pathways for the production and delivery of products during times of crises such as disasters.
94 Demands, Path Flows, and Link Flows Let d k denote the demand at demand point k; k = 1,...,n R, which is a random variable with probability density function given by F k (t). Let x p represent the nonnegative flow of the product on path p; f a denote the flow of the product on link a. Conservation of Flow Between Path Flows and Link Flows f a = p P x p δ ap, a L, (1) that is, the total amount of a product on a link is equal to the sum of the flows of the product on all paths that utilize that link. δ ap = 1 if link a is contained in path p, and δ ap = 0, otherwise.
95 Supply Shortage and Surplus Let v k p P wk x p, k = 1,...,n R, (2) where v k can be interpreted as the projected demand at demand market k; k = 1,...,n R. Then, k max{0,d k v k }, k = 1,...,n R, (3) + k max{0,v k d k }, k = 1,...,n R, (4) where k and + k represent the supply shortage and surplus at demand point k, respectively. The expected values of k and + k are given by: E( k ) = v k (t v k )F k (t)d(t), k = 1,...,n R, (5) vk E( + k ) = (v k t)f k (t)d(t), k = 1,...,n R. (6) 0
96 The Operation Costs, Investment Costs and Penalty Costs The total cost on a link is assumed to be a function of the flow of the product on the link. We have, thus, that ĉ a = ĉ a (f a ), a L. (7) We denote the nonnegative existing capacity on a link a by ū a, a L. Note that the organization can add capacity to the in house link a; a L 1. We assume that ˆπ a = ˆπ a (u a ), a L 1. (8) The expected total penalty at demand point k; k = 1,...,n R, is, E(λ k k + λ+ k + k ) = λ k E( k ) + λ+ k E( + k ), (9) where λ k is the unit penalty of supply shortage at demand point k and λ + k is that of supply surplus. Note that λ k E( k ) + λ+ k E( + k ) is a function of the path flow vector x.
97 The Supply Chain Network Design Optimization Problem The organization seeks to determine the optimal levels of product processed on each supply chain network link (including the outsourcing links) coupled with the optimal levels of capacity investments in its supply chain network activities subject to the minimization of the total cost. The total cost includes the total cost of operating the various links, the total cost of capacity investments, and the expected total supply shortage/surplus penalty.
98 The Supply Chain Network Design Optimization Problem Minimize ĉ a (f a ) + ˆπ a (u a ) + a L 1 n R a L k=1 subject to: constraints (1), (2) and (λ k E( k ) + λ+ k E( + k )) (10) f a ū a + u a, a L 1, (11) f a ū a, a L 2, (12) u a 0, a L 1, (13) x p 0, p P. (14)
99 The Feasible Set We associate the Lagrange multiplier ω a with constraint (11) for link a L 1 and we denote the associated optimal Lagrange multiplier by ω a. Similarly, Lagrange multiplier γ a is associated with constraint (12) for link a L 2 with the optimal multiplier denoted by γ a. These two terms may also be interpreted as the price or value of an additional unit of capacity on link a. We group these Lagrange multipliers into the vectors ω and γ, respectively. Let K denote the feasible set such that K {(x,u,ω,γ) x R n P +,u Rn L 1 +,ω Rn L 1 +, andγ Rn L 2 + }.
100 Theorem The optimization problem is equivalent to the variational inequality problem: determine the vector of optimal path flows, the vector of optimal link capacity enhancements, and the vectors of optimal Lagrange multipliers (x,u,ω,γ ) K, such that: n R Ĉ p (x ) + ω x aδ ap + γaδ ap + λ + k P k p a L 1 a L 2 k=1 p P wk + a L 1 [ ˆπa (u a) u a λ k ω a 1 P k p P wk x p [x p xp ] p P wk x p ] [u a u a]+ a L 1 [ū a +u a p P x p δ ap ] [ω a ω a] + a L 2 [ū a p P x p δ ap ] [γ a γ a] 0, (x,u,ω,γ) K. (15)
101 Theorem (cont d.) In addition, (15) can be reexpressed in terms of links flows as: determine the vector of optimal link flows, the vectors of optimal projected demands and link capacity enhancements, and the vectors of optimal Lagrange multipliers (f,v,u,ω,γ ) K 1, such that: + a L 1 n R k=1 [ ĉa (fa ] ) + ωa [f a fa ] + [ ĉa (f f a f a a L 2 + a L 1 [ ˆπa (u a) u a ω a a ) ] [u a u a] + γ a ] [f a f a ] [ λ + k P k(v k ) λ k (1 P k(v k )) ] [v k v k ]+ a L 1 [ū a +u a f a ] [ω a ω a] + a L 2 [ū a f a ] [γ a γ a] 0, (f,v,u,ω,γ) K 1, (16) where K 1 {(f,v,u,ω,γ) x 0, and (1),(2),(13), and (14)hold, and ω 0, γ 0}.
102 Applications to Vaccine Production and Emergencies
103 Applications to Vaccine Production By applying the general theoretical model to the company s data, the firm can determine whether it needs to expand its facilities (or not), how much of the vaccine to produce where, how much to store where, and how much to have shipped to the various demand points. Also, it can determine whether it should outsource any of its vaccine production and at what level. The firm by solving the model with its company-relevant data can then ensure that the price that it receives for its vaccine production and delivery is appropriate and that it recovers its incurred costs and obtains, if negotiated correctly, an equitable profit.
104 Applications to Emergencies A company can, using the model, prepare and plan for an emergency such as a natural disaster in the form of a hurricane and identify where to store a necessary product (such as food packets, for example) so that the items can be delivered to the demand points in a timely manner and at minimal total cost.
105 The Algorithm, Explicit Formulae, and Numerical Examples
106 The Algorithm At an iteration τ of the Euler method (see Dupuis and Nagurney (1993) and Nagurney and Zhang (1996)) one computes: X τ+1 = P K (X τ a τ F(X τ )), (17) where P K is the projection on the feasible set K and F is the function that enters the variational inequality problem: determine X K such that F(X ) T,X X 0, X K, (18) where, is the inner product in n-dimensional Euclidean space, X R n, and F(X) is an n-dimensional function from K to R n, with F(X) being continuous. The sequence {a τ } must satisfy: τ=0 a τ =, a τ > 0, a τ 0, as τ.
107 Explicit Formulae for (17) to the Supply Chain Network Design Variational Inequality (15) x τ+1 p = max{0,xp τ + a τ (λ k (1 P k( xp τ )) λ + k P k( xp τ ) p P wk p P wk Ĉp(x τ ) x p a L 1 ω τ a δ ap a L 2 γ τ a δ ap )}, p P; (19) u τ+1 a = max{0,u τ a + a τ (ω τ a ˆπ a(u τ a ) u a )}, a L 1 ; (20) ω τ+1 a = max{0,ω τ a + a τ ( p P x τ p δ ap ū a u τ a )}, a L 1 ; (21) γ τ+1 a = max{0,γ τ a + a τ ( p P x τ p δ ap ū a )}, a L 2. (22)
108 Numerical Examples 18 The Organization M 1 M 2 M D 1,1 D 2, D 1,2 D 2, , R 1 R 2 R 3
109 Example 1 The demands at the three demand points followed a uniform probability distribution on the intervals [0,10], [0,20], and [0,30], respectively: P 1 ( p P w1 x p x p ) =, P 2 ( p P w2 x p x p ) =, p P w1 p P w2 P 3 ( p P w3 x p x p ) =, 30 p P w3 where w 1 = (1,R 1 ), w 2 = (1,R 2 ), and w 3 = (1,R 3 ). The penalties were: λ 1 = 50, λ+ 1 = 0; λ 2 = 50, λ+ 2 = 0; λ 3 = 50, λ+ 3 = 0. The capacities associated with the three outsourcing links were: ū 18 = 5, ū 19 = 10, ū 20 = 5. We set ū a = 0 for all links a L 1.
110 Table 1: Total Cost Functions and Solution for Example 1 Link a ĉ a (f a ) ˆπ a (u a ) fa ua ωa γa 1 f u1 2 + u f u2 2 + u f u3 2 + u f u4 2 + u f u5 2 + u f u6 2 + u f u7 2 + u f u8 2 + u f u9 2 + u f u u f u u f u u f u u
111 Table 2: Total Cost Functions and Solution for Example 1 (continued) Link a ĉ a (f a ) ˆπ a (u a ) fa ua ωa γa 14 f14 2.5u u f u u f u u f u u f f f Note that the optimal supply chain network design for Example 1 is, hence, as the initial topology but with links 13, 15, and 16 removed since those links have zero capacities and associated flows. Note that the organization took advantage of outsourcing to the full capacity available.
112 18 The Organization M 1 M 2 M D 1,1 D 2, D 1,2 D 2, , R 1 R 2 R 3 Figure 9: The Optimal Supply Chain Network Design for Example 1
113 Example 2 Example 2 had the identical data to that in Example 1 except that we now assumed that the organization had capacities on its supply chain network activities where ū a = 10, for all a L 1. Table 3: Total Cost Functions and Solution for Example 2 Link a ĉ a (f a ) ˆπ a (u a ) fa ua ωa γa 1 f u1 2 + u f u2 2 + u f u3 2 + u f u4 2 + u f u5 2 + u f u6 2 + u f u7 2 + u f u8 2 + u f u9 2 + u
114 Table 4: Total Cost Functions and Solution for Example 2 (continued) Link a ĉ a (f a ) ˆπ a (u a ) fa ua ωa γa 10.5f u u f u u f u u f u u f14 2.5u u f u u f u u f u u f f f Note that links 13 and 16 now have positive associated flows although at very low levels.
115 18 The Organization M 1 M 2 M D 1,1 D 2, D 1,2 D 2, , R 1 R 2 R 3 Figure 10: The Optimal Supply Chain Network Design for Example 2
116 Example 3 Example 3 had the same data as Example 2 except that we changed the probability distributions so that we now had: P 1 ( p P w1 x p x p ) =, 110 p P w1 P 2 ( p P w2 x p x p ) =, 120 p P w2 P 3 ( p P w3 x p x p ) =. 130 p P w3
117 Table 5: Total Cost Functions and Solution for Example 3 Link a ĉ a (f a ) ˆπ a (u a ) fa ua ωa γa 1 f u1 2 + u f u2 2 + u f u3 2 + u f u4 2 + u f u5 2 + u f u6 2 + u f u7 2 + u f u8 2 + u f u9 2 + u f u u f u u f u u f u u
118 Table 6: Total Cost Functions and Solution for Example 3 (continued) Link a ĉ a (f a ) ˆπ a (u a ) fa ua ωa γa 14 f14 2.5u u f u u f u u f u u f f f The optimal supply chain network design for Example 3 has the initial topology since there are now positive flows on all the links. It is also interesting to note that there is a significant increase in production volumes by the organization at its manufacturing plants.
119 18 The Organization M 1 M 2 M D 1,1 D 2, D 1,2 D 2, , R 1 R 2 R 3 Figure 11: The Optimal Supply Chain Network Design for Example 3
120 Extensions to Perishable Products without and with Competition
 Supply Chain Network Operations Management of a Blood Banking System with Cost and Risk Minimization, in")
, Supply Chain Network Design of a Sustainable Blood Banking System, in press in Sustainable Supply")
121 A. Nagurney, A. Masoumi, and M. Yu (2010) Supply Chain Network Operations Management of a Blood Banking System with Cost and Risk Minimization, in press in Computational Management Science. A. Nagurney and A. H. Masoumi (2011), Supply Chain Network Design of a Sustainable Blood Banking System, in press in Sustainable Supply Chains: Models, Methods and Public Policy Implications, T. Boone, V. Jayaraman, and R. Ganeshan, Editors, Springer, London, England.
).")
122 Over 39,000 donations are needed everyday in the United States, and the blood supply is frequently reported to be just 2 days away from running out (American Red Cross (2010)). Hospitals with as many days of surgical delays due to blood shortage as 120 a year have been observed (Whitaker et al. (2007)). The national estimate for the number of units blood products outdated by blood centers and hospitals was 1,276,000 out of 15,688,000 units (Whitaker et al. (2007)). The American Red Cross is the major supplier of blood products to hospitals and medical centers satisfying over 45% of the demand for blood components nationally (Walker (2010)).
123 Supply Chain Network Topology for a Regionalized Blood Bank 1 ARC Regional Division Blood Collection C 1 C 2 C 3 C nc Blood Collection Sites Shipment of Collected Blood B 1 B nb Blood Centers Testing & Processing P 1 P np Component Labs Storage S 1 S ns Storage Facilities Shipment D 1 D 2 D nd Distribution Centers Distribution R 1 R 2 R 3 R nr Demand Points
124 We developed a supply chain network optimization model for the management of the procurement, testing and processing, and distribution of a perishable product that of human blood. Novel features of the model include: It captures perishability of this life-saving product through the use of arc multipliers; It contains discarding costs associated with waste/disposal; It handles uncertainty associated with demand points; It assesses costs associated with shortages/surpluses at the demand points, and It quantifies the supply-side risk associated with procurement.
125 What About Competitive Behavior, Product Perishability, and Supply Chain Networks?
126 Recent results in this dimension: A. H. Masoumi, M. Yu, and A. Nagurney (2011), A Supply Chain Generalized Network Oligopoly Model for Pharmaceuticals Under Brand Differentiation and Perishability.
127 In this paper, we develop a generalized network oligopoly model for pharmaceutical supply chain competition which takes into account brand differentiation of the product as well as waste management costs. It has has the following original features: 1. it handles the perishability of the pharmaceutical product through the introduction of arc multipliers; 2. it allows each firm to the discarding cost of waste / perished medicine; 3. it captures product differentiation under oligopolistic competition through the branding of drugs, which can also include generics as distinct brands. This feature is important since the patents rights for many top-selling drugs are expiring. The governing concept is that of Cournot-Nash equilibrium and we use variational inequality theory for the modeling, analysis, and computations.

128 Medical waste A pressure faced by pharmaceutical firms is the impact of their medical waste, which includes the perished excess medicine, and inappropriate disposal on the retailer / consumer end.
129 Pharmaceutical Firm 1 Pharmaceutical Firm I 1 I M 1 1 M 1 n 1 M I M 1 M I nm I D1,1 1 D 1 nd 1,1 D1,1 I D I nd I, D1,2 1 D 1 nd 1,2 D1,2 I D I nd I,2 R 1 R nr Demand Markets Figure 12: The Pharmaceutical Supply Chain Network Topology
130 Summary, Conclusions, and Suggestions for Future Research
131 We emphasized the importance of capturing behavior in supply chain modeling, analysis, and design. We discussed a variety of network design approaches: the addition of links; the integration of networks as in mergers and acquisitions; and the design from scratch (and redesign). We developed an integrated framework for the design of supply chain networks for critical products with outsourcing. The model utilizes cost minimization within a system-optimization perspective as the primary objective and captures rigorously the uncertainty associated with the demand for critical products at the various demand points.
132 The supply chain network design model allows for the investment of enhanced link capacities and the investigation of whether the product should be outsourced or not. The framework can be applied in numerous situations in which the goal is to produce and deliver a critical product at minimal cost so as to satisfy the demand at various demand points, as closely as possible, given associated penalties for under- and over-supply.
133 In additional research, we have been heaving involved in constructing mathematical models that capture the impacts of foreign exchange risk and competition intensity on supply chain companies who are involved in offshore outsourcing activities. Our research in supply chains has also led us to other time-sensitive products, such as fast fashion, and the of medical nuclear products / radioisotopes used in medical imaging and diagnostics. We have also been focusing on design of sustainable supply chains. Finally, we have also developed models for the dynamics and equilibrium states in ecological predator-prey networks, that is, supply chains in nature.
134 We expect that future research will include design for robustness and resiliency. Some recent research that we have begun in this direction: Modeling of Supply Chain Risk Under Disruptions with Performance Measurement and Robustness Analysis, Q. Qiang, A. Nagurney, and J. Dong (2009), in Managing Supply Chain Risk and Vulnerability: Tools and Methods for Supply Chain Decision Makers, T. Wu and J. Blackhurst, Editors, Springer, London, England,

135 Thank You! For more information, see: