CAPITAL MARKETS DAY February 2017
|
|
|
- Joseph Bishop
- 5 years ago
- Views:
Transcription

1 CAPITAL MARKETS DAY February
2 Forward looking statements disclaimer This presentation contains oral and written statements that are, or may be, forward-looking statements with respect to certain of AO World plc s ( AO ) plans and its current goals and expectations relating to its future financial condition, performance and results. These forward-looking statements are usually identified by words such as believe, estimates, plans, projects, anticipates, goal, expects, intends, may, will, or should or, in each case, their negative or other variations or comparable terminology. These forward-looking statements include matters that are not historical facts and include statements regarding the Company s intentions, beliefs or current expectations. Any forward-looking statements in this presentation reflect the Company s current expectations and projections about future events. By their nature, forward-looking statements involve a number of risks, uncertainties and assumptions which may be beyond AO s control and could cause actual results or events to differ materially from those expressed or implied by the forward-looking statements. There are important factors that could cause AO s actual financial condition, performance and results to differ materially from those expressed or implied by the forward-looking statements, including, among other things: UK domestic and global political, social and economic and business conditions; our ability to maintain our culture, expand into new European territories, grow our brand and attract new customers; the resilience of our IT systems; changes in regulations or compliance and interruption to physical infrastructure. A further list and description of these risks, uncertainties and other factors, is set out in our Annual Report for the year ended 31 March 2016 and in our Interim Results for the six months to 30 November 2016, both of which can be found at Forward-looking statements contained in this presentation regarding past trends or activities should not be taken as a representation that such trends or activities will continue in the future. You should not place undue reliance on forward-looking statements, which speak only as of the date of this presentation. No representations or warranties are made as to the accuracy of such statements, estimates or projections. AO expressly disclaims any undertaking or obligation to update the forward-looking statements made in this presentation or any other forward-looking statements we may make except as required by law. Please note that the Directors of the Company are, in making this presentation, not seeking to encourage shareholders to either buy or sell shares in the Company. Shareholders in any doubt about what action to take are recommended to seek financial advice from an independent financial advisor authorised by the Financial Services and Markets Act
3 Agenda 1. Welcome 2. Our mission, the 4C s and the AO Way 3. Why Germany and the Netherlands? 4. Our challenges 5. What next? Scalability 6. Our journey to Summary and Q&A 3
4 Welcome


5 Hosts today Steve Caunce Chief Operating Officer Mark Higgins Chief Financial Officer Kevin Monk Group International Director Steve Richards Operations Director Alpay Guener Retail Director 5
6 Our mission 6

7 4C s Model CULTURE & BRAND Be exceptional in the moments that matter and simply care more 7

8 The AO Way 8

9 Our business model in Europe

10 Order to deliver 10
 2 Largest MDA, SDA, AV and")
11 Customer opportunity - Germany Total addressable European market of 94bn 1 Why Germany? Geographically well positioned to execute strategy Substantial opportunity for growth: Under-developed online proposition MDA online penetration rate 18% (UK: 39%) 2 Largest MDA, SDA, AV and Computing market in Europe 3 Higher MDA APVs than UK 4 1 Gross market size (inc. VAT) comprising MDA, SDA & AV (year to September 2016: source GfK) and Computing and the broader electrical market comprising personal care, in-care devices, portable CE, mobile and gaming (year to December 2015: source Euromonitor) across highlighted current and future potential markets. Exchange rates are the average for the month to 14 November MDA online penetration rate equates to the total value of MDA products purchased via an online channel. German online sales include delivery charges whilst UK sales do not. source: GfK year to November 16 3 When compared to highlighted countries. source: GfK (year to September 2016) for MDA, SDA, AV and Euromonitor (year to December 2015) for Computing and the broader electrical market comprising personal care, in-care devices, portable CE, mobile and gaming. Exchange rates are the average for the month to 14 November Average Product Value source: AO internal data year to November 2016 The above map highlights those countries that we currently operate in (dark green) and those which we are currently exploring (light green). 11
 1 High population density 2 Higher MDA APVs than UK 3 1 source: Worldbank 2015 2 Compared to UK & Germany (source: Worldbank 2015) 3 Average Product Value:source: AO internal data year to")
12 Customer opportunity - Netherlands Why the Netherlands? Proximity to AO European central hub Relatively low start-up costs and ease of execution High overall online adoption rates 93.1% (UK: 92.0%) 1 High population density 2 Higher MDA APVs than UK 3 1 source: Worldbank Compared to UK & Germany (source: Worldbank 2015) 3 Average Product Value:source: AO internal data year to November

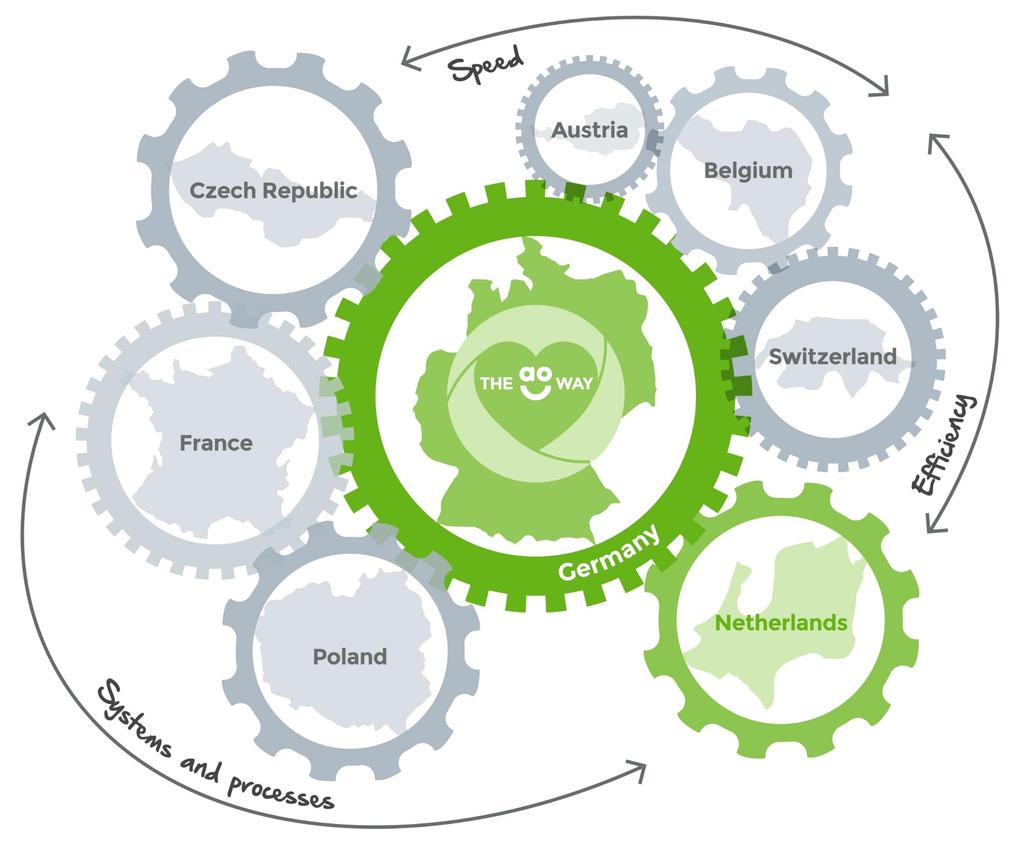
13 Countries The country bolt-on model Launched Netherlands March 2016 with learnings applied from Germany Supplier engagement Recruitment of key personnel Customer acquisition Result Smooth launch Improved margins and sales growth Replication model Further leverage of supplier relationships and AO culture Accumulate experience 13
14 Our challenges 14

15 AO Customers Customers love the AO Way NPS: Germany: 91 Netherlands: 85 Average Trusted Shops score in Germany is 4.8 out of 5 Points Customer base and repeat purchase rates growing Proposition expanded to include: AV Warranty products Premium installations 15
16 Our challenges 16

17 Suppliers Local strategy continuing to build momentum Successful supplier day with all major brands in both territories Relationships continue to improve Further alignment planned for 2017 to leverage AO content and media assets to unlock additional support Manufacturer testimonial 17
18 Our challenges 18

19 Culture Building the team Replicating the AO Way Central recruitment process against existing group values UK senior management initially based in territory Adapt to be respectful of different customs Educate through: Workshops Engagement events Executive Team value session Supplier days Ongoing mission to reinforce, develop and refine 19

20 Categories *Categories currently being explored for launch in

21 Categories The category bolt-on model AV launched in Germany October 2016 Learnings applied from UK roll-out Local to local supplier engagement with AO industry expert Ability to leverage/utilise UK content at low cost Draw on UK knowledge and experience Future development Grow suppliers, categories & range Build revenue & margin 21

22 Brand Renewed focus on brand following period of consolidation through: Building a solid brand foundation Translating the AO way in new territories Ensuring brand consistency throughout the UK and Europe Increasing spontaneous brand awareness to drive traffic Using AO branded green fleet only 22
23 Scalability 23

24 The growth journey

25 Our objective Profitability by 2020 Assumes existing territories only Does not include substantial brand investment to accelerate growth Leveraging our cost base Achieve profitable adjusted EBITDA* run-rate by FY21 Revenue of c. 250m Target to grow the business at >30% CAGR Grow sustainably *Adjusted EBITDA is defined by the Group as profit/(loss) before tax, depreciation, amortisation, net finance income and "adjustments". Adjustments is defined by the Group as set-up costs relating to overseas expansion and share-based payment charges/credits attributable to exceptional LTIP awards which the Board considers one-off in nature. 25
26 P&L dynamics Gross margin Product margin Logistics Other margin Selling and general administrative costs Marketing Warehousing Other admin 26

27 Logistics European infrastructure Regional Distribution Centre and customer service Current Outbases: 4 in Germany 1 in Utrecht plus customer service centre Future outbases identified in complementary locations Fleet We re in c100 delivery vehicles* making c1,000 deliveries per day Currently have c300 drivers Rhenus partnership - the SMART solution to problem postcodes *Includes a small number of hired vehicles Forecasted outbases by
28 Logistics Revenue / Vans Significant capacity for growth c150% growth in revenue requires a c65% increase in vans Efficiencies build as revenue grows 28

29 Logistics - Warehousing 29

30 Product margin journey Continue with current strategy Build on partnerships with manufacturers Continue to educate them on the AO Way Increase marketing campaigns to produce engaging content for their customers Build marketing support Leverage group-wide media assets 30

31 Building the brand and driving traffic Taken learnings from the UK and adapted our strategy to the market Continue driving our digital performance channels (e.g. Google and affiliates) Increase our SEO rankings Build social media audience Utilise local marketing channels e.g. direct mail and ecrm Increase local and national media through PR Use TV advertising tactically 31
32 P&L dynamics Gross margin Product margin Logistics Other margin Selling and general administrative costs Marketing Warehousing Other admin Fixed costs largely built leveraging variable costs with scale 32
33 Our challenges 33

34 Summary 34
35 Q&A 35