Forward-Looking Statements
|
|
|
- Lizbeth Harrell
- 5 years ago
- Views:
Transcription

1
2 Forward-Looking Statements 2 Certain statements contained in this presentation maybe viewed as forwardlooking statements. Such forward-looking statements represent the Company s expectations or beliefs concerning future events and involve known and unknown risks and uncertainty that could cause actual results, performance or events to differ materially from those expressed or implied in such statements.
3 1H2018 Results Agenda 3 Consumer Products Review Key Initiatives Financial Review Motor Business Review

4 1H2018 Results Agenda 4 Consumer Products Review Key Initiatives Financial Review Motor Business Review
5 Financial Review 2018 Half Year Results 5 4.8% Revenue (HK$ M) 9.8% Profit Attributable to Shareholders (HK$ M) 18.5% 23,352 24,474 25, H2017 1H2018 Excluding HKFRS15 1H2017 1H2018
6 Financial Review Revenue by Business Segment 6 Revenue by Business Segment 0.1% 1H % 0.1% 1H % 34.2% 25.7% Motor Business Consumer Products Business Others
7 Financial Review Revenue by Geography 7 Revenue by Geography 1H2017 1H % 60.0% 6.9% 66.9% 29.9% 26.2% Mainland China Hong Kong and Macao Other Markets
8 Financial Review Earnings and Dividend 8 Return on Equity (Annualised) Return on Capital Employed (Annualised) 5.2% 5.4% 4.5% 5.1% 1H2017 1H2018 1H2017 1H2018
9 Financial Review Earnings and Dividend 9 HK$ M 1H2018 1H2017 % Basic earnings per share (HK cents) % Interim dividend per share (HK cents) % HK$ 30 June Dec 2017 % Net asset value per share %
10 Financial Review Financial Position 10 HK$ M 30 June Dec 2017 Non current assets 11,088 11,026 Current assets 15,892 16,225 Current liabilities 12,990 11,589 Non-current liabilities 3,368 4,950 Net assets 10,622 10,712 Non-controlling interests Shareholders funds 10,076 10,145
11 Financial Review Net Gearing 11 HK$ M 30 June Dec June 2017 Cash and bank deposits 1,083 1,138 1,713 Total debt 7,073 6,927 7,019 Net debt 5,990 5,789 5,306 Shareholders funds 10,076 10,145 9,231 Total capital 16,066 15,934 14,537 Net gearing ratio 37.3% 36.3% 36.5%
12 Financial Review Consolidated Cash Flow Statement 12 HK$ M 1H2018 1H2017 Change Net cash generated from operating activities (175) Net cash (used in) / generated from investing activities (763) 252 (1,015) Net cash used in financing activities (25) (530) 505 Dividend paid to shareholders of the Company - (68) 68 Net (decrease) / increase in cash and cash equivalents (92) 525 (617)


13 1H2018 Results Agenda 13 Consumer Products Review Key Initiatives Financial Review Motor Business Review


14 Consumer Products Profile 14 Food & FMCG Nearly 70 years experience in distribution and trading Operations in 10+ economies in Greater China and Southeast Asia Electrical Products Electrical, lifestyle, audio and home appliance distribution Operations in Hong Kong, Macao, China and Southeast Asia 35+ retail and service outlets Logistics Internal and external FMCG customers Warehousing, transport, value-added services Healthcare Operations in 8 economies Category coverage including pharmaceuticals, medical devices, OTC, hospital consumables, diagnostics and nutrition
15 Consumer Products Business Performance Highlights 15 Revenue by Geography (HK$ M) Revenue excluding HKFRS 15 (HK$ M) Operating Profit /(Loss) (HK$ M) 21.4% 7.4% 102.2% 7,994 1,444 6,280 7,994 1,444 7,401 1, (3) 4 1, ,306 3,501 4,306 4,274 (40) (179) 2,244 1,751 2,244 1,856 1H2017 1H2018 1H2017 1H2018 1H2017 1H2018 Mainland China HK & Macao Other Markets Mainland China HK & Macao Other Markets Mainland China HK & Macao Other Markets
16 Consumer Products Business HK & Macao Food and FMCG 16 Performance Review Revenue (HKD) +0.9% excluding HKFRS 15 Operating Profit (HKD) +20.9% Agency distribution: Stable results with slight decrease in profit; enhancing portfolio and channel penetration Commodity trading: Improved revenue and segment results despite market challenges Revenue decrease of 10.9% including HKFRS 15 impact Operating profit increased due to: Commodity trading portfolio Manufacturing consolidation Food retail improvements Manufacturing: Consolidated in Yuen Long with improved profitability; upgrading product portfolio Retail: Improved profitability after store rationalisation; continuing brand and customer experience enhancements


17 Consumer Products Business HK & Macao Food and FMCG 17 Food Manufacturing and Processing Centralized workshop capable to offer more variety of seafood products Production capacity expanded allowing delivery of premium natural meat products


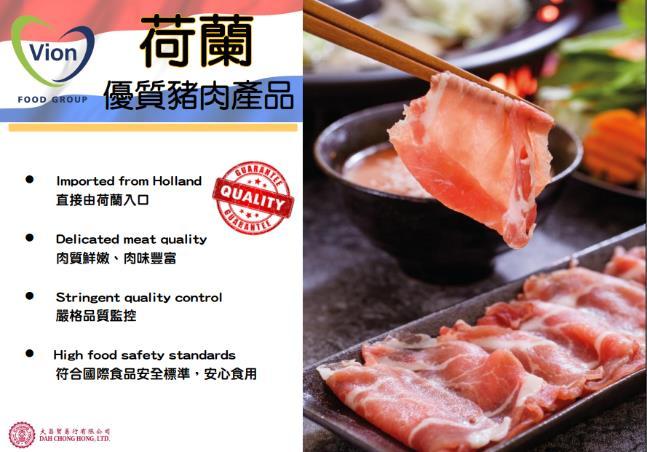
18 Consumer Products Business HK & Macao Food and FMCG 18 Agency Distribution


19 Consumer Products Business HK & Macao Food and FMCG 19 House Brands


20 Consumer Products Business HK & Macao Food and FMCG 20 Commodity Trading


21 Consumer Products Business HK & Macao Food and FMCG 21 Food Retail


22 Consumer Products Business HK & Macao Food and FMCG 22 Outlook
 -231% Revenue declined due to portfolio optimisation Operating losses during ongoing restructuring Implementing a wide range of business enhancement initiatives Infrastructure")
23 Consumer Products Business Mainland China Food and FMCG 23 Performance Review Revenue (HKD) -9.3% Operating Loss (HKD) -231% Revenue declined due to portfolio optimisation Operating losses during ongoing restructuring Implementing a wide range of business enhancement initiatives Infrastructure and resource integration Prudent inventory and cost control Realigned KPIs and incentives Channel mix review
 +5.")

24 Consumer Products Business Electrical Products Distribution 24 Performance Review Revenue (HKD) +6.0% Operating Profit (HKD) +5.9% Improved performance from: Growth of property development projects Strong air-conditioner sales Consumer electronics in mainland China Offset by: Warehouse relocation costs Warm winter impacting heating product sales Key Initiatives Expand the project-based business Launch audio and lifestyle products Manage margin impact from WEEE


25 Consumer Products Business Electrical Products Distribution 25 Growth in lifestyle audio
 +50.")

26 Consumer Products Business Logistics Solutions 26 Performance Review Revenue (HKD) -5.2% Operating Profit (HKD) +50.0% Reduced revenue from strategic portfolio optimisation Profit increase due to better utilisation and synergies from consolidation Key Initiatives Strengthen network in Eastern and Southern China Commence operation of the Hengqin logistics centre in 2019

27 Consumer Products Business Logistics Solutions 27 Hengqin Distribution Centre
28 Consumer Products Business Other Markets Food and FMCG 28 OPERATION REVIEW Performance Review Revenue (HKD) -37.8% Net Impact to Group $25 million from restructuring Agency distribution operations in Singapore, Taiwan, Malaysia, Indonesia, Philippines, Japan, Brunei Restructuring in Singapore and East Malaysia to focus resources Manufacturing focused on Productivity and yield improvements Expansion in OTC and nutrition Key Initiatives Focus on higher value categories Enhance operational efficiencies
29 Consumer Products Business Healthcare Products Distribution 29 Performance Review Revenue (HKD) -9.5% Operating Profit (HKD) -10.3% excluding HKFRS 15 Revenue decreased by 52% after the impact of HKFRS 15 Mainland China market shift to generic and locally produced pharmaceuticals Market share and profitability growth in Thailand and Singapore Key Initiatives Transferring operations into new infrastructure in Hong Kong and Thailand Developing specialty services including emergency delivery, robotic pick & pack, cold chain and innovative Home-Health services Favorable market dynamics from rising incomes and aging populations

30 Consumer Products Business Healthcare Products Distribution 30 Auriga Health Distribution Centre

31 Consumer Products Business Healthcare Products Distribution 31 Nature s Care
32 1H2018 Results Agenda 32 Consumer Products Review Key Initiatives Financial Review Motor Business Review
33 Motor Business Overview 33 Motor Business 50+ years of motor distribution and dealership expertise Operating 100+ dealerships and 4S shops in Greater China Diversified portfolio covering passenger cars, commercial vehicles, electrical buses and special purpose vehicles Motor-related Business Wide portfolio of motor related services including vehicle repair, used car sales, parts trading, vehicle rental, motor financing, auto insurance, yacht sales, airport services and engineering projects
34 1H2017 1H2018 1H2017 1H2018 1H2017 1H2018 Motor Business Performance Highlights ,649 Revenue (HK$ M) 18.5% 15,338 18, ,892 11,770 14,628 Operating Profit (HK$ M) % pt 2.4% 3.3% Operating Margin 1.8pt 0.7pt 6.3% 8.1% 8.3% 7.6% H2017 1H2018 Mainland China HK & Macao Other Markets 1H2017 1H2018 Mainland China HK & Macao Other Markets Mainland China HK & Macao Other Markets

35 Motor Business Mainland China 35 Performance Review Revenue (HKD) +24.3% Operating Profit (HKD) +73.4% Unit sales increase of 10.5% Exposure to premium and luxury segment Enhanced front line performance Acquisition of new dealerships in Zhejiang province Improved profitability from: Brand portfolio upgrades Pricing management and inventory controls
36 Motor Business Mainland China 36 Dealership Performance New cars sales revenue +24.7% After-sales service revenue +31.2% After-sales serviced units 570k Aftersales Revenue Share 1H % 1H % Motor Brands 4S Shops Showrooms Audi 7 -- Bentley 7 -- Chevrolet 3 -- Ferrari / Maserati / Alpha Romeo 5 -- Honda 11 4 Isuzu / Qingling 6 2 Lexus 9 1 Mercedes Benz Nissan % New car sales After-sales service 90.5% SGM Buick 5 -- Toyota 22 7 Others 2 1 Total June 30,

37 Motor Business Mainland China 37 Shenzhen Auto Show

38 Motor Business Mainland China 38 Bentley Continental GT


39 Motor Business Mainland China 39 Bentley Continental GT Video?

40 Motor Business Mainland China 40 Bentley Continental GT Video?

41 Motor Business Hong Kong and Macao 41 Performance Review Revenue (HKD) +9.2% Operating Profit (HKD) +39.9% DCH passenger car unit sales increased by 26.9% following change to EV subsidy, strong model launches and business enhancement measures DCH commercial vehicles sales declined by 9.7% Operating profit increased from: Passenger car sales Efficiency enhancements Motor related business, particularly aviation Operating margin increased from 6.3% to 8.1%

42 Motor Business Hong Kong and Macao 42 Sinotruk Streetwasher Vehicle Tender

43 Motor Business Hong Kong and Macao 43 Sinotruk Streetwasher Vehicle Tender

44 Motor Business Hong Kong and Macao 44 GSE Pooling Scheme

45 Motor Business Hong Kong and Macao 45 GSE Pooling Scheme

46 Motor Business Hong Kong and Macao 46 Princess Yachts

47 Motor Business Hong Kong and Macao 47 Princess Yachts, Showroom in Central

48 Motor Business Other markets 48 Performance Review Revenue (HKD) -29.3% Operating Profit (HKD) -22.9% Revenue and profit decreased due to the delay of Euro VI vehicles in Singapore Operating margin increased by 0.7 points to 8.3% with increase commercial vehicle sales in Taiwan and the exit of a passenger vehicle dealership in 2017 Euro VI vehicle delivery has begun in Singapore

49 1H2018 Results Agenda 49 Consumer Products Review Key Initiatives Financial Review Motor Business Review

50 Key Initiatives 1H Key Initiatives Enhance operational excellence Build a service and performance culture Leverage CITIC platform and drive synergy

51 Key Initiatives 1H Big Big Shop with TVB


52 Thank You and Q&A 52