Water Industry Forum CIS and totex incentives. Mark Worsfold, Chief Engineer 20 March Water today, water tomorrow
|
|
|
- Diana Ferguson
- 5 years ago
- Views:
Transcription

1 Water Industry Forum CIS and totex incentives Mark Worsfold, Chief Engineer 20 March
2 AMP5 and the capital expenditure incentive scheme (CIS) CIS is a form of menu regulation It encourages truth telling by the companies within their business plans, and: discourages bidding it s a business plan not a bid tackles the asymmetry of information It provides the incentives within the delivery of the programme, and: rewards innovative companies that outperform penalises inefficient delivery Ofwat reviews the company plans and determinates a central estimate of what a median performing company would spend to deliver the outputs cost assessment 2
3 Capital expenditure (capex) incentive scheme The CIS baseline represents a central estimate we defined as: A central estimate represents: How we derived a central estimate A balanced representative view of efficiency A balanced view of risk A well-evidenced forecast expenditure which relates to justified outputs We used the cost base comparative tool to challenge the pricing of forecast expenditure. We adjusted expenditure forecasts to an achievable level of efficiency for a middleranking company, as evidenced through the cost base submissions, adjusted for the future efficiency that could be expected from an average performing company In adjusting for efficiency, we also took account of evidence on the consistency between cost base and business plan cost estimates We reviewed the approach each company had taken on risk, in planning investment in both base service and enhancement. We applied challenges where appropriate All outputs must be justified using cost-benefit analysis (CBA), sound asset management planning, with expenditure justified and related to outputs. We used the capital estimating scorecard to guide challenges to poorly evidenced cost estimates 3
?")
4 Approach to assessing capex cost assessment What is the process of cost assessment? Is there a need for the investment? Is this the best/most appropriate solution and based on a clear strategy? Are the costs robust (and the most likely costs)? Are they more or less efficient than a middle ranking company? 4
5 Approach to assessing capex Is there a need for the investment? Yes = No challenge (so far) move to next test (ie, solution) No = Exclude from Ofwat view One sided = output probably is needed but the case is not convincing and they could have done better (CBA commonly used) Two sided = either the output is probably not needed at all or we all need more time to come to the best outcome (eg, climate change impact on SDB) 5
6 Approach to assessing capex Is this the best/most appropriate solution? Yes = No challenge (so far) move to next test (ie, costs) No = Range of options: Replace with other assumptions use history (eg, number of sewer flooding additions, meter optants) Maturity challenge AMA challenge DWI or EA support Reporter views 6
7 Approach to assessing capex Is this the most likely and robust cost? Yes = No challenge (so far) move to next test (ie, efficiencies) No = Range of options: Revert to history/comparison with history (eg, sewer flooding unit costs, meter costs, G&C) Reporter challenge Maturity challenge (overlap with solution) 7
8 Approach to assessing capex How do they compare to the efficiency of a middle ranking company? Sewerage Infrastructure 25.0% TMS % of overall SI capex programme (post efficiency) ANH YKY WSX 20.0% 15.0% SVT 10.0% Centralised position WSH 5.0% NES SWT NWT SRN -20.0% -15.0% -10.0% -5.0% 0.0% 5.0% 10.0% 15.0% Most efficient (-ve) efficiencies 0.0% Based on FD Cost Base efficiency and reflecting CIS signage Least efficient (+ve ) efficiencies 8
9 PR09 Review and challenge DBPs Scope and price challenges Set draft baseline, output package and CIS matrix (Aug Nov) Review and challenge FBPs Make justified adjustments to baseline and outputs Calculate draft determination using baseline and company capex forecasts (Apr Jun) Review representations Finalise baseline figures, outputs and permitted changes to company estimates (Sept Oct) Aug 08 Dec 08 Apr 09 July 09 Nov 09 Publish draft baseline, outputs packages and incentives menu (19 Dec 2008) Publish DDs based on Ofwat capex baseline and FBP estimates (23 Jul 2009) Publish FDs using final baseline and adjusted FBP estimates (26 Nov 2009) Draft BPs 11 Aug 2008 Final BPs 7 Apr 2009 Company and stakeholder representations on DDs 10 Sept
10 Total capital expenditure assumptions 25 billion ( prices) Final business plan Draft determinations Final determinations 24.2 billion 20.8 billion 22.1 billion 10
11 CIS draft baseline company ratios WaSCs Water Sewerage WoCs Water Anglian Bournemouth 167 Dŵr Cymru Bristol 143 Northumbrian Cambridge 199 Severn Trent Dee Valley 125 South West Folkestone 171 Southern Portsmouth 153 Thames South East 181 United Utilities South Staffs 176 Wessex Sutton & E Yorkshire Surrey Tendring Hundred Three Valleys
12 CIS baseline ratios WaSCs Water Sewerage WoCs Water Anglian Bournemouth 115 Dŵr Cymru Bristol 138 Northumbrian Cambridge 101 Severn Trent Dee Valley 99 South West Veolia S East 119 Southern Portsmouth 108 Thames South East 129 United Utilities South Staffs 107 Wessex Sutton & E 124 Yorkshire Surrey Veolia East 143 Veolia Central 131 Industry average

13 The CIS matrix 13

14 CIS how is it panning out? CIS operates on the period as a whole We are only two years in are unsighted of progress No requirement to track annual progress PR14 will turn the handle based on available actual data (from Reg Accounts) and the projected outturn (based on BP submissions) Given time lag on COPI, finalised position won t be known until 2016 in the meantime, spreadsheet model that performs the CIS true-up calculations (as trailed in IN12/08) is available on web We expect companies will be using it to gauge the implications of their current progress/projections Adrian and Frank may talk more about this 14
15 Setting price limits the methodology consultation February


16 How we got here challenges 310 billion investment needed for infrastructure to 2020 and beyond Water and sewerage sectors invest 4 billion a year New businesses with new needs 5% reduction to household incomes since 2010 while bills have gone up 10% Water bad debt 15 a year for every customer A case study: A business customer that could save 80, ,000 by receiving one bill instead of 4,000 April 2012 drought as previous 18 months driest for more than 100 years water restrictions 2012 second wettest year since UK records began 8,000 properties flooded Currently only 4 5% of water being traded 16
, Draft Water Bill")
 Ofwat: Future price limits and regulatory compliance statements")
17 How we got here building for the future Strategic Policy Position Statement on Water 2011 UK Government: Water White Paper (2011), Draft Water Bill (2012) Welsh Government: Strategic Policy Position (2011), Water Strategy (2013) Ofwat: Future price limits and regulatory compliance statements (2012) 17
18 Key messages of the consultation (1) Delivering a better price setting process Modernising our approach to help tackle new challenges Widespread engagement from customers to companies, from Governments to investors Our methodology supports the policy goals of the UK and Welsh Governments Regulating for efficiency and growth Retail controls give greater incentives for efficiency and supports more competition in England Safeguarding the interests of investors, keeping the regulatory capital value (RCV) and RPI indexation in wholesale Targeted incentives and greater ownership by companies will deliver more scope for innovation and efficiency 18

19 Key messages of the consultation (2) A focus on customers We are putting ever greater emphasis on customer views Retail costs will not automatically be allowed to increase with inflation Where customers have choice, we are freeing up companies to respond to the demands of their business customers Ensuring sustainable water use Companies have more freedom and more accountability on how they deliver outcomes, spurring more innovative and sustainable solutions Companies are not biased towards capital and carbon intensive solutions but have the flexibility to chose the best More flexible and sustainable use of water via incentives to trade water, while at the same time, ensuring that their use of water remains sustainable 19
20 Our overall framework 20
21 Delivering what matters customer engagement Enhanced customer engagement Customer challenge groups (CCGs) will challenge: Quality of companies customer engagement How well plans reflect customers views and priorities CCGs report to us when companies submit their plans Company Boards responsible for content, not the CCG Ofwat makes the final decision about what is acceptable, not the CCG 21

22 Delivering what matters outcomes Outcomes approach What makes a good outcome? Valued by customers or stakeholders for its own sake, not because it delivers something else Anglian Example 1 Customers delighted with service, water quality and value for money water only company Example 2 Reduce operational carbon, halve embodied carbon water and sewerage company Outcome delivery incentives Companies propose rewards or penalties, Ofwat decides what is acceptable 22
23 Delivering what matters outcome delivery incentives (1) Value based, but incentives are not one size fits all Financial and non-financial incentives Incentive rewards as well as penalties for non-delivery In certain circumstances, trade-offs between performance against different outcomes Roles Companies propose outcome commitments and delivery incentives CCGs challenge companies and provide assessment to Ofwat Ofwat makes final assessment as part of risk-based challenge 23
 We")


24 Delivering what matters outcome delivery incentives (2) We expect companies to: Explain clearly their proposals on incentives Show how their proposals will benefit customers Show why their proposed incentives deliver value for money for customers 24


25 Defining retail and wholesale controls (1) Four controls Retail household, retail non-household Wholesale water, wholesale wastewater Incentives with controls Wales) Household SIM, average cost to serve Non-household default tariffs (differences in Wholesale outcome delivery, totex and menus 25

26 Defining retail and wholesale controls (2) All regulated activities not in retail are in wholesale 26
27 Setting wholesale controls (1) Focusing on delivery Water Wholesale controls Enhanced customer engagement Outcomes approach Wastewater Separate controls for water and wastewater Includes revenue from wholesale charges (incl. charges for large users) and connections Securing value for money Outcome delivery incentives Menu-based cost performance incentives Totex cost assessment Totex cost recovery Totex costs assessment for determining efficiency Two totex menus, one for water, one for wastewater Companies propose their split between pay as you go and added to RCV 27
28 Setting wholesale controls (2) Totex cost assessment Menu-based cost performance incentives Costs an efficient company needs to run its operations Costs a company can recover dependent on how efficient they are Today s approach is complex and gives different incentive rates to capex and opex Menus create more room for outperformance to encourage new forms of efficiency Totex cost recovery Costs a company can recover in one period versus another We need this to support our financing duty and to balance today s and tomorrow s customers 28

29 Setting wholesale controls (3) We propose to set a baseline for efficiency using a triangulation approach 29


30 Setting wholesale controls totex cost recovery Companies choose a fixed split between PAYG and addition to RCV This can vary from company to company and between water and wastewater Return on capital derived in real terms and assuming notional gearing Post-2015 depreciation using fixed run off rate Tax calculated using actual gearing rather than notional 30
31 Assessing performance during Legacy tool Purpose Service incentive mechanism (SIM) Revenue correction mechanism (RCM) Opex incentive allowance Capital expenditure incentive scheme (CIS) Incentive to reward good customer service performance To deal with differences between actual revenue and our assumptions at the 2009 price review Balancing incentive for savings in operating expenditure, designed to counter effect of five-year price controls Incentive for capital expenditure, designed to reward both cost out-performance and accurate business plans Change protocol Tools to deal with material changes for 2009 assumptions (logging up, logging down, shortfalls) 31

32 Delivering price controls in
33 Delivering price controls developing business plans (1) A four-stage process for our initial risk-based assessment of companies business plans: Assess outcome commitments and proposed outcome delivery incentives Assess proposed costs associated with these commitments Assess companies approach to risk and reward based on our methodology statement Assess companies associated plans for financeability 33

34 Delivering price controls developing business plans (2) Example criteria for assessing the plan could include the following Has CCG made a positive assessment of how customers preferences have informed the plan? Do the outcomes and delivery incentives meet the requirements in the methodology statement? Is the overall ambition consistent with the company s track record of delivery? Is the company s approach to cost recovery, including its PAYG ratio within reasonable bounds? Do the company s plans meet financeability tests? 34

35 Delivering price controls developing determinations in 2014 We acknowledge the challenges in the timetable But short timescales necessary to: Deliver improvements to our price setting process stakeholders have asked for Develop robust baselines for menus to incentivise companies to reveal efficient costs, and properly informed by dialogue with the CCG 35
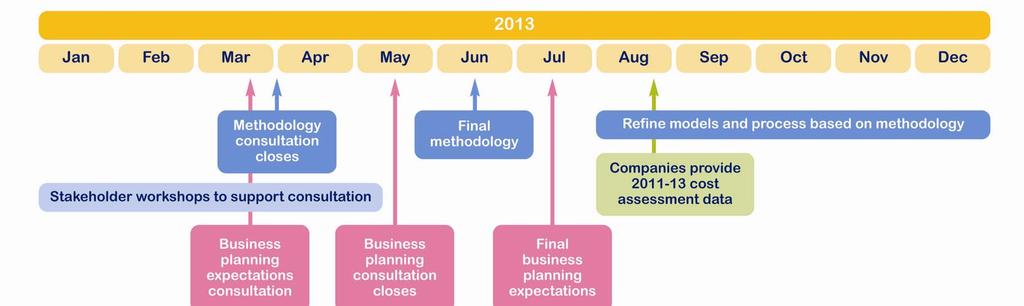
 March Business planning consultation March Direct engagement by the Ofwat Board during 2013 Final methodology June Business plan expectations July Data request to")
36 Delivering price controls in 2013 One-to-one meetings with stakeholders February and March Retail workshop (average cost to serve, default tariffs, form of control) March Wholesale workshop (menus, totex, targeted incentives) March Business planning consultation March Direct engagement by the Ofwat Board during 2013 Final methodology June Business plan expectations July Data request to companies August/September 36