Benchmark Company, LLC One-on-One Investor Conference. May 30, 2013
|
|
|
- Bathsheba Bradford
- 5 years ago
- Views:
Transcription
1 Benchmark Company, LLC One-on-One Investor Conference May 30, 2013
2 Safe Harbor Summary Except for historical information contained herein, the statements in this presentation are forward-looking and made pursuant to the safe harbor provisions of the Private Securities Litigation Reform Act of Forward-looking statements made herein, which include statements regarding the Company s future growth prospects, the Company s expectations regarding the pace of customer growth, and the Company s expectations regarding improved operating results, involve known and unknown risks and uncertainties, which may cause the Company s actual results in current or future periods to differ materially from those anticipated or projected herein. Those risks and uncertainties include, among other things, significant competition in the Company s industry; unfavorable publicity or consumer perception of the Company s products on the Internet; the incurrence of material product liability and product recall costs; costs of compliance and the Company s failure to comply with government regulations; inability to defend intellectual property claims; the Company s failure to keep pace with the demands of customers for new products; the current global economic climate; disruptions in the Company s information technology systems, and the lack of long-term experience with human consumption of some of the Company s products with innovative ingredients. Those and other risks are more fully described in the Company s filings with the Securities and Exchange Commission, including the Company s Form 10-K for the full year ended December 31, 2012 and in the Company's subsequent filings with the Securities and Exchange Commission made prior to or after the date hereof. 2
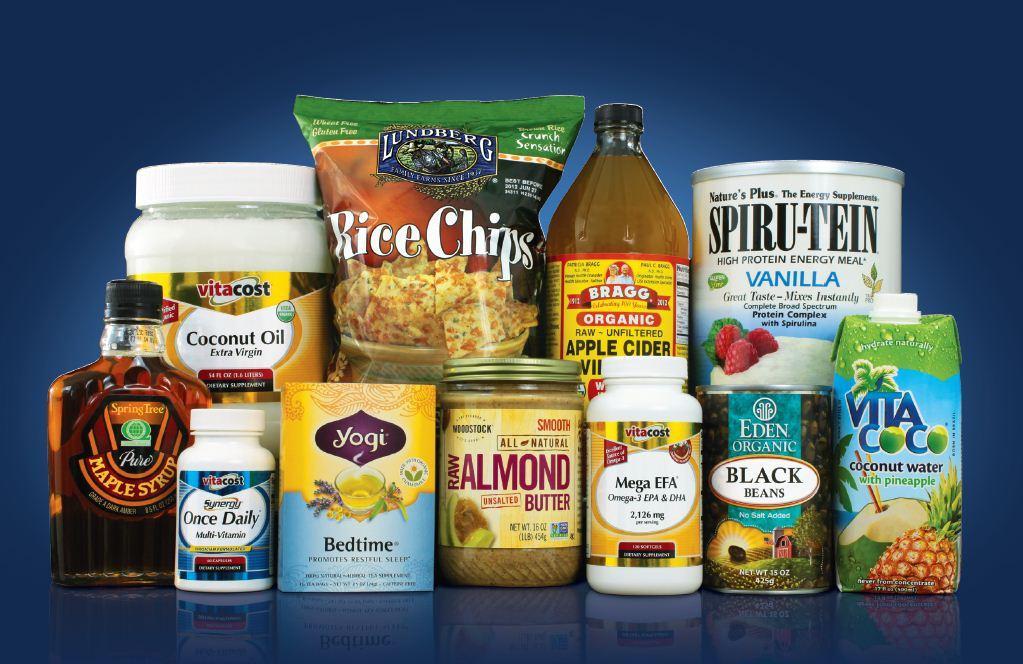
3 Vitacost.com Leading Online Distributor of ~ 40,000 Healthy Living Products Company Founded in 1994 $344.8M in Revenue (TTM 1Q13) 2.1M Active Customers (1Q13) 5.0M Orders Shipped (TTM 1Q13) Product Revenue Split 78%/22% Third-Party vs. Proprietary (TTM 1Q13) 3
4 Market Leader Revenue $ in mil Up 17% y/y Q13 Active Customer Base # in mil Up 25% y/y Q13 vitacost.com Amazon 4
5 Management Team Officer Jeffrey J. Horowitz CEO & Director Started August 2010 Brian Helman CFO Started February 2012 David Zucker, Ph.D. CMO Started August 2011 Jay Topper CIO/CTO Started August 2012 Significant Industry Experience Experience Industry Pioneer - Founder and CEO of Vitamin Shoppe from 1977 to 2004 CFO of Rosetta Stone CMO of Gilt Group CIO of Rosetta Stone 5


6 Strong Value Proposition To Customers Everyday Low Prices Superior Customer Experience Broad Product Selection 6
7 Everyday Low Prices VMHS Products $200 $189 $175 $150 $164 $155 $136 $125 $100 Vitamin Shoppe Amazon vitacost.com Vitacost Brand * Prices as of 5/20/13 - Basket of top 10 VMHS SKUs selected based on product overlap for all competitors 7


8 Broad Selection - Popular Brands VMHS ~17K SKUs Sports Nutrition ~3K SKUs Beauty ~7K SKUs Natural / Organic Food ~7K SKUs Other ~7K SKUs 8
 Only Large Health and Wellness E-retailer to Earn Google Trusted Store Badge Fully Staffed Customer Service Center")
9 Superior Customer Experience Intense Focus on the Customer Rich Product Content Ranked #3 out of Top 100 E-Retailers in Customer Satisfaction ForeSee E-Retail Satisfaction Index (US Holiday Edition 2012) Only Large Health and Wellness E-retailer to Earn Google Trusted Store Badge Fully Staffed Customer Service Center 9
10 Attractive Industry Dynamics Health and Wellness Mega Trend Increasing Consumer Awareness Favorable Demographics Rising Healthcare Costs 10
11 Total US Supplements $30B $ in Billions US Supplements All Channels E 2013E 2014E 2015E 2016E 2017E $ in Billions US Supplements Online Channel E 2013E 2014E 2015E 2016E 2017E Source: NBJ 2012 Direct-to-Consumer Selling in the Nutrition Industry Report 11
12 Total US Nutrition - $126B $ in Billions US Nutrition All Channels E 2013E 2014E 2015E 2016E 2017E $ in Billions US Nutrition Online Channel E 2013E 2014E 2015E 2016E 2017E Source: NBJ 2012 Direct-to-Consumer Selling in the Nutrition Industry Report 12


13 Total US Nutrition - $126B ($ Billions) Functional Foods $41.1 Natural & Organic Foods $43.1 Natural & Organic Personal Care, Household Goods $11.7 Supplements $30.0 Source: NBJ 2012 Direct-to-Consumer Selling in the Nutrition Industry Report 13


14 Unique Competitive Position Price Value Expensive LuckyVitamin.com i-herb.com Narrow *Comparison based on estimated SKUs that overlap VITC s product mix Selection / Product Offering Broad 14
15 Growth Drivers Expand Customer Base Expand Product Offerings into Faster Growing Non-VMHS Categories Accelerate Proprietary Product Growth Increase Brand & Company Awareness Sales Initiatives Mobile, International 15
16 New Customer Growth # in 000s Q10 3Q10 4Q10 1Q11 2Q11 3Q11 4Q11 1Q12 2Q12 3Q12 4Q12 1Q13 Vitacost.com Amazon 16
17 Attractive Customer Economics 1,200,000 Number of Orders on vitacost.com from Repeat Customers 1,000, , ,000 Up > 80% in 3 years! 400, ,000-1Q10 2Q10 3Q10 4Q10 1Q11 2Q11 3Q11 4Q11 1Q12 2Q12 3Q12 4Q12 1Q13 17


18 Much More Than a Vitamin Company! 32% Product Mix as a Percentage of Sales vitacost.com 1Q12 Non-VMHS Up 44% y/y! 38% 1Q13 VMHS Up 12% y/y 68% 62% 48% VMHS Non-VMHS Product Mix as a Percentage of Units Sold vitacost.com 1Q12 52% Non-VMHS Up 49% y/y! 55% VMHS 1Q13 Non-VMHS 45% VMHS Up 11% y/y VMHS Non-VMHS VMHS Non-VMHS 18

19 Proprietary Products The Vitacost Brand High Quality Products at Low Prices TTM Revenue of $74M 21% of 1Q13 Total Product Revenue 19% y/y Growth in 2012 and 8% y/y Growth in 1Q13 91% of Proprietary is VMHS 968 SKUs as of 1Q13 19
20 Proprietary Products Strong 2013 Pipeline Launched 176 New Products in 2012 and Launching Over 176 in 2013 Launched 15 in 1Q13 Including 3 Additional SKUs for Whole Food Dietary Supplement Line Accelerated Pace of New Product Launches in 2Q, 3Q and 4Q13 Expanding Proprietary into New Categories Such as Beauty and Food to Complement the Core Vitacost Nutraceuticals Brand Launched New ARO Sports Nutrition Line in May 20

21 Proprietary Products ARO Launch Launched New ARO: Black Series in May ARO: Attack, Recover, and Optimize Proprietary Sports Nutrition Line of Pre-workout Formulas, Protein Powder, Creatine, BCAAs, Glutamine and Other Supplements Line Launched with 27 SKUs with Additional Products to be Added Throughout the Year Including a Lean Line of Diet Shakes 21


22 Mobile Initiatives 4Q11 - Relaunched Mobile Site and Introduced Vitacost Apps 1Q12 Launched New Features for Mobile Site 2Q12 Launched New Features for Apps 1Q13 Mobile Orders up 41% Sequentially 2Q13 Launched New Platform for I-pad iphone App ipad 22

23 International Opportunity Vitacost.com Significant Long-term Opportunity Currently Ship to >60 Countries Largest Presence in China, Australia, Brazil, and Canada 23
24 Financial Goals Target Long-Term Operating Model Revenue 15-20% growth % of Revenue Gross Margin 22-25% Fulfillment 6-8% Sales & Marketing 6-8% G&A 5-7% Add back: D&A 1-2% *Adj. EBITDA Margin 6-10% Improving Operating Efficiency Maximize Gross Profit Dollars Drive Improvement in Fulfillment Cost Per Order Gain Efficiency in CAC Spending Generate Leverage in Fixed Costs Investing for Growth Technology Personnel Marketing *Adjusted EBITDA excludes depreciation, amortization, stock-based compensation and certain other expenses 24
25 Financial Performance $ in MM Quarterly Revenue & Gross Profit* 31% 21% 30% 26% % % 35% 31% 23% 18% Q-12 2Q-12 3Q-12 4Q12 1Q13 vitacost.com Sales Up 22% y/y Sales Gross Profit Adjusted EBITDA* 1Q-12 2Q-12 3Q-12 4Q12 1Q13 (1.0) (3.0) (4.0) (5.0) *Results exclude certain charges and expenses (2.2) (3.1) (1.0) (0.4) Significant Improvement Generating Efficiencies Across the Business 25
26 E-Commerce Metrics (# in 000s) 1,600 Orders 1,404 Total $ vitacost.com AOV 1,400 1,200 1,295 Total $ ,000 $60.00 $70.94 $ ,091 1,280 $ $ Q12 1Q13 $0.00 1Q12 1Q13 Vitacost.com Amazon 26
27 Gaining Efficiency Marketing CAC (ex Amazon) Down 13% y/y in 1Q13 with a 9% y/y Increase in New vitacost.com Customers Continue to Invest in Marketing to Drive Customer Acquisition & Increase Retention Fully Allocate 100% of Expense to New Customers Recover Full Acquisition Cost on 2 nd Order Fulfillment Gained Efficiencies in Labor Productivity & Packaging 1Q13 Fulfillment Cost Per Order* Down 4% y/y & Down 14% from 4Q12 *Fulfillment cost excluding fees related to freight savings program 27
28 Strong Financial Position 1Q Cash and Cash Equivalents $30.0 $32.2 Inventory Property and Equipment Total Assets $113.4 $107.7 Accounts Payable Deferred Revenue Debt - - Total Liabilities $48.4 $41.0 Total Liabilities & Stockholders Equity $113.4 $107.7 *Adjusted Working Capital $34.2 $36.3 Inventory Turns 6.8x 7.6x *Adjusted working capital = (current assets current liabilities + deferred revenue) 28
29 Investment Summary Market Leader in Online Health & Wellness Products Positive Industry Dynamics Management Team Significant Industry Experience Executing on Growth Initiatives Improving Operating Efficiency and Leverage Investing in Technology, Personnel, and Marketing for Future Growth 29
30