Investor Presentation September 2015
|
|
|
- Juliana Perry
- 5 years ago
- Views:
Transcription
1 Investor Presentation September 2015
2 SAFE HARBOR This presentation includes forward-looking statements. Wayfair Inc. ( Wayfair or the Company ) has based these forward-looking statements largely on its current expectations and projections about future events and financial trends affecting its business. Forward-looking statements should not be read as guarantees of future performance or results, and will not necessarily be accurate indications of the times at, or by, which such performance or results will be achieved. Forward-looking statements are based on information available at the date of this presentation and management s good faith belief as of such date with respect to future events, and are subject to risks and uncertainties that could cause actual performance or results to differ materially from those expressed in or suggested by the forward-looking statements. Important factors that could cause such differences include, but are not limited to: our ability to acquire new customers, our ability to sustain and/or manage our growth, our ability to increase our net revenue per active customer, our ability to build and maintain strong brands and other factors discussed under Risk Factors and Management s Discussion and Analysis of Financial Condition and Results of Operations in periodic filings with the Securities and Exchange Commission (the SEC ). In addition, in this presentation, the words believe, may, will, estimate, continue, anticipate, intend, expect, predict, potential and similar expressions, as they relate to the Company, business and management, are intended to identify forward-looking statements. In light of these risks and uncertainties, the future events and circumstances discussed in this presentation may not occur, and actual results could differ materially from those anticipated or implied in the forward-looking statements. Forward-looking statements speak only as of the date of this presentation. You should not put undue reliance on any forward-looking statement. The Company assumes no obligation to update any forward-looking statements to reflect actual results, changes in assumptions or changes in other factors affecting future performance or results, except to the extent required by applicable laws. If the Company updates one or more forward-looking statements, no inference should be drawn that it will make additional updates with respect to those or other forwardlooking statements. 2

3 OUR MISSION To transform the way people shop for their homes 3


4 A CLEAR ONLINE LEADER IN HOME GOODS MASSIVE ONLINE CATALOG with over 7,000,000 home products SUPPLIER DIRECT FULFILLMENT NETWORK connecting over 7,000 suppliers $1,661 MILLION of LTM net revenue with minimal inventory 81% Q2 YoY GROWTH in direct retail, 66% total growth 4
5 LARGE SCALE WITH SIGNIFICANT GROWTH Founded as CSN STORES in 2002 BOOTSTRAPPED for the first 9 years FOUNDER-LED since inception REBRANDED AS WAYFAIR in % Q2 YoY DIRECT RETAIL GROWTH; 66% total LTM growth $1,319 $1,661 $916 $517 $ LTM 240+ Niche Websites Platform Development Direct Retail Other Brand Consolidation Brand Building 5


6 FIVE DISTINCT HOME BRANDS Typical customer: 35 to 65 year old woman with an annual household income of $60,000 to $175,000 Est Est Est Acq Est

7 LARGE, HIGHLY FRAGMENTED MARKET MOVING ONLINE Growth Potential of U.S. Home Goods Market Significant Upside in Online Penetration Total Furniture Sales by Retailer $ Online Penetration of Selected Verticals 100% $233 90% $233 80% 70% 54% 60% 50% 40% $90 30% $45 15%- 30% 15% 20% $16 7% 10% 7% 2013 ($B) 2023 Other Online Home Goods Apparel Consumer Electronics 0% Top Other Source: Euromonitor for market size, comscore for online statistics, emarketer for millennial statistics, Furniture Today ** Top 10 Retailers: Williams Sonoma, Ikea, Ashley s, Berkshire Hathaway Companies, Rooms to Go, Pier 1, Restoration Hardware, Mattress Firm, Raymour & Flanigan, La-Z-Boy **Millennials defined as individuals currently between the ages of 18 and 32. Based on 2013 data 7


8 WELL POSITIONED RELATIVE TO OTHER RETAILERS High End ($175K+) Design Centers Mass Market ($60K-$175K) Low End ($60K) 8


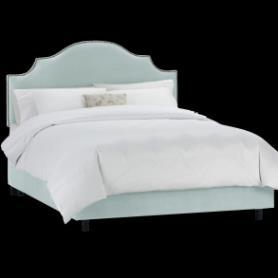
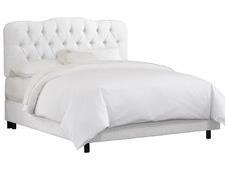
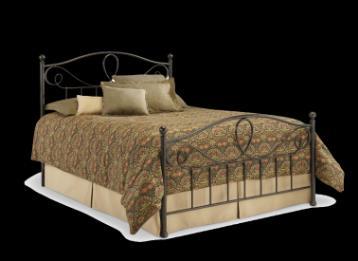


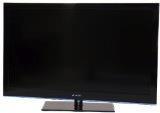

9 HOME SHOPPERS DESIRE UNIQUENESS We do not all sleep in the same style bed...but a lot of us own the same TV and view it as reassuring #1 in 42 LCD TVs #2 in 42 LCD TVs #3 in 42 LCD TVs #4 in 42 LCD TVs 9


10 HOME IS SHOPPED VISUALLY Inspiration Discovery & Education 10


11 HOME IS SHOPPED VISUALLY Search Based Site 11


12 DIFFICULT TO INVENTORY Home Category Example: Lighting CPG Category Example: Paper Towels INDUSTRY SIZE: $7B INDUSTRY SIZE: $7B Source: 2013 data from Freedonia, Fisher International, Euromonitor 12
13 REQUIRES CUSTOM-BUILT TECHNOLOGY AND OPERATIONAL PLATFORM Technology Platform Operational Platform Proprietary and purpose built Real-time data, dynamic changes Personalization Mobile optimized Running at massive scale 350+ engineers / data scientists Over 20 million orders since inception 2014 North America average time to ship of 2.2 days Extensive supplier integration and direct fulfillment network Proprietary transportation network Minimal inventory and capex 750+ customer service reps 13


14 PLATFORM SHIFT TO MOBILE AMPLIFIES OPPORTUNITY US ecommerce Mobile Sales ($B) 1 34 % Direct Retail orders via mobile in Q % Joss & Main orders via mobile in Q % CAGR $131 SIGNIFICANT OPPORTUNITY GOING FORWARD $ Source: emarketer as of Includes impact of smartphones and tablets. 2 Direct Retail orders generated primarily through the sites of our five brands. 14


15 INCREASING PERSONALIZATION DRIVES GROWTH AND REPEAT BEHAVIOR s from 12/2; Ability to send 1M+ variations Prep for in-laws and overnight guests with holiday furniture for every room Tikes top picks: Playroom furniture and toys by KidKraft Purrr-fectly affordable finds for cats (and feline fans) 15

16 TECHNOLOGY AND OPERATIONS ARE RUN AT SCALE: 1 DAY OF ORDERS 16
 224 47% 152 Enables Strategic Investment Fuels More Revenue Direct Retail Other Net Revenue $1,015 $875 ($M) 50% Total 65% $1,465 $1,442 LTM Q2'14 LTM Q2'15 $232 $219 LTM")
17 SCALE DRIVES POWERFUL NETWORKS EFFECTS Active Customers 1 Repeat Orders 2 (in thousands) (as % of total orders) 4,044 57% 2,635 54% More Customers More Repeat Purchases 52% Q Q Q Q Advertising Spend ($M) % 152 Enables Strategic Investment Fuels More Revenue Direct Retail Other Net Revenue $1,015 $875 ($M) 50% Total 65% $1,465 $1,442 LTM Q2'14 LTM Q2'15 $232 $219 LTM Q2'14 LTM Q2'15 1 Defined as customers who have purchased at least once on our brands sites during the preceding 12 month period. 2 Defined as total orders delivered from repeat customers. 17
18 INVESTMENT IN ADVERTISTING SPEND RESULTS IN HIGHER REVENUE/CUSTOMER Revenue/Customer/Month Wayfair.com Gross Revenue Per Customer Over Time 20x$ 16x$ Customers acquired in more recent periods consistently spend more over time than customers acquired in older periods 12x$ For example in the 6th month post their initial order 2014 customers spent >2x 2011 customers 8x$ 4x$ x$ Time Since Initial Purchase 18


19 AND GROWING AWARENESS Google Trends Interest in Wayfair over time Grew to 62% brand awareness since Wayfair launch in Source: Hanover Research 1 Aided Brand Awareness as of April
20 CUSTOMER ECONOMICS CONTINUE TO IMPROVE % 51.6% 47.3% 48.0% 47.1% 46.8% 41.1% 40.2% 35.2% 30.7% $332 $322 $323 $313 $315 $300 $305 $287 $273 $ % 49.8% 50.3% $342 $342 $ % $357 Q1 2012Q2 2012Q3 2012Q4 2012Q1 2013Q2 2013Q3 2013Q4 2013Q1 2014Q2 2014Q3 2014Q4 2014Q1 2015Q Net Revenue / Active Customer % Orders from Repeat Customers Active Customers (mil) 20
21 CAPITAL EFFICIENT WITH MINIMAL INVENTORY Minimal Inventory Capital Efficient 1 $1, $1,319 $916 $15 $20 $ LTM ($M) Net Revenue Inventory 1.4 Days Receivable Days Payable FCF Performance Consistently Better than Adjusted EBITDA 1 Average of last four quarters. 21
22 Primarily headcount LONG TERM TARGET MODEL Q Long-Term Target Net Revenue 100% 100% 100% 100% Gross Margin 24.5% 23.6% 24.6% 25-27% Customer Service + Merchant Fees 3.9% 4.1% 3.7% 4% Advertising 11.8% 14.5% 12.5% 6-8% Merchandising, Marketing, and Sales 3.7% 3.9% 4.2% 2-3% Operations, Technology, General & Administrative 5.4% 5.9% 5.2% 3-4% Total Operating Expenses 24.8% 28.4% 27.1% 15-19% Adjusted EBITDA (0.3%) (4.7%) (1.0%) 8-10% Note: Merchandising, Marketing, and Operations, Technology, General & Administrative have been adjusted to exclude equity based compensation expenses and depreciation and amortization expense. See GAAP to Non-GAAP Reconciliation Appendix. 22

23 WELL DEFINED GROWTH STRATEGY CONTINUE BUILDING LEADING RETAIL HOME BRANDS Acquire More Customers Invest in Consumer Experience Increase Repeat Purchasing Add New Suppliers Invest in Technology and Operations ADDITIONAL GROWTH STRATEGIES Expand Internationally Pursue Strategic Acquisitions Opportunistically Launch New Brands 23
24
25 RECONCILIATION OF ADJUSTED EBITDA ($ in millions) Q Net Loss ($15.526) ($ ) ($19.334) Depreciation and Amortization $ $ $7.400 Equity-Based Compensation - $ $7.101 Interest Income, net ($0.245) ($0.350) ($0.308) Other (Expense) Income, net ($0.294) $0.489 $0.096 Taxes $0.046 $0.175 $0.073 Adjusted EBITDA ($2.928) ($62.537) ($4.972) 25
26 RECONCILIATION OF FREE CASH FLOW ($ in millions) Q Net Cash Provided by Operating Activities, Net of Acquisition $ $ $ Purchase of Property, Equipment and Leasehold Improvements ($6.739) ($39.422) ($13.153) Site and Software Development Costs ($9.040) ($14.130) ($4.311) Free Cash Flow $ ($41.860) $
27 Illustrative Customer Acquisition Cost (All units in 000s, except per customer figures) 2014 Total Advertising Spend $191,284 Assumed Partner Ad Spend (1) $24,300 Direct Retail Ad Spend $166,984 Active Customers 3,217 Total Orders 5,237 % of Orders from Repeat Customers 50.5% Implied "Gross" New Customers (2) 2,590 Customer Acquisition Cost (3) $64 Annual Direct Retail Revenue per Customer $342 Annual Contribution per Customer (4) $67 Contribution Margin 19.5% Notes: 1. Assumes partner advertising spend is 11.18% of Other revenue as seen in the first six months of 2014 (as disclosed in our S-1). 2. Calculated as (1-Repeat Rate)*Total Orders. 3. Calculated as Direct Retail Ad Spend divided by Implied Gross New Customers. 4. Represents 2014 gross margin of 23.6% less an assumed 4.1% for customer service and processing fees. 27