Level 1 Economics, 2017
|
|
|
- Pearl Sparks
- 5 years ago
- Views:
Transcription
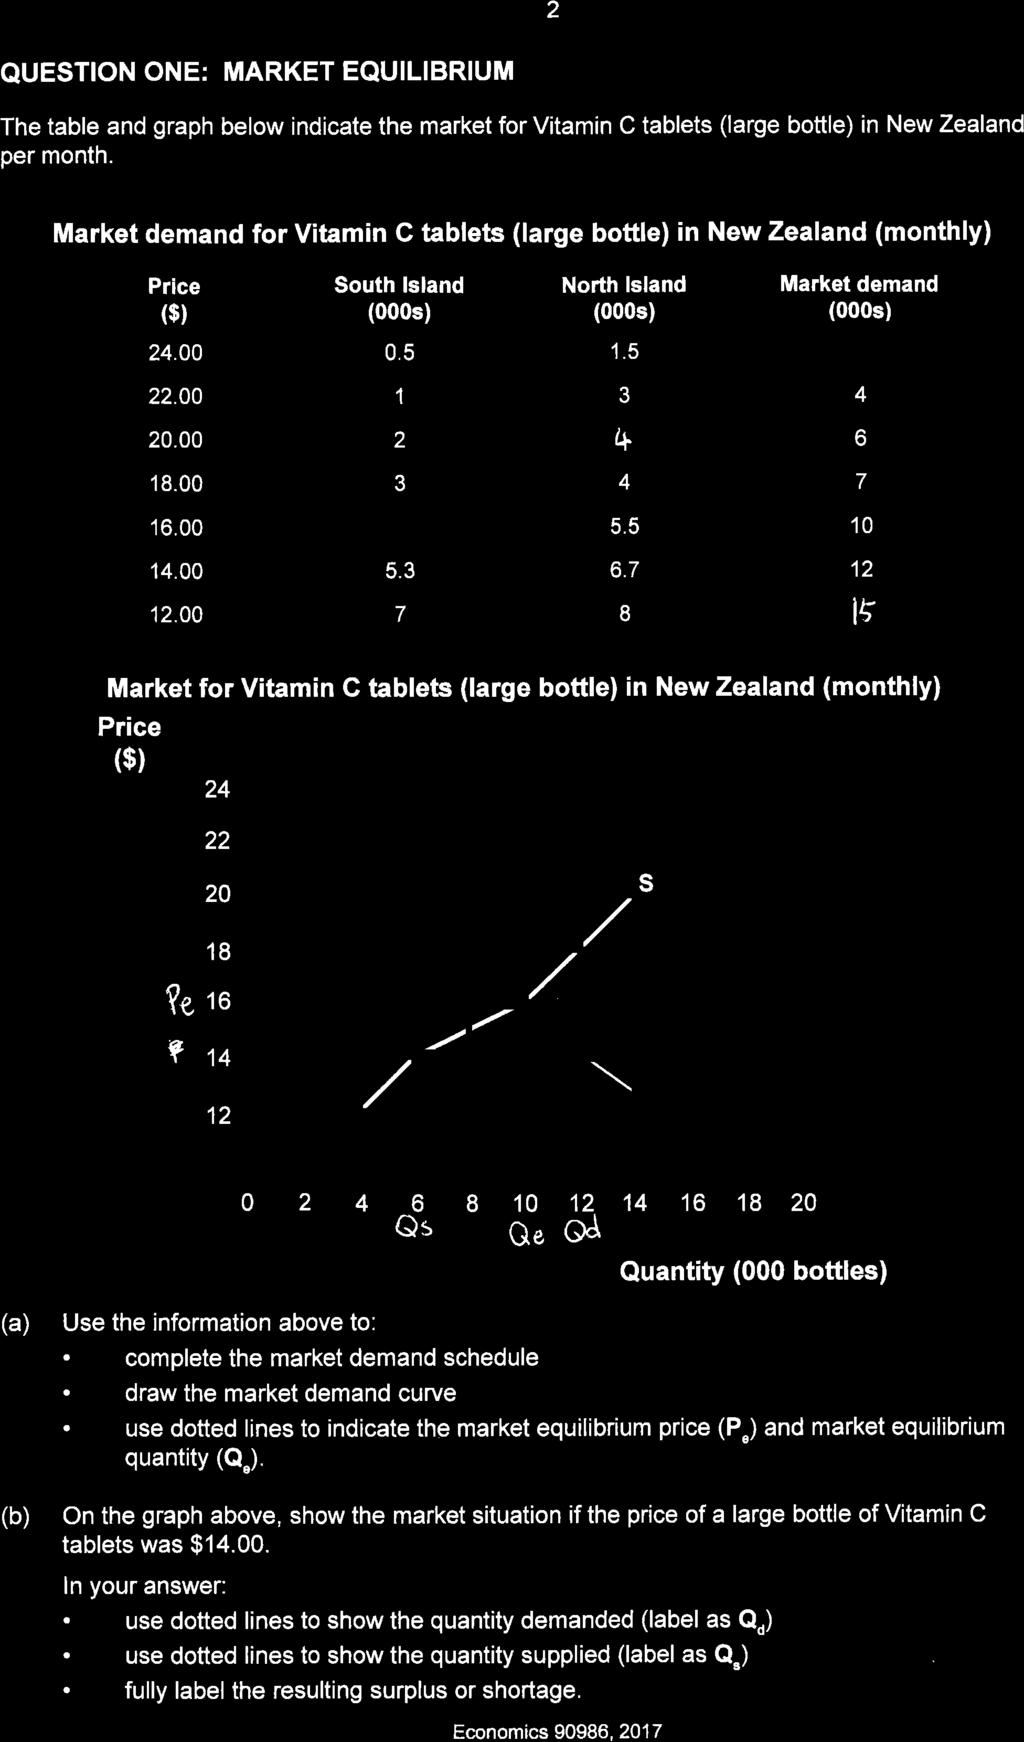
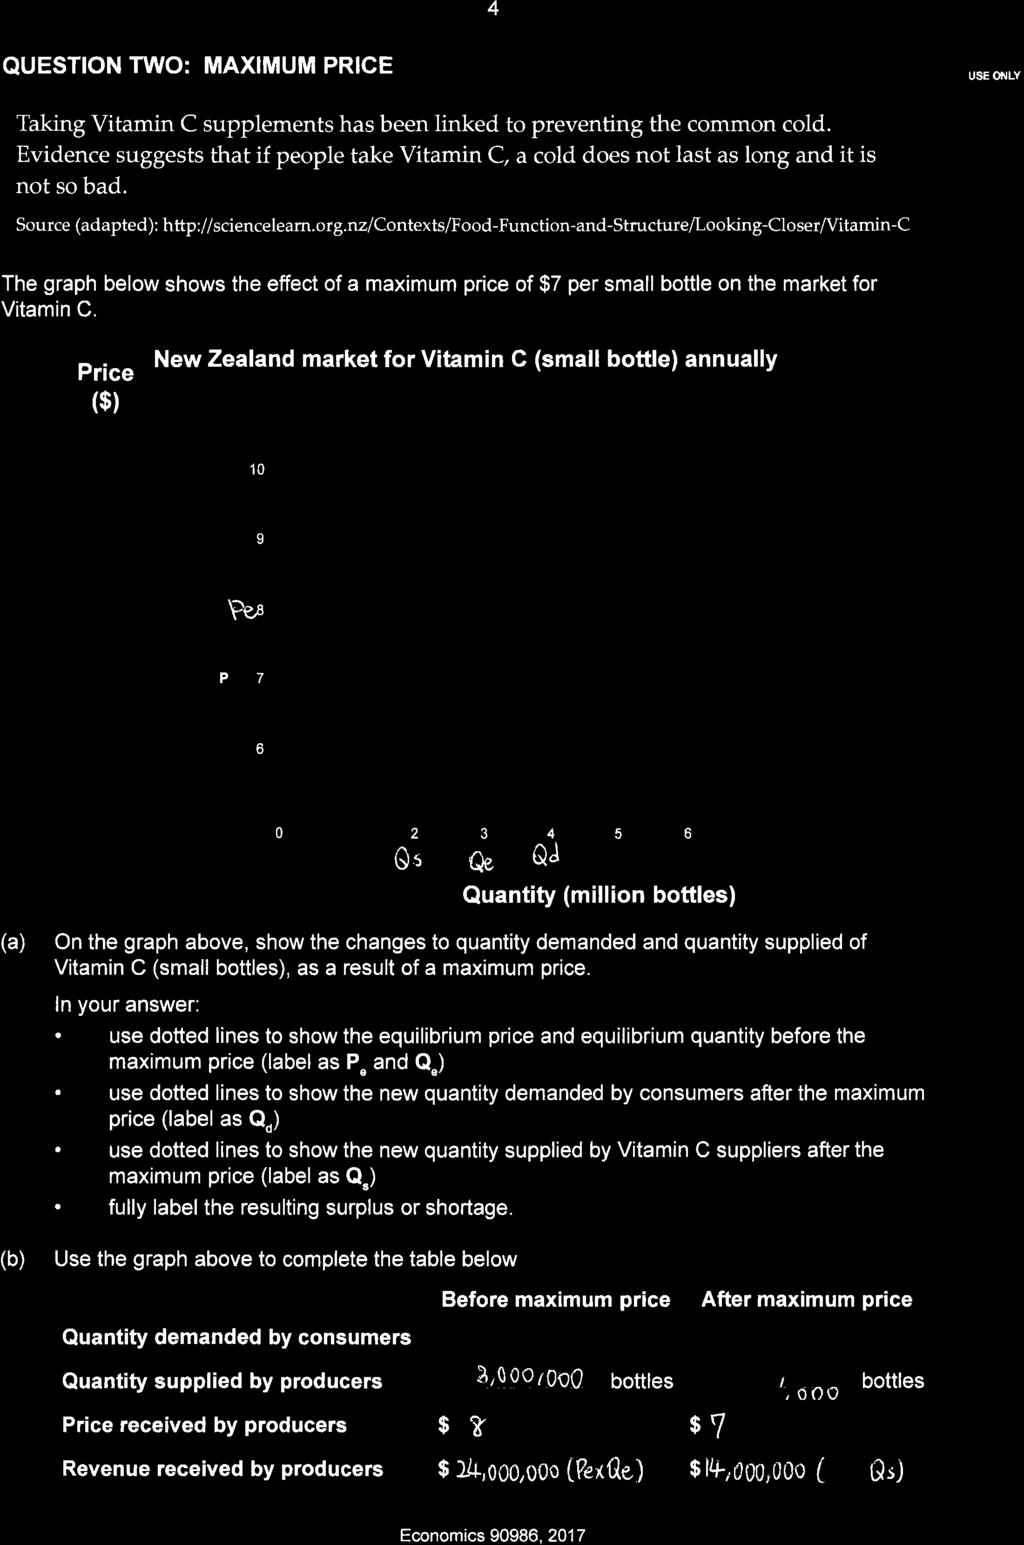
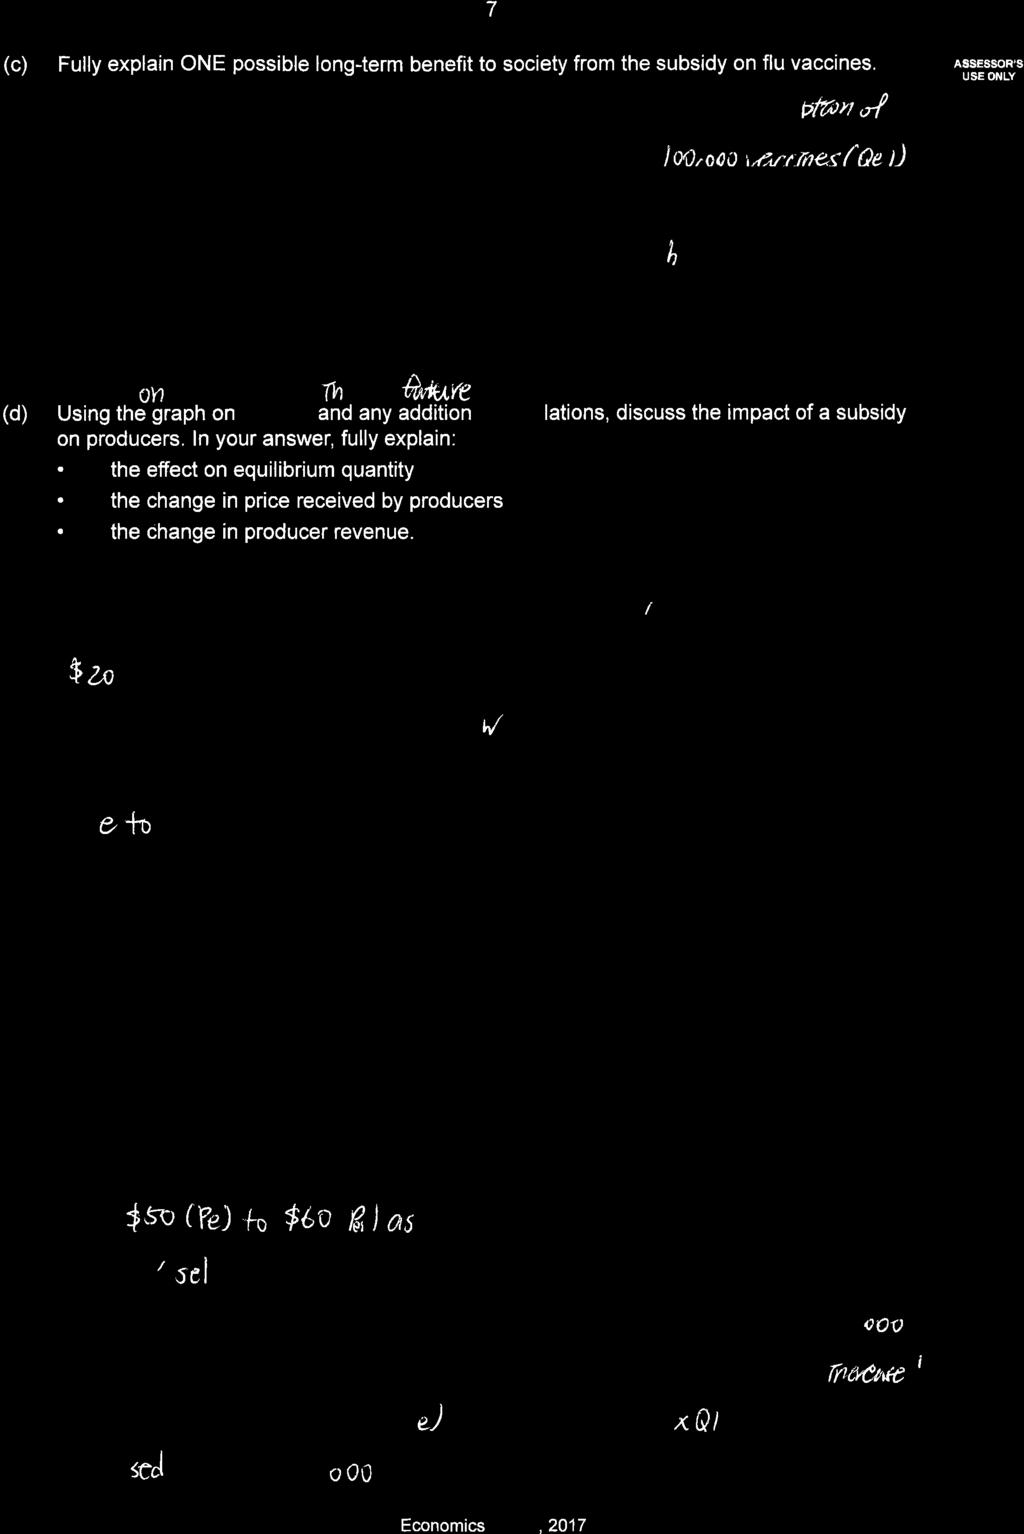
1 SUPERVISOR S USE ONLY Level 1 Economics, Demonstrate understanding of how consumer, producer and / or government choices affect society, using market equilibrium 9.30 a.m. Friday 10 November 2017 Credits: Five Achievement Achievement with Merit Achievement with Excellence Demonstrate understanding of how consumer, producer and / or government choices affect society, using market equilibrium. Demonstrate in-depth understanding of how consumer, producer and / or government choices affect society, using market equilibrium. Demonstrate comprehensive understanding of how consumer, producer and / or government choices affect society, using market equilibrium. Check that the National Student Number (NSN) on your admission slip is the same as the number at the top of this page. You should attempt ALL questions in this booklet. If you need more room for any answer, use the extra space provided at the back of this booklet. Check that this booklet has pages 2 8 in the correct order and that none of these pages is blank. YOU MUST HAND THIS BOOKLET TO THE SUPERVISOR AT THE END OF THE EXAMINATION. Excellence TOTAL 24 ASSESSOR S USE ONLY New Zealand Qualifications Authority, All rights reserved. No part of this publication may be reproduced by any means without the prior permission of the New Zealand Qualifications Authority.
2

3
4
5

6

7
8 Excellence exemplar 2017 Subject: Economics Standard: Total score: 24 Q Grade score Annotation 1 E8 2 E8 3 E8 Although not required for E, this candidate has correctly completed the graph and table. Candidate correctly identifies a shortage using correct data (6000), and explains what a shortage is (QD > QS). Candidate then explains that the Consumer bids the price up in order to obtain the vitamin C. The laws of demand and supply are correctly applied to this situation, with the use of ceteris paribus and reasons (affordability and profitability). Then the candidate correctly explains at what point equilibrium is established ($16 and bottles). Although not required for E, this candidate has correctly completed the graph, including drawing and labelling the shortage correctly. Candidate has correctly calculated all figures in (b). Candidate then explains a maximum price, using correct figures ($8 to $7) and explains (further down the page) how it is legally required to adhere to this price maximum. Candidate then explains that the decrease in price is related to the increase in quantity demanded, using correct figures (3m to 4m) and that this is more affordable for consumers. Candidate then explains the consumer spending has decreased, using correct figures and that this is due to the decrease in quantity supplied, which creates a shortage. Two flow on effects that then been correctly explained in this case, the candidate mentioned a decline in society s health and the introduction of a black market. Although not required for E, this candidate has correctly completed the graph, with appropriate labelling and shifting the supply curve to the right. Also, not required for E, this candidate correctly explains the immediate financial effect on the government of having to spend $2 million on subsidising the flu vaccine. Then a long-term benefit to society is explained that since the vaccine has been subsidised, more people will utilise the vaccine and thus, general health would improve and money that would have been spent on healthcare could now be redistributed. In (d) this candidate then correctly connects the increase in supply (shown as a shift to the right, S to S1 (referring to the graph)), to the quantity demanded increasing ( to ie: with data). The candidate then explains how the price received by producers has increased using data ($50 to $60), and links this to the increase in producer revenue through referring to the graph (Pe x Qe) v (Pp x Qe1) and data ($ to $ ).