SCARCITY: THREE BASIC QUESTIONS
|
|
|
- Julian Dawson
- 5 years ago
- Views:
Transcription
1
2 ECONOMIC SYSTEMS
3 SCARCITY: THREE BASIC QUESTIONS All societies experience scarcity which requires them to make choices, so they must answer three fundamental questions: 1. WHAT to produce? E.g., food, housing, military equipment, public schools, green space, etc.? 2. HOW to produce? E.g., more automation and fewer workers? Fewer machines and more workers? 3. FOR WHOM to produce? E.g., low-income, multi-family housing or single-family housing for wealthy citizens?
4 HANDY DANDY GUIDE TO ECONOMIC REASONING 1. People choose. 2. People s choices involve costs. 3. People respond to incentives (motivations) in predictable ways. 4. People create economic systems (rules) that influence individual choices and incentives. 5. People gain when they trade voluntarily. 6. People s choices have consequences (results) that lie in the future.
5 ECONOMIC SYSTEMS SPEED DATING Today you will become an expert on one economic system. When you finish the research round, you will rotate to other groups to teach them about the system you studied.
6 ECONOMIC SYSTEMS SPEED DATING: RESEARCH PHASE (15 MINUTES) 1. Silently read page 33 and the additional pages (34-41) that describe your assigned economic system. 2. Silently read about the seven economic and social goals on pages that are held by most countries around the world. 3. Fill in the graphic organizer in Step 1 for your assigned economic system. 4. Talk in your group about the definition and characteristics of your assigned economic system to ensure that everyone understands it well enough to teach it to others.
7 ECONOMIC SYSTEMS SPEED DATING: GET-TO-KNOW-YOU PHASE (~12 MINUTES) 1. People on the outside of each group will remain seated. 2. People on the inside will rotate one group counter-clockwise. 3. When you sit down at a new group, introduce yourself to the person across from you. 4. The host group (those on the outside) will tell the visitors about the system that they studied; the visitors will silently take notes on their graphic organizer. Visitors may ask questions when the hosts are done. 5. Now the visitor tells the host about their system while the host listens silently and takes notes. Questions at the end.
8 ECONOMIC SYSTEMS SPEED DATING: BACKGROUND-CHECK PHASE 1. Now we will drop traditional economies from our focus. 2. For Step 3, each group will research one of the four characteristics of free enterprise capitalism and make a poster that contains the following (20 min.; pages 49-50): a. Name of the characteristic b. Description of characteristic c. What it looks like in our economy d. How it is valued in other economic systems
9 ECONOMIC SYSTEMS SPEED DATING: WHAT DO THEY VALUE? Step 4: Evaluate how command, market and mixed economies meet the social and economic goals of: freedom, security, growth, equity, and efficiency. See pages and complete step 4 of graphic organizer.
10
11
12
13
14 CETERIS PARIBUS Means other things being equal. In economics, when you are working on a problem we must assume that only the variables mentioned in the problem will change. All others remain the same. This will be relevant when we consider Production Possibilities Curves
15 Trade-offs vs. Opportunity Cost ALL decisions involve trade-offs. Trade-offs - ALL the alternatives that we give up when we make a choice. Opportunity cost- most desirable (2nd best) alternative given up when you make a choice. What are trade-offs of deciding to go to college? What is the opportunity cost of going to college? 15
16 What decisions did you make yesterday? To snooze or not to snooze? Breakfast at home or fast food or none at all? Buy or bring a lunch? Who to sit with at lunch? Study or hang out with friends after school? Go to bed on time or watch Netflix? Why do you have to choose to do some things and not 16 others?
17 Economics of College 17

18 Practice Qs + Practice Sheet 2008 Audit Exam 18

19 2008 Audit Exam ACDC Leadership
20
21 Marginal Analysis In economics marginal = additional Thinking on the margin, or MARGINAL ANALYSIS involves making decisions based on the additional benefit vs. the additional cost. It is a rational economic decision to do something as long as your marginal benefit is greater than or equal to your marginal cost. Eg: studying vs. sleeping.
22 You will continue to do something until the marginal cost outweighs the marginal benefit.
23 Practice Problems on sheet...
24 Thinking at the Margin # Times Watching Movie Benefit Cost 1st 2nd 3rd Total $30 $15 $5 $50 $10 $10 $10 $30 Would you see the movie three times? Notice that the total benefit is more than the total cost after you watch the movie the 2nd time, but you would NOT watch the movie the 3rd time because the cost outweighs the benefit.
25 Given the following assumptions, make a rational choice in your own self-interest (hold everything else constant) 1. You want to visit your friend for a week. You will return Sunday night. 2. You work every weekday earning $100 per day. 3. You have three flights to choose from: Thursday Night Flight = $275 Friday Early Morning Flight = $300 Friday Night Flight = $325 Which flight should you choose? Why? 25 25

26 Change N/A $54 $33 $15 $10 $5
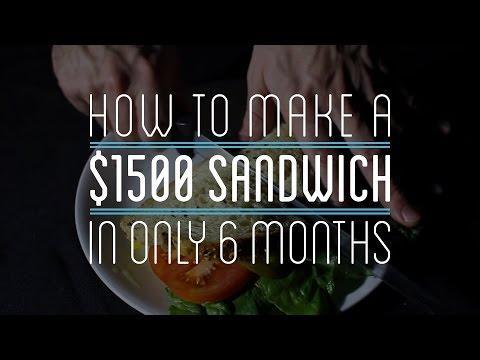
27 Let s Make that Chicken Sandwich
28
29 Write a paragraph about the guy who took six months and spent $1500 to make his own chicken sandwich from scratch. You should analyze his actions and include the concepts of opportunity cost and specialization in your response.
30 The 4 Factors of Production 30

31 Want to Start a Cookie Business? 1. What tools will you need? 2. What skills do your workers they need? 3. What does the owner need to do? THESE ARE YOUR FACTORS OF PRODUCTION!!! 31
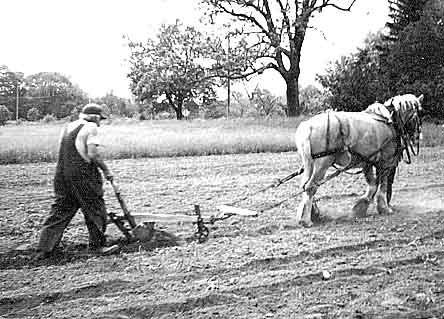
32 The Four Factors of Production ALL resources can be classified as one of the following four factors of production: 1. Land -All natural resources that are used to produce goods and services. (Ex: water, sun, plants, animals, minerals) 2. Labor -Any physical or mental effort a person devotes to a task. (Ex: manual laborers, doctors, teachers, waiters, etc.) Human Capital- Any skills or knowledge gained by a worker through education and experience. 3. Capital - Any human-made resource that is used to create other goods and services. (Ex: tools, tractors, machinery, buildings, factories, etc. AKA capital goods) 32

33 The Four Factors of Production 4. Entrepreneurship - People who assemble the other factors of production to create goods and services. Examples-Henry Ford, Bill Gates, your cousin who started her own catering business, etc. Entrepreneurs: 1. Take The Initiative 2. Innovate 3. Act as the Risk Bearers 4. Assemble necessary FoP So they can obtain. PROFIT Profit = Revenue - Costs 33

34
35
36
37

38 Hans Gosling Video...

39 Are you PRODUCTIVE? 1. What does a productive school day look like? 2. What increases your productivity? 3. What decreases your productivity? 4. In most cases, what is the relationship between your productivity and your income? Why? 39
40 Productivity Productivity = A measure of efficiency that shows the number of outputs per unit of input. Ex: Bob can make 10 pizzas in 1 hour. Stan can make 5 pizzas in 1 hour. Bob is more productive. Why do businesses and countries want to improve their productivity? Since all resources are scarce, improving productivity allows us to produce more stuff with fewer (or the same number of) resources. 40

41
42
43 2012 AP Exam 43
44 Productive vs. Allocative Efficiency Productive efficiency is concerned with the optimal method of producing goods; producing goods at the lowest cost. Allocative efficiency is concerned with the optimal distribution of goods, services and resources.
45 The Production Possibilities Curve (PPC) Using Economic Models Step 1: Explain concept in words Step 2: Use numbers as examples Step 3: Generate graphs from numbers Step 4: Make generalizations using graph
46 What is the Production Possibilities Curve? A production possibilities curve (or frontier) is a model that shows alternative ways that an economy can use its scarce resources. This model graphically demonstrates scarcity, trade-offs, opportunity costs, and efficiency. 4 Key Assumptions Only two goods can be produced Full employment of resources Fixed Resources (Ceteris Paribus) Fixed Technology 46
47 Let s make our own PPF
48 French Friday, August 24 Montreal Monday, August Explain relationship between scarcity and choices. Differentiate between positive & normative. Differentiate between price and cost.** Differentiate between consumer and capital goods.** Differentiate btw command economies and free market economies. Give examples of each of the 4 Factors of Production. Define human capital. Define tradeoffs. Define opportunity cost. Name 10 different teachers at this school. **Make your best guess. 48
49 French Friday, August 24 Montreal Monday, August 27 Plan on a test toward the end of next week. Learning targets: I can explain and calculate opportunity cost from a PPC and a production possibilities table. I can describe what factors can cause economic growth as reflected in an outward shift of a PPC. I can explain the benefits of specialization and gains from trade.
50
51 Production Possibilities Table Bikes Computers A 14 0 B 12 2 C 9 4 D 5 6 E 0 8 f 0 10 Each point represents a specific combination of goods that can be produced given full employment of resources. NOW GRAPH IT: Put bikes on y-axis and computers on x-axis 51
52 Production Possibilities How does the PPC graphically demonstrate scarcity, trade-offs, opportunity costs, and efficiency? Bikes 14 Impossible/Unattainable A (given current resources) B G C 8 Efficient 6 D 4 Inefficient/ Unemployment 2 E Computers 52
53 Opportunity Cost Example: 1. The opportunity cost of moving from a to b is 2 Bikes 2.The opportunity cost of moving from b to d is 7 Bikes 3.The opportunity cost of moving from d to b is 4 Computer 4.The opportunity cost of moving from f to c is 0 Computers 5.What can you say about point G? Unattainable 53
54 Morton Worksheet

.")
55 Production Possibilities A B C D E CALZONES PIZZA List the Opportunity Cost of moving from a-b, b-c, c-d, and d-e. Constant Opportunity Cost- Resources are easily adaptable for producing either good. Result is a straight line PPC (not common). 55
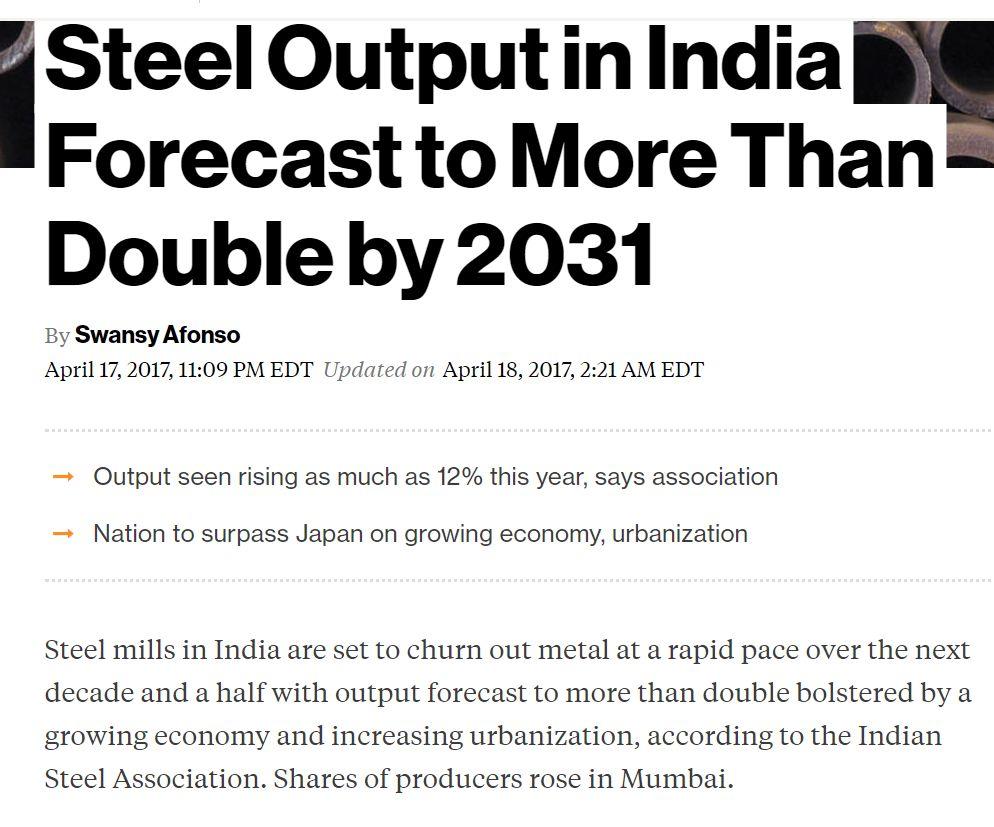
56 Production Possibilities PIZZA ROBOTS A 20 0 B 19 1 C 16 2 D 10 3 E 0 4 List the Opportunity Cost of moving from a-b, b-c, c-d, and d-e. Law of Increasing Opportunity Cost As you produce more of any good, the opportunity cost (forgone production of another good) will increase. Why? Resources are NOT easily adaptable to producing both goods. Result is a bowed out (Concave) PPC.
57 Constant vs. Increasing Opportunity Cost Which product would have a straight line PPC and which would be bowed out? Corn Cactus Wheat Pineapples
58 2012 AP Exam

59 2008 Audit Exam

60 2008 Audit Exam
61 Shifting the Production Possibilities Curve 61
62 Production Possibilities Key Assumptions Revisited Only two goods can be produced Full employment of resources Fixed Resources (4 Factors) Fixed Technology What if there is a change? 3 Shifters of the PPC 1. Change in resource quantity or quality 2. Change in Technology 3. Change in Trade 62
63 Computers Production Possibilities What happens if there is an increase in population? Pizzas 63
64 Computers Production Possibilities What happens if there is an increase in population? Pizzas 64
65 Computers Production Possibilities What if there is a technology improvement in pizza ovens? Pizzas 65
66 Computers Production Possibilities What if there is a technology improvement in pizza ovens? Pizzas 66
67 Capital Goods and Future Growth Countries that produce more capital goods will have more growth in the future. Current PPC Future PPC Consumer goods Panama Mexico Favors Capital Goods Future PPC Capital Goods Capital Goods Panama Favors Consumer Goods Current PPC Consumer goods Mexico 67
 4. Destruction of power plants leads to severe electricity shortage 5. Faster computer hardware 6. Many workers unemployed 7.")
68 PPC Practice Draw a PPC showing changes for each of the following: Pizza and Computers (3) 1. New computer making technology 2. Decrease in the demand for pizza 3. Mad cow disease kills 85% of cows Consumer goods and Capital Goods (4) 4. Destruction of power plants leads to severe electricity shortage 5. Faster computer hardware 6. Many workers unemployed 7. Significant increases in education 68
69 Computers Question #1 New computer making technology A shift only for computers. Pizzas 69
70 Question #2 Computers Decrease in the demand for pizza The curve doesn t shift! A change in demand doesn t shift the curve. Pizzas 70
71 Computers Question #3 Mad cow disease kills 85% of cows A shift inward only for Pizza. Pizzas 71
72 Capital Goods (Guns) Question #4 Destruction of power plants Decrease in resources = decrease production possibilities for both. Consumer Goods (Butter) 72
73 Capital Goods (Guns) Question #5 Faster computer hardware Quality of a resource improves = shifting the curve outward. Consumer Goods (Butter) 73
74 Capital Goods (Guns) Question #6 Many workers unemployed The curve doesn t shift! Unemployment is just a point inside the curve. Consumer Goods (Butter) 74
75 Capital Goods (Guns) Question #7 Significant increases in education The quality of labor is improved. Curve shifts outward. Consumer Goods (Butter) 75
76 Capital Goods Extra graph to manipulate or add to powerpoint or questions X Y Z PPC1 PPC2 PPC3 Consumer Goods
77 Point outside the PPC or Shift of the PPC? WHY? 77