OCTOBER 1, 2018 PHASE 1 OUTREACH SUMMARY LANE TRANSIT DISTRICT
|
|
|
- Angel Collins
- 5 years ago
- Views:
Transcription


1 OCTOBER 1, 2018 PHASE 1 OUTREACH SUMMARY LANE TRANSIT DISTRICT
2 Contents Lane Transit District Transit Tomorrow Outreach Summary... 5 Introduction... 5 Overview... 5 Purpose of the Outreach Summary... 6 Notification and Promotion... 6 Transit Tomorrow Engagement Activities: Overview... 7 Community Engagement Activities... 7 Community Values Survey... 8 Introduction... 8 Key Findings: Values Ranking... 8 Stakeholder Forum Summary Overview Welcome & Introductions Prairieville : Small Group Interactive Workshop Existing Conditions & Key Choices Report Key Choices Polling Online Open House (Interactive Survey) Participation Format Online Open House Feedback Summary Trade-Offs Service more often or to more places? Walking or waiting? Adjustments or redesign? Priorities Additional Questions How often do you ride transit? What is your primary way to travel in the region? LTD Usage, Business Owners, Employment Location What zip code do you live in? What zip code do you work in? How did you hear about this online open house?
3 Online Open House: Open-Ended Responses Location Based Responses General Feedback Online Open House Demographics Summary Age Gender Occupation Household Income Household Occupancy Household Language Hispanic or Latino Descent Race/Ethnicity Online Open House: Crosstab Analysis and Key Findings Overall Findings Frequent Riders vs. Non-Riders Metro vs. Outlying Residents Populations with Higher Transit Needs Listening Sessions and Community Tabling Outreach Summary Overview Listening Sessions Comment Themes Format Trade-Offs Frequency or Places Trade-Off Walking or Waiting Trade-Off Adjustments or Redesign Trade-Off Priorities Tabling Outreach Input Key Themes Participation Priorities Exercise Service Map LTD Operator Outreach
4 Trade-Offs More often or more places? Walking or waiting? Adjustments or redesign? Priorities Appendix A: PRR Community Values Survey Report Appendix B: Listening Sessions Comments Appendix C: LTD Station Tabling Comments Appendix D: Community Partnerships Tabling Comments Appendix E: Survey Operator Comments 3

.")
5 Lane Transit District Transit Tomorrow Outreach Summary Introduction Overview Lane Transit District (LTD) is evaluating long-term transit system investments and service delivery strategies as part of the Transit Tomorrow Project. This work, involving technical analysis and broad public engagement, will identify tradeoffs and options in LTD s system design and inform choices and decisions that will define the region s public transportation system. This work will also will help define the District s Comprehensive Operational Analysis (COA). As part of the study, LTD conducted a public outreach and comment period in summer of Transit Tomorrow: Process & Timeline for Engagement The main purpose of this first outreach period was to introduce the public to the project, solicit input on a set of transit system service priorities, and present and solicit feedback on the key choices and tradeoffs in transit system design. 4
6 Purpose of the Outreach Summary This report summarizes the outreach conducted during the first phase of community input and engagement and provides a detailed breakdown of the public feedback received. The goal of this Summary Report is to: A) Provide a detailed account of what outreach was conducted within this first phase of Transit Tomorrow s Community Engagement efforts, and B) Document crucial input and feedback provided by the public, which will be used to directly inform the development of service planning scenarios. Notification and Promotion The Transit Tomorrow outreach team developed a campaign to publicize and invite residents across LTD s service area to participate in a series of in-person and online engagement activities. The campaign included the following forms of outreach: s A series of s were sent to LTD s jurisdictional partners, nonprofit partners, and general list to invite members of the public, stakeholders and agency partners to attend the stakeholder forum, listening sessions, and to participate in the online open house. Website announcements The Transit Tomorrow webpage and LTD s website prominently announced the online open house, upcoming community events, and invited people to participate. Media releases and meetings with reporters The Transit Tomorrow Outreach team sent several press releases to area media sources. LTD also arranged meetings with reporters at the Registered Guard and local TV media to explain the study and purpose of the online open house. Media Coverage Various news organizations covered Transit Tomorrow during this outreach phase, including NBC 16, KVAL, KEZI, and the Register Guard. Newspaper and Online Advertising The outreach team highlighted the online open house through paid boosts and print promotion through Facebook, and advertising in the Registered Guard s Blue Chip business section. Advertising was also included in Open for Business, the Eugene Chamber of Commerce business publication. Community Newspapers and Newsletters The outreach team reached out to cities, chambers of commerce and community organizations throughout the service area to collaborate on outreach for the listening sessions and online open house. As a result of this outreach, many cities, agencies and organizations included information about the listening sessions and the online open house in their newsletters and online calendars. These include: City of Eugene InMotion Newsletter; City of Eugene Weekly Neighborhood Association Neighborly News; City of Springfield Chamber; Springfield City Club; Eugene City Club; Eugene Chamber; Cottage Grove Chamber; Junction City Chamber of Commerce, Junction City Local Aid; Better Eugene and Springfield Transit (BEST) & BEST Facebook Group. Reddit, Social Media & Student Listservs LTD staff used Eugene Reddit, Facebook, and student listservs at both LCC and University of Oregon to engage residents and students. 5
7 Posters/Fliers/Etc. Outreach staff passed out postcards at several housing units and complexes in and around the LTD service area (with a focus on high ridership and/or low-income earning communities); transit centers featured marquee signage, large poster displays and takeaway information cards. The online survey and general website link were featured in on-bus interior signage as well as LTD s rider newsletter and E-news Bus Talk publication. Reference to Transit Tomorrow and community engagement was also referenced in the District s Rider s Digest. Transit Tomorrow Engagement Activities: Overview Between June and August, LTD outreach staff and consultant team members effectively engaged and received input from more than 1,000 service area residents. The chart below presents each of the major engagement activities, total number of participants, as well as the Public Involvement Targets (established in the Public Involvement Plan) to provide additional context for the levels of engagement established during this outreach phase. Activity PI Target Established in the Public Involvement & Communications Plan Engagement PRE Engagement: Community Values Survey 639 participants Stakeholder Forum # Attending 89 Invitations 66 RSVP 52 Attended Online Interactive Survey (Online Open House) Community Presentations Respondents 668 Respondents Over 152 Participants Community Listening Sessions Tabling & Community Events Members (Project Overall) 10 Events (Project Overall) 24 Participants (this phase) 8 Tabling Events More than 125 engaged/responses Overview (Phase 1): Total 1,659 Community Engagement Activities Pre Engagement Community Values Survey: In late February, 639 participants were recruited by Precision Sample s online panel to help establish an understanding of community values and issues of greatest interest and concern to the communities within LTD s full service area. Responses were used to help inform key messages for engagement, and questions presented in the Online Open House (Interactive Survey). 6
8 Stakeholder Forum: LTD personally invited more than eighty-two community leaders, agency partners, and stakeholders from across the LTD service area to participant in a 4-hour interactive community visioning workshop on June 26, Online Interactive Survey (Online Open House): The Transit Tomorrow Online Interactive Survey launched June 25, 2018 and ran until the end of August. Transit Station/Rider Tabling & Engagement: Three Station Tabling Events were held between July 10 and July 12, 2018 to specifically gather input from transit users and community members at both the Downtown Eugene and Downtown Springfield Transit Stations. Tabling was held during the a.m. and p.m. rush hour pulses, and effectively engaged more than 90 riders and residents in a series of interactive poster activities to gain insight on priorities and travel patterns. Community Listening Sessions: LTD hosted a series of four Community Listening Sessions across the LTD service area between July 11 and July 19, These meetings created an opportunity for residents to learn more about the project, provide insight and input on trade-offs and priorities, as well as interact one-on-one with LTD staff, board members and members of the consultant team. Community Presentations: Engagement and promotion efforts encouraged partner jurisdictions, neighborhood associations, civic organizations, chambers, and other community groups to request presentations. Presentations (to-date) include: Springfield City Club (6/21/2018); City of Eugene Land Use and Transportation joint monthly meeting (6/27/2018); Transportation Options Advisory Committee (6/28/2018); City of Eugene Chamber (7/13/2018); Friendly Area Neighbors (7/22/2018); Springfield GIC (7/24/2018); LTD Strategic Planning Committee (SPC) (7/24/2018); Metropolitan Planning Committee (MPC) (8/02/2018); Veneta, Mayor s office (8/02/2018); Lane ACT (8/8/2018) Nonprofit & Community Partnerships: The Transit Tomorrow outreach team has worked closely to provide information and to invite participation from traditionally underrepresented populations through close partnerships with nonprofits and service providers throughout the LTD service area. The purpose of these smaller targeted tabling opportunities was to provide information about Transit Tomorrow while creating opportunities for face-to-face conversations with outreach staff. Posters and interactive displays were used to create fun and meaningful ways for the public to provide feedback. Community Values Survey Introduction The online survey was conducted February 12-21, This survey instrument was designed and conducted to establish an understanding of community values and issues of greatest interest and concern to the communities within LTD s full service area. The survey was designed and implemented by PRR, a nationally renowned consulting firm specializing in research and analysis. The target population was residents from Lane Transit District s service area. All participants (n=639) were recruited from Precision Sample s online panel, including 389 Eugene residents. Key Findings: Values Ranking Participants in the Community Values Survey were asked to respond to a series of values statements or questions. The image below shows a sample of one of the values questions from the survey. 7
9 Responses were collected and tabulated, highlighting the following key themes or findings: Participants ranked safety and health as the most important investments for transportation improvements. Livable communities and environmental stewardship/sustainability were ranked the second and third most important values, respectively. Three-fourths of respondents said they did not have additional values, other than those mentioned in the survey, about transportation improvements. Among the quarter of respondents who did suggest additional values to consider, cost and affordability came up most often. Participants considered access to all modes of travel for all people as the most important value for livable communities. Participants ranked eliminating transportation-related fatalities and injuries as the most important value for safety and health. Attracting a good workforce with quality public transit and planning for future residential and business growth were both top economic development values. Participants ranked efficient connections between travel methods as the most important value about transportation systems, followed closely by reliable bus service. Participants said that valuing public input and engaging the community in decision making are the most important values about community-based decision making. 8
10 See Appendix A for a full summary report that outlines, in more detail, the design and implementation of the Community Values Survey, as well as more detailed analysis of the key findings. Stakeholder Forum Summary Overview On June 26 th, 2018 more than 52 community stakeholders came together to take a big picture look into transit services within the LTD transit network area. This Stakeholder Forum marked the launch of LTD s Transit Tomorrow Project, a comprehensive review of LTD s operations and service delivery informed by broad based community engagement. This event was held from 9am- 2pm at the University of Oregon Ford Alumni Center. LTD personally invited 89 community leaders, agency partners, and stakeholders from across the LTD service area. Sixty-six stakeholders RSVP d to the event, with 52 in attendance. Three JWA facilitators and two JLA staff attended the forum. Stakeholder forum participants represented a diversity of community needs and demographics. Welcome & Introductions LTD staff and key members of the consultant team welcomed forum participants at a sign in table, providing handouts and a brief orientation to the day including a quick description of the Prairieville activity. Lane Transit District (LTD) s General Manager, Aurora Jackson, opened the forum with a warm welcome and acknowledgement of the time and effort given from those attending. Jarrett Walker + Associates (JWA) led the stakeholder session, engaging attendees with interactive transit mapping and real-time polling. The agenda for the forum included a presentation of transit network planning, a small-group interactive planning game called Prairieville, an introduction to the Transit Tomorrow Project and overview of the foundational analysis of existing transit system conditions. There was real-time polling of key questions, and discussions between participants and the consultant team. To promote continued engagement and dialogue, a sticky wall provided a space for stakeholders to leave written comments, questions and concerns. Attendees continued dialogue after the session in small groups, in conversation with each-other and LTD staff. Prairieville : Small Group Interactive Workshop JWA led Prairieville, an interactive small-group transit planning activity. Participants were given a common level of information and scope, providing a chance to engage with transit without the pressure of representing stakeholder interests. Red, blue and green sticks represented buses with different lengths of travel. Groups worked together, placing sticks on a large-scale community map, developing a transit network that achieved group goals and outcomes. 9


.")
11 Groups completed eleven maps and facilitators chose five for group discussion. Participants were then asked a series of questions about the 5 Prairieville transit system designs. Responses were tracked live using an online polling software. Questions included: Which network is the best for the University? Which network is the best for the hospital? Which network is best for Downtown? Which network is best for low-income people? Which network does the best at getting at least some service close to everyone? Which network is best for people in a hurry? Which network would have the highest ridership? Existing Conditions & Key Choices Report This section of the forum outlined existing conditions within LTD and introduced the LTD Choices Report to the audience. Facilitators from JWA provided a more detailed explanation of high frequency and ridership, describing trade-offs and realities presented when looking at coverage and ridership in transit system planning and design. Participants asked several clarifying questions during the presentation of the choices report information, including: Questions/clarification on the definition of productivity. JWA responded with a definition that presented riders divided by operating costs (i.e.: bus time, drivers, change overs, etc.). Question/clarification on frequency specifically why 20 and 60 minute frequency were grouped together in one of the specific charts. Discussion of weather and how that influences data. JWA responded, explaining that data was taken from two peak seasons. Discussion of costs and funding for ride-source and paratransit services. JWA explained that their analysis showed paratransit service using vans and mini-buses costs slightly more on average than other options. A question was also asked about ride-source s annual budget and spending. Key Choices Polling Participants were then asked to live poll their responses to several key trade-off questions pulled from the Key Choices Report. Participants were encouraged to consider either their personal preferences, or what they believed would be the preferences or priorities of those they serve. 10
12 Questions and responses to the Key Choices polling questions are highlighted below. Q1: More walking or more waiting? Always wait longer to avoid a walk 0% I would mostly choose to wait over walk 21% Not sure 2% I would mostly walk over wait 40% I'll definitely walk to get a shorter wait 36% Q2: Adjustments vs Redesign? Limit to small adjustments 12% Not sure 12% Blank slate rethinking 76% 11
13 Q3: How do you want LTD to balance ridership and coverage? A lot higher coverage, accept lower ridership 5% A little higher coverage Status quo (60/40) 16% 14% A little higher frequency/ridership 51% A lot more frequency/ridership 14% The choices report polling closed with an open discussion to forum participants. Questions and comments from Participants included: Discussion about the ways in which the City and other partners can make investments to improve walking. One participant expressed a concern that the questions and design foundations seemed to assume that all people are mobile and have the option to talk. This participant encouraged the team to consider those who are not mobile in their design and engagement. Discussion about rural areas, and the challenge of increasing frequency in urban areas if we want to reach rural areas (coverage). One participant asked: We represent smaller communities and transit serving the rural areas is a concern. If shifts were made, how would it impact rural areas? Discussion of frequency. Participant questions and comments included: o High frequency is better, because we see how EmX has shown higher rates since expansion. o o Poly-centric and decentralized transit systems are interesting. We have mostly employees that want to get into the metro area; if there was a higher frequency choice that would be better. Connect the low frequency to the higher frequency we need to get out of the low frequency areas into the higher frequency areas. Able to connect routes efficiently to move from other areas into urban centers for jobs and services. One participant encouraged LTD to continue to be innovative, offering support for pilot service to connect mobility services. Need to think about partnerships that can provide options for transit outside of LTD. Opportunity to provide a more logical trip sequence, need to go through Downtown Eugene for any trips. Public Relations and Public Perception: See an empty bus and people think that the system is not being used. Discussion and emphasis on transit-oriented development: looking towards land-uses related to transit. One participant expressed a concern about expenses and rent increases with light-rail and Bus Rapid Transit (BRT), which is a reality that has shown up in other Oregon communities. 12
14 Online Open House (Interactive Survey) Participation The online open house was available from June 26 to August 31. A sample of what the open house looked like is below. However, the interactive survey can be viewed in its entirety at: (commenting features are now disabled). Approximately 1,218 people visited the online open house, and 668 members of the public submitted responses to the online open house questions. Additionally, targeted outreach was conducted at listening sessions and tabling events through hardcopy surveys. A total of 37 completed hard copy version of the online open house were also submitted by LTD Operators through a specific on-site tabling activity. Format The open house included five stations that provided information about the study and invited participants to provide feedback on specific questions: 1. Background This station provided background information about the study purpose, process, and public engagement program. 13
15 2. Trade-Offs This station provided three primary questions based on the transit choices presented in the Choices Report. Participants were asked to select what types of choices or features of a transit system they found most valuable. 3. Priorities This station included a series of priority statements that participants were asked to assign value to. Participants were asked to rate their responses on how they thought LTD should prioritize investments in different types of services. 4. About You This station asked participants to provide information about transit use, how they heard about the survey, and provided an opportunity to add any other comments, thoughts or concerns. 5. Next Steps This station explained the next steps in the study process and ways to stay involved. It also featured an option to opt in for updates and provided optional demographic questions. 14
16 Online Open House Feedback Summary Trade-Offs Online open house participants were given three trade-offs and asked to answer based on their values and level of preference. Below are the results of the trade-offs exercise. Service more often or to more places? Is it more important to provide frequent service more often in places that will attract the most riders, or to provide a little bit of service to as many places as possible? A total of 640 people responded to this question. More frequency, MOST important 134 More frequency, more important 204 Neutral 62 More places, more important 172 More places, MOST important 57 Not sure Walking or waiting? Is it more important to have a bus stop nearby, or to know that if you walk a little farther the bus will come sooner and move more quickly? A total of 642 people responded to this question. Short walks, MOST important 92 Short walks, more important 166 Neutral 60 Less waiting, more important 194 Less waiting, MOST important 119 Unsure
17 Adjustments or redesign? The approach we take determines how much change is possible. Is it better to make incremental changes to the system we already have, or to redesign the system completely from a blank slate? A total of 646 people responded to this question. Adjustments, MOST important 132 Adjustments, more important 210 Neutral 81 Full redesign, more important Full redesign, MOST important Unsure Priorities Online open house participants were asked to consider a series of transit service elements: more frequent daytime service, more evening service, more weekend service, late night service, extra service during rush hours, service to more place in Eugene/Springfield, and more service to small towns and rural areas. Participants were given 21 points to allocate between the different transit service elements based on which they would like prioritized. No more than seven points could be assigned to each element. The first graph below illustrates the total points allocated to each transit service element. The second graph provides a visual breakdown of how participants assigned their points on a scale of zero to seven. Weekend service Evening service Daytime service More places 1874 Rural towns Rush hour Late night service
18 Weekend service Evening service Daytime service Service to more places Rural/small town service Rush hour service Late night service Additional Questions How often do you ride transit? A total of 643 people responded to this question. Everyday 160 A few times a week 155 A few times a month 113 A few times a year 106 I have ridden before, but not this year 62 I don't ride transit
19 What is your primary way to travel in the region? A total of 644 people responded to this question. Car (mostly alone) 242 LTD fixed route bus/emx 225 Bike/walk 102 Carpool/vanpool (two or more people) 62 Other Of those that indicated that they have another primary way of travel, common responses included: Mobility scooter Motor scooter Ridesource Combination of transportation options LTD Usage, Business Owners, Employment Location Participants were asked to indicate which of the following statements apply to them: I use LTD services. I am an owner/manager of a local business (public, private or nonprofit) I am employed in Lane County. A total of 502 respondents indicated that they use LTD services, 64 indicated that they are the owner or manager of a local business, and 309 indicated that they are employed within Lane County. 18
20 What zip code do you live in? A total of 630 people responded to this question. A chart illustrating the cities with the highest number of responses is below. Cities Eugene(427) 68% Springfield (125) 20% 12% Coburg (18) 3% Cottage Grove (16) 3% Other (34) 5% Junction City (6) 1% What zip code do you work in? A total of 486 people responded to this question. A chart illustrating the cities with the highest number of responses is below. Cities Eugene(338) 70% 30% Springfield (87) 18% Coburg (7) 1% Cottage Grove (6) 1% Other (47) 10% Of those that responded other many indicated that they do not work or are retired. 19
21 How did you hear about this online open house? Web/social media 221 News article 136 LTD 119 Word of mouth 89 Postcard 32 TV/radio 14 Other Those that indicated that they heard about the online open house through another means named the following: Signs, posters, or flyers on buses or at bus stops Chamber of Commerce communications Neighborhood association communications Reddit Better Eugene-Springfield Transportation (BEST) communications Community Alliance of Lane County (CALC) communications City Club communications Lane Regional Air Protection Agency (LRAPA) communications 20
22 Online Open House: Open-Ended Responses Online open house participants were given the option to provide any additional feedback they may have regarding LTD and transit in general in Lane County. A total of 406 people provided comments. Below is a summary of common themes that arose from the open-ended portion of the online open house. Location Based Responses A large number of participants provided comments based on specific locations, bus routes, neighborhoods, or cities. Downtown (49) A total of 49 participants had specific comments regarding transit in downtown. Many noted the increased ride and wait time due to the existing hub centric approach to transit. This acts as a deterrent to regular use of transit. A significant number requested express bus alternatives to and from common locations that avoid downtown to support employees and students that need to arrive on time. Some mentioned that specific areas lack frequent bus service to downtown. Service to the Oregon coast (16) Ten participants specifically asked for service to Florence, Oregon, and an additional six asked for service to the coast in general. Service to the Airport (13) A total of 13 people noted the lack of transit service to the airport which is necessary due to the region s population. River Road (10) The River Road area lacks sufficient transit service. Many suggested extending EmX to River Road. Some suggested conducting a ride analysis in order to develop comprehensive transit service during peak hours and avoid service during hours with low ridership. Coburg Road (8) Many supported either more frequent or comprehensive transit service bus or EmX on Coburg Road. Some opposed increasing transit on Coburg due to concerns about traffic, construction impacts, and streetscape detriment (i.e. tree removal). Santa Clara (6) A number of people noted the lack of transit access in Santa Clara. Jasper Road (6) Some suggested adding a bus along Jasper Road. 21
23 Junction City (5) The majority of participants that mentioned Junction City expressed a desire for continued/improved service to Junction City. Some suggested extending EmX to Junction City. General Feedback Project staff reviewed the 406 responses to the open-ended comment section of the online open house to identify key themes. The key themes and specific feedback related to each theme was then sorted from most to least common, as seen below: System Functionality Create a cohesive transit system that functions based on common transfers to ensure shorter wait times and easier access. Increase frequency of buses at popular stops during peak hours arrivals every 15 minutes. Develop a system that is built around providing access to essential locations (i.e. grocery stores, employment hubs, medical facilities, schools, shopping districts, etc.). Develop east/west, north/south express routes to specific locations that avoid downtown. Ensure schedule consistency to support employees and students and provide service that allows for early morning/late night arrival. Develop a system around the first mile, last mile concept to encourage ridership and increase accessibility. Ensure the system supports middle school, high school, and college students by ensuring safety and access. Redesign the system: o Develop a backbone or grid system for transit to replace the current hub centric design. o Improve the current hub centric design to support more areas of the city and provide a more comprehensive, faster, and more accessible system that doesn t focus solely on downtown. Identify and develop necessary connections to support future growth. Ensure the system works cohesively with the transportation system and does not increase congestion for personal and freight vehicles. Provide more weekend service. Conduct a rider analysis to identify important connections for time specific travel. Educate bus drivers to ensure their ability to provide directions for riders. Educate bus drivers on safety both on the road and on the bus. Conduct a seasonal rider analysis to tailor the system effectively. Fare, Schedule, and Information Access Provide reduced fare options based on income and school enrollment. Do not increase transit fare. Create a universal and functional fare system across all transit options. Improve online system for purchasing tickets and passes, accessing schedules, and communicating with LTD. 22
24 Improve customer service. Develop an effective transit app that provides mobile access to schedules and for purchasing tickets. Equity and Inclusion Remove barriers to access for disabled transit users (i.e. room for wheelchairs, seating at bus stops, audio transit schedules and stop alerts, etc.). Develop a system that supports vulnerable populations, ensuring access to crucial locations and avoiding gentrification. System Amenities Provide lighting, shelters, and seating at all stops to ensure safety and promote transit use. Increase bike storage on buses. Provide bike parking at popular transit destinations. Develop park and rides at popular transit commute stations. Sustainability Invest in low-emission or electric buses to support the region s climate goals. Explore transit alternatives that support sustainability (i.e. light rail, AVs, etc.). Promote sustainable practices. 23
25 Online Open House Demographics Summary Age At total of 546 people responded to this question. Under Over Gender A total of 556 people responded to this question. Nonbianary/third gender (11) 2% Prefer not to specify (11) 2% Male (215) 39% Female (318) 57% 24
26 Occupation Work (outside your home) 342 Retired 114 Disabled Work from home Homemaker Unemployed UofO student LCC student Middle/high school student Other student Household Income A total of 505 people responded to this question. Less than $10, $10,000 - $14, $15,000 - $24, $25,000 - $34,999 $35,000 - $44,999 $45,000 - $54, $55,000 - $74, $75,000 - $99, $100,000 or more
27 Household Occupancy A total of 557 people responded to this question or more Household Language The majority of respondents (546) indicated that they speak English at home, five indicated that they speak Spanish, and two indicated that they speak a different language Japanese and Vietnamese. Hispanic or Latino Descent Participants were asked if they were of Hispanic or Latino descent. The majority of respondents (512) indicated that they were not of Hispanic or Latino descent, with 26 indicating that they were. 26
28 Race/Ethnicity Participants could check all that applied. Native American Indian (30) 5% Caucasian/white (482) 83% African American/Black (21) 4% Hispanic/Latino/ Spanish (20) 3% Asian (12) 2% Other (16) 3% Of the 16 respondents that indicated another race not listed, common responses were Israeli/Jewish and Pacific Islander. 27
29 Online Open House: Crosstab Analysis and Key Findings The previous section outlined the overall findings of the Online Open House with regard to transit tradeoffs and priorities, as well as the demographic characteristics (age, income, place of residence, usual mode of travel etc.) of the respondents. Because an Online Open House is not a scientific survey, the results taken in aggregate may reflect more about the type of people who chose to respond than about the general opinions of the residents of Eugene, Springfield, and Central Lane County. For this reason, it is useful to break out responses on the trade-offs and priorities by responses that may reflect different perspectives. This allows us to see how different types of people may have different priorities, and to confirm whether the general patterns of responses hold true when applied to more individual circumstances. In this analysis, we have broken down responses on trade-offs and priorities according to the following characteristics: Whether people ride transit frequently: Frequent Transit Rider vs. Infrequent and Non-Riders Where people live: Eugene vs. Springfield vs. Elsewhere Whether people belong to groups with higher transit needs: Low-Income, Seniors (60+) and Disabled Overall Findings We found the following regarding transit trade-offs: Frequency vs. Coverage: A clear majority of survey respondents are more interested in frequent service than service to more places. This extends across most categories of respondents, and is especially true of frequent transit riders and metro area residents. The main exception is those who live outside the metro area. Shorter Waits vs. Shorter Walks: More respondents prefer shorter waits than prefer shorter walks. However, the reverse is true for seniors and people with disabilities. Adjustments vs. Redesign: A clear majority of respondents would prefer to see adjustments to the existing network rather than a complete redesign. This is especially true for seniors, the disabled, and low-income respondents. We found the following regarding priorities: Weekend, evening, and frequent daytime service: The highest priorities across nearly all respondent groups were increased weekend and evening service, and more frequent daytime service. Adding weekend and evening service is an especially high priority for frequent transit riders, and low-income respondents. Senior respondents are especially interested in daytime frequency. 28
30 Service to more places in the metro area is a higher priority for infrequent and non-riders, but also seniors and people with disabilities. Service to rural and outlying areas is a very high priority for rural/outlying area residents, but a low priority for all other groups, except for people with disabilities. More rush hour service is a low priority for nearly all respondent groups, and it is an especially low priority for low-income, disabled, and senior respondents. Late night service is a low priority across all respondent categories. Frequent Riders vs. Non-Riders People who ride transit frequently have different priorities than those who do not. In particular: Frequent riders are slightly more interested in frequency rather than coverage. Frequent riders also have a stronger preference for adjustments to the existing transit system rather than redesign. Frequent riders are especially interested in improved weekend and evening service. Both frequent riders and infrequent and non-riders are interested in frequent daytime service. Infrequent and non-riders are the group most interested in expanding service to more places in the metro area. All Responses Frequent Transit Riders ("A Few Times a Week" or "Every Day") Infrequent and Non-Riders ("A few times a year" or "I have ridden transit before, but not in the last year" or "I don't ride transit") No. of Responses Trade-Offs (% of respondents leaning slightly or strongly in one direction) Frequency vs. Coverage Walking vs. Waiting 50% Frequency 34% Coverage 47% Shorter Waits 39% Shorter Walks 53% Frequency 34% Coverage 49% Shorter Waits 36% Shorter Walks 46% Frequency 38% Coverage 42% Shorter Waits 43% Shorter Walks Adjustments vs. Redesign 51% Adjustments 27% Redesign 56% Adjustments 20% Redesign 44% Adjustments 36% Redesign More Weekend Frequency More Evening Frequency Priorities (average points spent, out of a total of 21) Frequent Daytime Service Service to More Places (Metro) Service to More Places (Non-Metro) More Rush Hour Service Late Night Service
31 Metro vs. Outlying Residents People s priorities for transit are impacted by where they live, and what that means about their access to service. In particular: Metro area respondents (especially in Springfield) are more interested in frequency rather than coverage. Rural and outlying respondents have the opposite tendency. Metro area respondents (especially in Eugene) are more interested in shorter waits rather than shorter walks. Rural and outlying respondents have the opposite tendency. Rural and outlying area residents are much less interested in improving service frequency than metro area residents. Rural and outlying area residents are much more interested in extending service to more places outside the metro area. All Responses Live in Eugene (97401, 97402, 97403, 97404, 97405, 97440) Live in Springfield (97477, 97478) Live Elsewhere Total Number Trade-Offs (% of respondents leaning slightly or strongly in one direction) Frequency vs. Coverage Walking vs. Waiting Adjustments vs. Redesign 50% Frequency 34% Coverage 47% Shorter Waits 39% Shorter Walks 51% Adjustments 27% Redesign 51% Frequency 34% Coverage 51% Shorter Waits 37% Shorter Walks 48% Adjustments 31% Redesign 61% Frequency 27% Coverage 43% Shorter Waits 38% Shorter Walks 58% Adjustments 20% Redesign 32% Frequency 48% Coverage 38% Shorter Waits 44% Shorter Walks 55% Adjustments 20% Redesign More Weekend Frequency More Evening Frequency Priorities (average points spent, out of a total of 21) Frequent Daytime Service Service to More Places (Metro) Service to More Places (Non-Metro) More Rush Hour Service Late Night Service Populations with Higher Transit Needs Low-income populations on average have a higher need for transit service than others. Senior and disabled populations sometimes have a higher need for transit service, but also typically have specialized needs that may be more complex to meet with fixed-route service. The priorities of these groups were the following: All three higher-need groups are more interested in adjustments to the network rather than redesign. This is consistent with a generally higher level of social vulnerability. Low-income respondents are the group most interested in improved weekend and evening frequency. They are also the group least interested in extra rush hour service. 30
32 Senior respondents place a higher value than other groups on frequent daytime service, and on extending service to more places in the metro area. They are the group least interested in late night service. Disabled respondents have the strongest preference for shorter walks rather than shorter waits. They are also more interested than other groups in service to more places, both within and outside the metro area. All Responses Low-Income (Household Income <= $35k) Seniors (Age 60+) Disabled Total Number Frequency vs. Coverage 50% Frequency 34% Coverage 47% Frequency 35% Coverage 48% Frequency 40% Coverage 42% Frequency 38% Coverage Trade-Offs (% of respondents leaning slightly or strongly in one direction) Walking vs. Waiting 47% Shorter Waits 39% Shorter Walks 45% Shorter Waits 38% Shorter Walks 41% Shorter Waits 46% Shorter Walks 32% Shorter Waits 54% Shorter Walks Adjustments vs. Redesign 51% Adjustments 27% Redesign 58% Adjustments 18% Redesign 62% Adjustments 20% Redesign 68% Adjustments 10% Redesign More Weekend Frequency More Evening Frequency Priorities (average points spent, out of a total of 21) Frequent Daytime Service Service to More Places (Metro) ervice to More Places (Non-Metro More Rush Hour Service Late Night Service

33 Listening Sessions and Community Tabling Outreach Summary Overview To gain insight into the community s transit priorities and trade-offs the project team completed eleven public outreach events. These events were split between four listening sessions and six tabling events; those combined efforts engaged a total of 140 people. Intentional effort was made to engage a diverse set of stakeholders within the LTD service area. Outreach locations were secured through partnerships with local businesses and governments and were designed to reach a wide audience. Attendees were notified about the events through the Register Guard, Bus Talk Newsletter, Facebook, and local radio. Tabling events targeted rush-hour pulses at LTD stations and reached vulnerable community members through partnerships with local community. Listening Sessions A total of four listening sessions were held across the LTD service area at various locations including West Eugene Elks Lodge, El Tapatio in Cottage Grove, LTD s Next Stop Center in Downtown Eugene, and the City of Springfield s Public Library. These sessions brought community members together to talk about the future of transit in a relaxed, participatory atmosphere. Turn-out for these listening sessions was low (a total of 24 participants total), but provided an opportunity for meaningful connections and conversations with transit users, interested communities members, and business leaders. Due to the low numbers of participant turnout at these events, the project team has considered a revision of the listening session format for the next phase of community engagement. Comment Themes Increased connectivity for low-income and rural workers is crucial. Increased accessibility to recreational opportunities is needed. Perception of LTD and ridership experience can be seen as negative, changes in public perception could benefit ridership. Increased support and accessibility regarding senior, youth and disabled populations. Increased safety design needed near and around stops: lights, stops, benches and signage. LTD has a positive reputation with riders within the community. Outreach and maintaining community connections is appreciated. Bus service to the airport is needed. 32
34 Format Listening sessions featured a short project presentation from LTD, an interactive poster session, and a discussion/review of comments and questions. Attendees used color-coded dots to identify trade-offs and priorities corresponding to questions from the interactive online survey. Additional comments were gathered and placed on a sticky-wall, then grouped into themes. Participants engaged with LTD staff during these activities, with opportunities to ask additional questions and to learn more about the Transit Tomorrow project and LTD operations. Trade-Offs Listening session participants were given three colored dots and were asked to answer three Trade-off questions: 1. Service more often or to more places? 2. Walking or waiting? 3. Adjustments or redesign? The sections below highlight responses from listening session participants on these three trade-off questions. Frequency or Places Trade-Off The majority of participants chose service to more places, including all of Springfield participants and most of Cottage Grove. Not Sure Less Waiting MOST Important Less Waiting More Important Neutral Short Walks More Important Short Walks MOST Important /11 DT Eugene 7/16 Springfield 7/17 Cottage Grove 7/19 West Eugene In contrast, all West Eugene participants voted for increased frequency. Downtown Eugene attendees were equally split between the two trade-offs. 33
35 Walking or Waiting Trade-Off Short walks were more important for all attendees, with the exception of West Eugene, who favored less waiting. Not Sure Less Waiting MOST Important Less Waiting More Important Neutral Short Walks More Important Short Walks MOST Important /11 DT Eugene 7/16 Springfield 7/17 Cottage Grove 7/19 West Eugene Again, Downtown Eugene was split across the two trade-offs while Cottage Grove favored short walks over less waiting. Adjustments or Redesign Trade-Off Adjustments, rather than a full redesign received the most support overall. Not Sure Full Redesign MOST Important Full Redesign More Important Neutral Adjustments More Important Adjustments MOST Important /11 DT Eugene 7/16 Springfield 7/17 Cottage Grove 7/19 West Eugene Springfield and Downtown Eugene fully supported adjustments over redesign. West Eugene was split between a full redesign and more adjustments. 34
36 Priorities Listening Session participants used dots to identify their top three service priorities. More Service to Small Towns and Rural Areas Service to More Places in Eugene/Springfield Extra Service at Rush Hours Late Night Service More Weekend Service More Evening Service More Frequent Daytime Service DT Eugene Springfield Cottage Grove West Eugene Springfield and Cottage Grove attendees prioritized more service to small towns and rural areas. With the exception of West Eugene, small town and rural service was the top priority overall. More frequent daytime service was prioritized by both West Eugene and Downtown Eugene participants. Extra service during rush hours and late night service were not top priorities across the listening sessions. 35

37 Tabling Outreach Six tabling events were conducted, reaching lowincome and historically underrepresented populations that frequently use LTD services. The project team engaged community members about Transit Tomorrow and gave away post-cards with a link to the onlineinteractive survey. Community members interacted with the priorities poster, identifying their top three service priorities. A large-scale LTD service map allowed participants to map their top three transit origins and destinations and view the network. Additionally, a large-scale system map helped the public visualize the scope of an indepth study, such as Transit Tomorrow. Input Key Themes EmX: Routes: Need for expansion and improvement and improved connections with existing and new bus routes. Increased connectivity is needed, along with more frequency and greater number of places. Accessibility: Equity: Safety: ADA, low-income and generational differences in transportation needs and wants in a system design. Need for earlier and later transit for shift-workers, students, teens and elderly. Need for increased safety on EmX routes. Need for increased perception of safety for elderly, women and children (better lighting, benches at stops, cross walks and shelters). Need for increased cleanliness on buses and EmX routes. Need for increased monitoring of illicit behavior at stops and in back of buses. 36

38 Participation Location Completed Activity LTD Eugene Station 40 LTD Springfield Station 23 Ya Po Ah Terrace 25 West-town Apartments 2 Willakenzie Crossing Apartments 3 Friendly Area Neighbors Picnic 23 Total Reach 116 people Priorities Exercise Participants were given three colored dots to identify their top three service priorities. More Service to Small Towns and Rural Areas Service to More Places in Eugene/Springfield Extra Service at Rush Hours Late Night Service More Weekend Service More Evening Service More Frequent Daytime Service DT Eugene Springfield Cottage Grove West Eugene Participants in the tabling activities chose more weekend service as the top priority, with 22% of total dots. Similarly, participants in the morning tabling session at Eugene Station supported more weekend service as the highest priority. More evening service was the second highest priority, followed by more frequent daytime service. Extra service at rush hour was the least prioritized service between all tabling locations. 37


39 Service Map Participants were given three colored dots which they placed on their top origin and destination within LTD s service range. Dots from tabling events were color-coded by location: Red: Springfield Listening Session, Friendly Area Neighbors Picnic, Ya Po Ah Terrace Blue: Downtown Listening Session, West Eugene Listening Session, LTD Eugene Station (AM) Green: LTD Eugene Station (PM) Yellow: LTD Springfield Station, Westtown and Willakenzie Housing While placing dots on the map, participants engaged in conversation about route changes, system design, the downtown hub model and overall connectivity. Participants from the Springfield area highlighted areas along Springfield s Main Street using the EmX line, connecting North into the Gateway district. Downtown Eugene participants placed dots frequently along the River Road corridor and also the U of O University district. Downtown Eugene s transit hub is also a highly used connection for all participants, across all geographies. Cottage Grove highlighted routes along Valley River Rd. and Good Pasture Island Rd., they also favor routes that connect to services and both Eugene and Springfield s downtown cores. Ya-Po-Ah terrace community members emphasized routes connecting services along the River Road corridor and connections between local retirement and aging communities. 38
40 LTD Operator Outreach LTD staff reached out to LTD operators with a special, targeted tabling opportunity in the LTD Operators Lounge. Thirty-seven LTD employees filled out hardcopy paper copies of the online open house (interactive survey) and spent time in one-on-one conversations with LTD outreach staff. Trade-Offs More often or more places? Surveyed LTD operators are equally split between increased frequency in core areas (47%) and an expanded service range into more places (50%) More Frequency MOST Important 9 More Frequency More Important 1 Neutral 14 More Places More Important 3 More Places MOST Important Walking or waiting? LTD operators are similarly split between shorter walks (46%) and less waiting (49%) as important for future transit usage Short Walks MOST Important Short Walks More Important Neutral Less Waiting More Important Less Waiting MOST Important 39
41 Adjustments or redesign? A total of 77% of LTD operators prefer adjustments to the current system rather than a redesign, while 9% favored a complete redesign as the right approach Adjustmets MOST Important Adjustments More Important Neutral Full Redesign More Important Full Redesign MOST Important Priorities More service to small towns and rural areas gained the highest support overall (21%), with extra service during rush-hours, service to more places, and weekend service gaining similar support. Extending evening service hours was not selected as a high priority for surveyed operators, with late night service (after midnight) gaining the least support (3%) More Frequent Daytime Service More Weekend Services Late Night Service (After Midnight) More Evening Service (Before Midnight) Extra Service at Rush Hours Service to More Places in Eugene/Springfield More Service to Small Towns and Rural Areas 40
42 Appendix A: PRR Community Values Survey Report


43 Lane Transit District Community Values Survey Report of Results April 23, 2018 Seattle Washington DC Austin Norfolk Portland
44 Table of Contents Section Page Executive Summary. 3 -Purpose.. 4 -Methods. 5 -Key Findings. 6 Values Ranking Results.. 7 Traveling in the Area. 18 Appendices 36 -Appendix A Demographics, all respondents Appendix B Demographics, Eugene respondents. 38 -Appendix C Distribution of Respondents 39 -Appendix D Survey Instrument 40 2
45 Executive Summary 3
46 Purpose Lane Transit District (LTD) is a regional transit agency organized in 1970 under the laws of the state of Oregon to provide transit service in Lane County. The LTD service area is 4,700 square miles with a population of approximately 300,000 with the largest population located in the metropolitan area of Eugene and Springfield. Rural communities served include Coburg, Junction City, Veneta, Cottage Grove, Creswell, Lowell, Pleasant Hill, as well as portions of the county's unincorporated areas. This survey instrument was designed and conducted to establish an understanding of community values and issues of greatest interest and concern to the communities within LTD s full service area that would help inform two key projects: Moving Ahead: Lane Transit District and the City of Eugene are working in partnership in an effort called MovingAhead; a project that will consider a range of near-term transportation investments along five key corridors in Eugene: Highway 99, River Road, 30th Avenue to Lane Community College, Coburg Road and Martin Luther King, Jr. Boulevard. LTD, the City of Eugene, and other regional partners are looking at each corridor individually to understand what types of investments are needed for people using transit, biking, walking, and mobility devices to meet their transportation needs and support vibrant places. Comprehensive Operational Analysis (COA): The COA will involve a comprehensive, objective examination of LTD s full range of mobility services. The primary goal of the COA is to facilitate a robust and focused community dialogue that leads to a clear statement of transit goals and priorities that LTD can then use to guide future transit planning and investment. Both projects rely heavily on community participation in the development of concepts and transit improvement scenarios and in the prioritizing of specific investment strategies. Key findings and core values obtained from this survey will be used to help guide the trade-offs analysis and the development of transit improvement scenarios. The results from the survey have been separated and summarized by two categories of respondents: All respondents, which includes the entire LTD service area, and Eugene respondents, which more narrowly includes respondents within the City of Eugene. Results have been presented in this way to focus on the two projects described above with Moving Ahead focused more on community values and issues of concern with the Eugene geographic boundary, and the COA process which is interested in values and issues across the entire LTD service area. The respective findings for these two groups are designated throughout the report by the following headers: COA All respondents and MovingAhead Eugene respondents. 4
47 Methods The online survey was conducted February 12-21, The target population was residents from Lane Transit District s service area. All participants (n=639) were recruited from Precision Sample s online panel, including 389 Eugene residents. The final sample is representative of the demographics of the area with regard to age, race/ethnicity, and income level, as reported in the 2016 American Community Survey. Therefore, the data is not weighted by these variables. Women were overrepresented in the sample, but the data was not weighted by gender because there was no significant difference in how women and men responded. Figures in the report summarize responses for survey questions, and correlations identify whether there is a relationship between participant characteristics and their survey responses. The overall margin of error for this survey is +/- 3.9%. In other words, differences between groups of 3.9 percentage points or less are not substantively meaningful. Statistical significance Crosstab testing identified statistically significant relationships between characteristics of the respondents and their responses to survey questions. For example, crosstabs help answer the question, are younger respondents more likely to commute to or from work than older respondents? In other words, crosstabs tell us whether a correlation exists between two variables (e.g. age and commuting to/from work). A crosstab test has two components: The Chi-square statistic indicates whether there is a statistically significant difference between groups of respondents (e.g. different age groups), and the coefficient (either Cramer s V or Kendall s Tau-C, depending on the nature of the variables) indicates the strength of association between two variables (e.g. age and commuting to/from work). Only statistically significant relationships are reported. To achieve the statistical significance, correlations must have a 0.05 significance level (a 95 percent confidence level) and a coefficient of 0.17 or larger. Together, this criteria indicates a relatively strong relationship. Crosstab results indicate whether one group is more or less likely to behave in a certain way than another group, but does not indicate causality. Put differently, a crosstab can tell us that younger respondents are more likely to commute to/from work than older respondents but does not say how much more likely that is. Furthermore, a crosstab does not tell us that age is the cause of commuting to/from work. 5
48 Key Findings Values ranking: Participants ranked safety and health as the most important investments for transportation improvements. Livable communities and environmental stewardship/sustainability were ranked the second and third most important values, respectively. Three-fourths of respondents said they did not have additional values, other than those mentioned in the survey, about transportation improvements. Among the quarter of respondents who did suggest additional values to consider, cost and affordability came up most often. Participants considered access to all modes of travel for all people as the most important value for livable communities. Participants ranked eliminating transportation-related fatalities and injuries as the most important value for safety and health. Attracting a good workforce with quality public transit and planning for future residential and business growth were both top economic development values. Participants ranked efficient connections between travel methods as the most important value about transportation systems, followed closely by reliable bus service. Participants said that valuing public input and engaging the community in decision making are the most important values about community-based decision making. Quality of travel in area: Participants, regardless of where they lived, were satisfied with the quality of travel in their neighborhood. Respondents as a group were more satisfied with the quality of travel in the Springfield area than Eugene-based respondents. Reasons for and means of travel: Travel for everyday life, such as for shopping or errands, is the top reason participants traveled within the Eugene- Springfield area. Visiting friends or family and commuting to and from work came in as the second and third most common reasons for travel, respectively. Driving alone was the most common way participants traveled in the Eugene-Springfield area in the last seven days, but about half of all participants carpooled and over one-third said they walked (for non-recreational purposes). The majority of respondents were not familiar with the MovingAhead project. However, people who used modes of transportation other than driving alone (e.g. biking for nonrecreational purposes or public transit) tended to be more familiar with the project than respondents who drive alone. Eugene-specific: Overall, there were few meaningful differences between Eugene respondents and the overall respondents. 6
49 Values Ranking Results 7
50 Please rank the following values about livable communities from most important (1) to least important (3) in regard to investments for transportation improvements. Participants considered access to all modes of travel for all people as the most important value for livable communities. Neighborhoods supporting the ability to meet needs without the use of a car and reducing or eliminating economic disparities among neighborhoods ranked second or third most important values, respectively. All respondents Eugene respondents 8
51 Please rank the following values about safety and health from most important (1) to least important (3) in regard to investments for transportation improvements. Participants ranked eliminating transportation-related fatalities and injuries as the most important value for safety and health, followed closely by establishing safe routes to school. Increasing multi-mode travel came in as the third most important safety and health value. Those who are somewhat or very familiar with the MovingAhead project tend to rank increasing walking, biking, and transit as more important. All respondents Eugene respondents 9
52 Please rank the following values about economic development/economic benefit from most important (1) to least important (3) in regard to investments for transportation improvements. Participants ranked economic development values very closely. By slim margins, their priorities were: attracting a good workforce by having quality public transit, planning for future growth, and supporting redevelopment in key areas through investments in transportation. All respondents Eugene respondents 10
53 Please rank the following values about transportation systems/facilities from most important (1) to least important (3) in regard to investments for transportation improvements. Participants ranked efficient connections between travel methods as the most important value about transportation systems, followed closely by reliable bus service. Having attractive and comfortable transportation systems and facilities came in third place. However, car sharing users were more likely to rate this item as the most important value. All respondents Eugene respondents 11
54 Please rank the following values about community-based decision making from most important (1) to least important (3) in regard to investments for transportation improvements. Participants said that valuing public input and engaging the community in decision making are the most important values about community-based decision making. Ensuring everyone has access to pertinent information came in third place. All respondents Eugene respondents 12
55 Please rank the following values about environmental stewardship/ sustainability from most important (1) to least important (3) in regard to investments for transportation improvements. Participants said that protecting water and air quality was the most important value for environmental stewardship. Preserving the natural environment and reducing greenhouse gases/combatting climate change were ranked the second and third most important values, respectively. All respondents Eugene respondents 13
56 Please rank the following from most important (1) to least important (6) when you think about investments for transportation improvements. Participants ranked safety and health and livable communities as the most and second-most important investments for transportation improvements, respectively. They ranked other values similarly to one another. Community-based decision making was identified as the least important investment for transportation improvements. All respondents Eugene respondents 14
57 Correlations of ranking investments for transportation improvements COA All respondents Public transit users were more likely to rate efficient, reliable, and attractive transportation systems as the most important value. Car sharing users rated community-based decision making more highly than non-users. Bike users were more likely to rank livable communities as the most important value. MovingAhead Eugene respondents Hispanic residents of Eugene were more likely to rank environmental stewardship/sustainability as their 2 nd or 3 rd choice. Respondents who did NOT drive a single-occupancy vehicle in the last seven days were more likely to rank: Community-based decision making first Safety and health last (6 th place) Respondents who did NOT carpool were more likely to rank efficient, reliable, and attractive transportation last (5 th or 6 th place). Respondents who did NOT use public transit were more likely to rank safety and health as the most important (1 st place) value. Respondents who walked for non-recreational purposes were more likely to rank efficient, reliable, and attractive transportation as less important (4 th or 5 th place). 15
58 Do you think there are values, other than those already mentioned in this survey, that are important in regard to improving transportation in the Eugene-Springfield area? About a quarter of participants (24% among all respondents, 26% among Eugene residents) said there were other values important for improving transportation in the area. COA All Respondents N = 639 MovingAhead Eugene Residents N = 389 Yes 24% Yes 26% No 76% No 74% 16
59 What values, other than those already mentioned, do you think are important in regard to improving transportation in the Eugene-Springfield area? When asked about additional values that were important for improving transportation in the Eugene-Springfield area, participants mentioned cost and affordability most often. Concerns about high transportation fees and increasing costs of living were common. Safer ways to travel for women and children at night. Cheaper bus rates so they are not out walking the streets when they cannot afford a taxi or bus fare. Others worried about how costs of improvements would unduly affect public budgets and tax money usage. Keeping the community livable. We moved from Seattle where it no longer made financial sense to live there. I think it's important to make community improvements while still making the city affordable. Additional topics included accessibility concerns, system design and connectivity, and road maintenance. A system that reaches outside of the city core. LTD needs to have multiple hubs instead of everything having to transfer downtown and better nighttime schedules for retail employees. Better routing, better lighting at night. Keeping existing roads and paths repaired, and markings painted. Neither is done frequently enough. Topic Additional Values Count Cost and affordability 32 Accessibility concerns (including expanding service outside the core and serving the homeless population) System design and connectivity 18 Miscellaneous comments 18 Road maintenance, lighting, or signage 16 Multi-mode travel and integrated public transit 12 Congestion management concerns 11 Community-focused suggestions 10 Cleanliness and safety of transit facilities 9 Comments unrelated to transportation 7 Transit reliability
60 Traveling in the Area 18
61 How would you rate the quality of travel in your neighborhood area? Participants, regardless of where they lived, were satisfied with the quality of travel in their neighborhood. 77% of all respondents rated the quality of travel in their neighborhood as good (52%) or excellent (25%), compared to 79% of respondents in Eugene who rated the quality of travel in their neighborhood as good (55%) or excellent (24%). 5% of all respondents and 3% of Eugene respondents rated the quality of travel as poor. There was not a meaningful difference between Eugene residents and other participants in terms of how they rated the quality of travel in their neighborhood. COA All respondents MovingAhead Eugene respondents Excellent 24.5% 24.0% Good 52.0% 54.7% Fair 17.5% 17.4% Poor 5.4% 2.9% No opinion 0.6% 1.0% Totals
62 Correlations of quality of travel in the neighborhood COA All respondents Reported the quality of travel was excellent: Respondents who drove a single occupancy vehicle in the last seven days were more likely to rate the quality of travel in their neighborhood as excellent. Reported the quality of travel was good: Respondents who drove a single-occupancy vehicle in the last seven days were more likely to rate the quality of travel in their neighborhood as good. Respondents who commuted to and from work in the last seven days were more likely to rate the quality of travel in their neighborhood as good. Reported the quality of travel was fair: Respondents who commuted to and from work in the last seven days were more likely to rate the quality of travel in their neighborhood as fair. Reported the quality of travel was poor: Respondents who did NOT drive a single-occupancy vehicle in the last seven days were more likely to rate the quality of travel in their neighborhood as poor. 20
63 How would you rate the quality of travel in the Eugene area? Eugene residents were more satisfied with the quality of travel around Eugene than respondents overall. 67% of all respondents rated the quality of travel in the Eugene area as good (47%) or excellent (20%), compared to 73% of respondents in Eugene who rated the quality of travel in the Eugene area as good (51%) or excellent (22%). 6% of all respondents and 3% of Eugene respondents rated the quality of travel as poor. There was not a meaningful difference between Eugene residents and other participants in terms of how they rated the quality of travel around Eugene. COA All respondents MovingAhead Eugene respondents Excellent 20.0% 22.4% Good 47.3% 51.3% Fair 25.6% 22.1% Poor 6.3% 3.4% No opinion 0.8% 0.8% Totals
64 Correlations of quality of travel in Eugene COA All respondents Rated the quality of travel in Eugene as excellent: Respondents who biked or walked for non-recreational purposes in the last seven days were more likely to rate the quality of travel in Eugene as excellent. Respondents who used public transportation in the last seven days were more likely to rate the quality of travel in Eugene as excellent. Respondents who were very familiar with the MovingAhead project were more likely to rate the quality of travel in Eugene as excellent. MovingAhead Eugene respondents Rated the quality of travel in Eugene as good: Respondents who drove a single-occupancy vehicle in the last seven days were more likely to rate the quality of travel in Eugene as good. Rate the quality of travel in Eugene as fair: Respondents who drove a single-occupancy vehicle in the last seven days were also more likely to rate the quality of travel in Eugene as fair. No other statistically significant relationships to report. 22
65 How would you rate the quality of travel in the Springfield area? All respondents as a group were more satisfied with the quality of travel in the Springfield area than were Eugene-based respondents. 60% of all respondents rated the quality of travel in the Springfield area as good (48%) or excellent (12%), compared to 56% of respondents in Eugene who rated the quality of travel in their neighborhood as good (45%) or excellent (11%). 6% of all respondents and 4% of Eugene respondents rated the quality of travel as poor. There was not a meaningful difference between Eugene residents and other participants in terms of how they rated the quality of travel around Springfield. COA All respondents MovingAhead Eugene respondents Excellent 12.3% 11.2% Good 47.8% 45.2% Fair 28.3% 31.1% Poor 5.5% 4.2% No opinion 6.0% 8.4% Totals
66 Correlations of quality of travel in Springfield MovingAhead Eugene respondents Rated the quality of travel in Springfield as good: Respondents who traveled to visit friends or family less in the last seven days were more likely to rate the quality of travel in Springfield as good. No other statistically significant relationships to report 24
67 Why did you travel within the Eugene-Springfield area in the last seven days? Travel for everyday life, such as for shopping or errands, is the top reason participants traveled within the Eugene- Springfield area (81% among all respondents, 86% among Eugene respondents). About half of participants said they traveled to see friends or family in the last seven days (48% among all respondents, 47% among Eugene respondents). Commuting to and from work was another common reason for travel (42% among all respondents, 45% among Eugene respondents). Eugene residents were not so different from other respondents with respect to their reasons for traveling around the area. COA All respondents MovingAhead Eugene respondents Travel for everyday life 80.6% 86.2% Visiting friends or family 47.8% 46.9% Commute to and from work 42.4% 45.1% Recreational activities 39.4% 43.2% Medical appointments 33.6% 33.3% Commute to and from school 12.6% 12.5% Other 1.3% 1.8% Totals Other includes travel to the airport and business-related travel. 25
68 Correlations of reasons for travel in the Eugene-Springfield area COA All respondents Commuted to and from work: Respondents under 65 years old were more likely to have commuted to and from work. Respondents who drove a single-occupancy vehicle or used a vanpool in the last seven days were more likely to have commuted to and from work. Respondents from households earning over $35,000 per year, with 2 or more vehicles, or with at least one bicycle were more likely to have commuted to and from work. Respondents who rated the quality of travel in the neighborhood as fair, good, or excellent were more likely to have commuted to and from work (respondents who rated it good were the most likely). Commuted to and from school: Respondents in urban areas (respondents in rural areas were the least likely) were more likely to have commuted to and from school. Respondents from households with more bicycles were more likely to have commuted to and from school. Respondents who used car sharing services were more likely to have commuted to and from school. Respondents who were more familiar with the MovingAhead project were more likely to have commuted to and from school. Traveled for recreational activities: Respondents younger than 55 were more likely to have traveled for recreational activities. Respondents from households with more bicycles were more likely to have traveled for recreational activities. Respondents who walked for non-recreational purposes were more likely to have traveled for recreational activities. Visited friends or family: Respondents who walked or biked for non-recreational purposes were more likely to have visited friends or family. 26
69 Correlations of reasons for travel in the Eugene-Springfield area MovingAhead Eugene respondents Commuted to and from work: Respondents who drove a single-occupancy vehicle were more likely to have commuted to and from work. Respondents from households with a motorized vehicle or earning over $35,000 per year were more likely to have commuted to and from work. Commuted to and from school: Respondents who walked for non-recreational purposes in the last seven days were more likely to have commuted to and from school. Respondents who were somewhat familiar with the MovingAhead project were more likely to have commuted to and from school. Traveled for recreational activities: Respondents under 55 years old were more likely to have traveled for recreational activities. Respondents who own a bicycle (respondents with 4 or bicycles were the most likely) were more likely to have traveled for recreational activities. Respondents who walked for non-recreational purposes in the last seven days were more likely to have traveled for recreational activities. Visited friends or family: Respondents who own a bicycle (respondents with 4 or more bicycles were the most likely) were more likely to have visited friends or family. Respondents from households earning $25,000 to less than $50,000 per year or $150,000 to less than $200,000 per year were more likely to have visited friends or family. Respondents who walked for non-recreational purposes in the last seven days were more likely to have visited friends or family. Traveled to medical appointments: Respondents aged 55 to 64 (those under 25 were the least likely) were more likely to have traveled to medical appointments. Respondents who own 2 vehicles or less were more likely to have traveled to medical appointments 27
70 Please select all of the methods you used to travel in the Eugene-Springfield area in the last seven days. Driving alone was the most common way participants traveled in the Eugene-Springfield area in the last seven days (70% among all respondents, 72% among Eugene residents). Over half of all participants carpooled (57% among all respondents, 53% among Eugene residents), and over one-third said they walked for non-recreational purposes (34% among all respondents, 38% among Eugene residents). Eugene residents were not so different from other respondents with respect to their travel modes around the area with the exception of transit use (slightly lower among Eugene residents). COA All respondents MovingAhead Eugene respondents Single-occupant vehicle 70.3% 71.9% Carpool 56.5% 52.6% Walk (non-recreational) 33.8% 38.3% Public transit or school bus 29.9% 21.1% Bicycle (non-recreational) 12.3% 10.4% Car sharing service 4.3% 2.1% Vanpool 3.6% 2.6% Motorcycle 3.0% 1.8% Taxi 2.4% 2.9% Other 2.1% 2.6% Totals Other includes RideSource van, golf cart, and motorized wheelchair. 28
71 Correlations of methods of travel in the Eugene-Springfield area COA All respondents (I) Drove in a single-occupancy vehicle in the last seven days: Respondents who commuted to and from work in the last seven days were more likely to have driven in a singleoccupancy vehicle in the last seven days. Respondents who did NOT drive carpool or use public transit or a school bus in the last seven days were more likely to have driven in a single-occupancy vehicle in the last seven days. Respondents who rated the quality of travel in their neighborhood fair or good were more likely to have driven in a single-occupancy vehicle in the last seven days. Carpooled in the last seven days: Respondents who were under 45 years old were more likely to have carpooled in the last seven days. Respondents from households with more vehicles were more likely to have carpooled in the last seven days. Respondents who did NOT drive a single-occupancy vehicle in the last seven days were more likely to have carpooled in the last seven days. Used public transit or a school bus in the last seven days: Respondents who were younger than 55 years old were more likely to have used public transit or a school bus in the last seven days. Respondents from households with fewer vehicles were more likely to have used public transit or a school bus in the last seven days. Respondents who biked or walked for non-recreational purposes in the last seven days were more likely to have used public transit or a school bus in the last seven days. Respondents who did NOT drive a single-occupancy vehicle in the last seven days were more likely to have used public transit or a school bus in the last seven days. Respondents who rated the quality of travel in the neighborhood good, or excellent (respondents who rated it excellent were the most likely) were more likely to have used public transit or a school bus in the last seven days. Respondents who were more familiar with the MovingAhead project were more likely to have used public transit or a school bus in the last seven days. 29
72 Correlations of methods of travel in the Eugene-Springfield area COA All respondents (II) Biked for non-recreational purposes in the last seven days: Respondents in urban areas were more likely to have biked for non-recreational purposes in the last seven days (respondents in rural areas were the least likely to say this). Respondents who walked for non-recreational purposes or used a vanpool, a motorcycle, car sharing services, public transit, or a school bus in the last seven days were more likely to have biked for non-recreational purposes in the last seven days. Respondents who were more familiar with the MovingAhead project were more likely to have biked for nonrecreational purposes in the last seven days. Vanpooled in the last seven days: Respondents who were urban respondents were more likely to have vanpooled in the last seven days. Respondents who biked for non-recreational purposes or used car sharing services in the last seven days were more likely to have vanpooled in the last seven days. Respondents who were more familiar with the MovingAhead project were more likely to have vanpooled in the last seven days. Used a motorcycle in the last seven days: Respondents who biked for non-recreational purposes or used car sharing services in the last seven days were more likely to have used a motorcycle in the last seven days. Walked for non-recreational purposes in the last seven days: Respondents in urban or suburban areas were more likely to have walked for non-recreational purposes in the last seven days. Respondents from households without a vehicle were more likely to have walked for non-recreational purposes in the last seven days. Respondents who traveled to participate in recreational activities or visit friends and family were more likely to have walked for non-recreational purposes in the last seven days. Respondents who biked for non-recreational purposes or used public transit in the last seven days were more likely to have walked for non-recreational purposes in the last seven days. 30
73 Correlations of methods of travel in the Eugene-Springfield area COA All respondents (III) Used car sharing in the last seven days: Respondents who commuted to and from school were more likely to have used car sharing in the last seven days. Respondents who biked for non-recreational purposes, vanpooled, or used a motorcycle in the last seven days were more likely to have used car sharing in the last seven days. Respondents who were more familiar with the MovingAhead project were more likely to have used car sharing in the last seven days. 31
74 Correlations of methods of travel in the Eugene-Springfield area MovingAhead Eugene respondents (I) Traveled using a single-occupancy vehicle: Respondents older than 45 years old were more likely to have traveled using a single-occupancy vehicle. Respondents from a household with at least one motorized vehicle were more likely to have traveled using a singleoccupancy vehicle. Respondents who rated the quality of travel in Eugene fair or good were more likely to have traveled using a singleoccupancy vehicle. Carpooled: Respondents younger than 45 years old were more likely to have carpooled. Women were more likely to have carpooled. Respondents from a household with at least one motorized vehicle were more likely to have carpooled. Used transit or a school bus: Respondents younger than 55 years old were more likely to have used transit or a school bus. Respondents who own 1 vehicle or do not own a vehicle (respondents without a vehicle were the most likely) were more likely to have used transit or a school bus. Respondents who did NOT drive a single-occupancy vehicle in the last seven days were more likely to have used transit or a school bus. Respondents who biked or walked for non-recreational purposes, or used a taxi in the last seven days were more likely to have used transit or a school bus. Respondents who were very familiar with the MovingAhead project were more likely to have used transit or a school bus. 32
75 Correlations of methods of travel in the Eugene-Springfield area MovingAhead Eugene respondents (II) Walked for non-recreational purposes: Respondents who biked for non-recreational purposes or used public transit or a school bus in the last seven days were more likely to have walked for non-recreational purposes. Respondents who were from households with fewer motorized vehicles (respondents without a vehicle were the most likely) were more likely to have walked for non-recreational purpose. Biked for non-recreational purposes: Respondents who own 1-3 bikes were more likely to have biked for non-recreational purposes. Respondents who walked for non-recreational purposes, used public transit or a school bus, or took a taxi in the last seven days were more likely to have biked for non-recreational purposes. Respondents who were familiar with the MovingAhead project were more likely to have biked for non-recreational purposes. Took a taxi: Respondents who biked for non-recreational purposes or used public transit or a school bus in the last seven days were more likely to have taken a taxi. 33
76 How familiar are you with the MovingAhead project? The majority of respondents were not familiar with the MovingAhead project (80% among all respondents, 83% among Eugene residents). 5% of participants said they were very familiar with MovingAhead (5% among all respondents and Eugene residents). There was not a meaningful difference between Eugene residents and other participants in terms of their familiarity with MovingAhead. COA All respondents MovingAhead Eugene respondents Very familiar 5.1% 4.7% Somewhat familiar 14.6% 12.4% Not at all familiar 80.3% 82.9% Totals
77 Correlations of familiarity with MovingAhead COA All respondents Very familiar with MovingAhead: Respondents who vanpooled, biked for non-recreational purposes, used car sharing, or took public transit or a school bus in the last seven days were more likely to be very familiar with MovingAhead. Respondents who rated the quality of travel in Eugene excellent were more likely to be very familiar with MovingAhead. Somewhat familiar with MovingAhead: Respondents who vanpooled, biked for non-recreational purposes, used car sharing, or took public transit or the school bus in the last seven days were more likely to be somewhat familiar with MovingAhead. Respondents who rated the quality of travel in Eugene good or excellent were more likely to be somewhat familiar with MovingAhead. No other statistically significant relationships to report. MovingAhead Eugene respondents Very familiar with the MovingAhead: Respondents who used public transit or a school bus in the last seven days were more likely to be very familiar with the MovingAhead. Respondents who biked for non-recreational purposes in the last seven days were more likely to be very familiar with the MovingAhead. Somewhat familiar with the MovingAhead: Respondents who biked for non-recreational purposes in the last seven days were more likely to be somewhat familiar with the MovingAhead. No other statistically significant relationships to report. 35


78 Appendices 36
79 Appendix A: Demographics, COA All Respondents Gender Male: 28% Female: 72% Other: 0.5% Age 18-24: 12% 25-34: 23% 35-44: 18% 45-54: 13% 55-64: 19% 65-74: 13% 75+: 2% Ethnicity Hispanic, Latino, or Spanish: 12% Race American Indian or Alaska Native: 2% Asian/Asian American: 2% Black/African American: 2% Native Hawaiian or other Pacific Islander: 0.3% White: 92% Other race or combination of races: 1% Household Income Less than $25,000: 24% $25,000 less than $35,000: 17% $35,000 - less than $50,000: 19% $50,000 - less than $75,000: 20% $75,000 less than $100,000: 9% $100,000 - less than $150,000: 8% $150,000 - less than $200,000: 2% $200,000 or more: 1% Area Rural: 21% Suburban: 44% Urban: 34% Number of motorized vehicles 0: 9% 1: 32% 2: 38% 3: 16% 4 or more: 5% Number of bicycles 0: 27% 1: 20% 2: 32% 3: 12% 4 or more: 9% Field of Work Agriculture: 0.5% Architecture: 0.5% Arts: 3% Customer Service: 8% Education: 8% Finance: 2% Food Service: 4% Government: 2% Healthcare: 9% Hospitality and Tourism: 3% Human Services: 4% Information Technology: 2% Law: 0.3% Lobbying: 0.3% Manufacturing: 2% Marketing or Market Research: 1% Natural Resources: 0.3% Planning/Land Use: 0.3% Religious/Spiritual/Faith: 1% Retired: 18% Student: 5% Transportation or Transit: 1% None of the above: 26% 37
80 Appendix B: Demographics, MovingAhead Eugene Respondents Gender Male: 28% Female: 71% Other: 0.5% Age 18-24: 13% 25-34: 21% 35-44: 17% 45-54: 13% 55-64: 19% 65-74: 15% 75+: 3% Ethnicity Hispanic, Latino, or Spanish: 14% Race American Indian or Alaska Native: 2% Asian/Asian American: 2% Black/African American: 2% Native Hawaiian or other Pacific Islander: 0.5% White: 92% Other race/combination of races: 1% Household Income Less than $25,000: 25% $25,000 less than $35,000: 18% $35,000 - less than $50,000: 16% $50,000 - less than $75,000: 19% $75,000 less than $100,000: 9% $100,000 - less than $150,000: 9% $150,000 - less than $200,000: 2% $200,000 or more: 2% Area Rural: 10% Suburban: 50% Urban: 41% Number of motorized vehicles 0: 8% 1: 33% 2: 38% 3: 17% 4 or more: 5% Number of bicycles 0: 29% 1: 21% 2: 30% 3: 11% 4 or more: 9% Field of Work Agriculture: 0.5% Architecture: 0.5% Arts: 4% Customer Service: 8% Education: 9% Finance: 2% Food Service: 5% Government: 2% Healthcare: 8% Hospitality and Tourism: 3% Human Services: 4% Information Technology: 2% Law: 0.3% Lobbying: 0.3% Manufacturing: 2% Marketing or Market Research: 1% Natural Resources: 1% Planning/Land Use: 0.3% Religious/Spiritual/Faith: 1% Retired: 18% Student: 6% Transportation or Transit: 1% None of the above: 23% 38

81 Appendix C: Distribution of Respondents 39


82 Survey Instrument 40


83 Survey Instrument 41


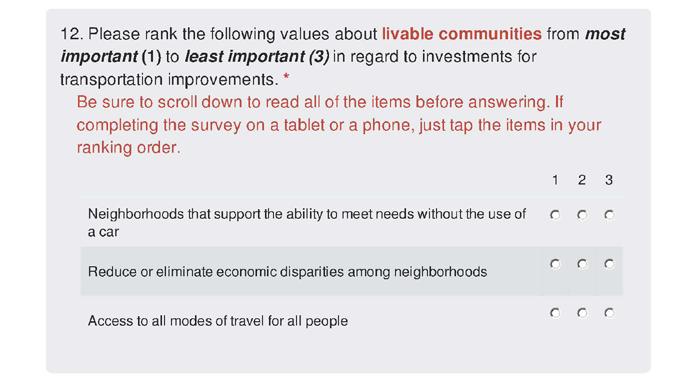


84 Survey Instrument 42


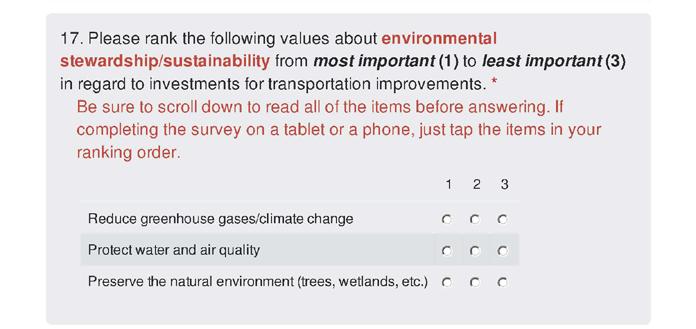
85 Survey Instrument 43


86 Survey Instrument 44


87 Survey Instrument 45