Chapter 6. Inventory Costing - Periodic
|
|
|
- Walter Griffin
- 5 years ago
- Views:
Transcription
1 Chapter 6 Inventory Costing - Periodic
2 Periodic Inventory Valuation a physical count of inventory is taken at the end of the fiscal year to determine how many units make up ending inventory. Throughout the year, the inventory amount is often estimated, because it is expensive and difficult to do a physical count, except at year end, when it's required.
3 Options for the Valuation of Inventory Specific Identification Actual Flow of Goods FIFO (First in First Out) LIFO (Last in First Out) Average Cost
4 Specific Identification Each item matched with actual cost usually used with expensive or unique items this method used if sell a fairly low variety of items and can identify each one easily, either because it's unique, or it may have a serial number. Some examples: cars, art, electronics, etc. If a business can use this method, it is easy to record the cost of items, while they're in inventory and when they're sold. When inventory costs are rising, a company can take advantage of this method by selling off the cheapest inventory to show a high Net Income (low cost of goods sold).
5 Specific Identification Valley Electronics buys three identical LCD TVs at cost of $700, $750, $800 -during the year two are sold at selling price of $1200 each. -Dec 31 determined that the $750 LCD TV is still on hand therefore ending inventory is $750 COGS is $1500 ($700+$800)
6 FIFO (First In, First Out) goods that are purchased first, are sold first (think conveyor belt i.e. perishables)
 2005 80 units were")
7 FIFO (First In, First Out) Athabasca Company (periodic inventory system) units were sold:
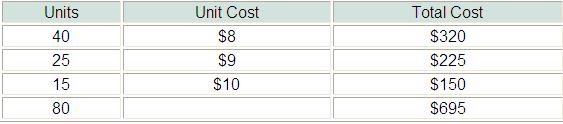
8 FIFO

9 LIFO (Last in First Out) The last goods purchased are sold first, much like a pile of logs. The last logs purchased will be on top and will be sold first. This method is suitable if the company has a similar flow of goods.
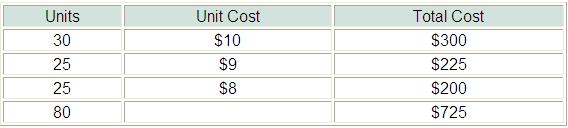
10 LIFO

11 Average Cost Method When inventory is mixed together when comes in, an average of the costs over the period can be used to value inventory. very hard to tell which piece of inventory is which and which will be sold first. That is when this method is most appropriate. Hardware stores that sell items like these bolts in bulk, might use this method.
12 In Canada, FIFO is the most popular method of inventory valuation; LIFO is not allowed because of Income Tax regulations, but is occasionally used for business analysis.
13 Journal Entries For the purchase of new inventory, the journal entry is: Date Purchases XXXX Bank or Accounts Payable XXXX To record the purchase of inventory For a sale, the journal entry is: Date Cash or A/R 2,000 Sales 2,000 To record a sale The inventory is adjusted when you close the books at the end of the accounting period.
14 Effects on Financial Statements Using the information from our Athabasca example: U3/BAT4MPU3A02/mme/Inventory%20Comparison.htm

15 Effects on Income Statement
16 Effects on Income Statement Period of rising prices: FIFO produces a higher income. FIFO reports the highest income and LIFO the lowest. Average cost falls somewhere in the middle. To management, higher net income is an advantage. It causes external users to view the company more favourably. Also, if management bonuses are based on net income, FIFO will provide the higher income for higher bonuses.
17 Effects on Income Statement Period of falling prices: the results from the use of FIFO and LIFO are reversed. FIFO will report the lowest income and LIFO the highest. If prices are stable, all three cost flow assumptions will report the same results.
18 Balance Sheet Implications account affected is Merchandise Inventory This account will have the same value as the Ending Inventory on the Income Statement. Assets for a company will be highest using FIFO and lowest using LIFO, in a period of rising prices. WHY? FIFO gives the best balance sheet valuation
19 Analysis of Inventory Inventory is usually the largest current asset on the balance sheet and the largest expense (COGS) on the income statement Therefore these numbers are critical for analyzing how well a company manages its inventory
20 Analysis of Inventory value of inventory items sometimes fall below cost due to changes in technology or style When the value of inventory is lower than its cost, the inventory is written down to its market value. done by valuing the inventory at the lower of cost and market (LCM) in the period in which the decline occurs
21 Inventory Turnover Ratio Cost of goods sold average inventory The number of times inventory turns over during a given period Average inventory is usually average of beginning and ending inventories
22 Days Sales in Inventory Days in year inventory turnover ratio The number of days on average that the inventory is on hand before being sold