Investor Presentation. January, 2019
|
|
|
- Oscar Norman
- 5 years ago
- Views:
Transcription

1 Investor Presentation January, 2019
2 Safe Harbor Statement This presentation contains "forward-looking statements" within the meaning of the safe harbor provisions of the Private Securities Litigation Reform Act of 1995, including but not limited to statements regarding the company s overall business, market leadership, total addressable market, expectations regarding product development milestones, future marketing initiatives, future sales and expenses and revenue guidance for 2018 and These forward-looking statements are made as of the date of this presentation and are based on current expectations, estimates, forecasts and projections as well as the beliefs and assumptions of management. Words such as "expect," "anticipate," "should," "believe," "target," "project," "goals," "estimate," "potential," "predict," "may," "will," "could," "intend," variations of these terms or the negative of these terms and similar expressions are intended to identify these forward-looking statements. Forward-looking statements are subject to a number of risks and uncertainties, many of which involve factors or circumstances that are beyond the company s control. The company s actual results could differ materially from those stated or implied in forward-looking statements due to a number of factors, including but not limited to: the company s ability to maintain and increase sales; the availability of funding for the company s customers to purchase the company s solutions; the complexity, expense and time associated with contracting with government entities; the company s ability to maintain and expand coverage of existing public safety customer accounts and further penetrate the public safety market; the company s ability to sell its solutions into new markets; the lengthy sales cycle for the company s solutions; changes in federal funding available to support local law enforcement; the company s ability to innovate and expand its product development, the company s ability to deploy and deliver its solutions; and the company s ability to maintain and enhance its brand. In addition, other factors that could impact actual results to differ from the forward-looking statements we make are described in the reports we file with the Securities and Exchange Commission (available at particularly in the Risk Factors section of our latest Quarterly Report on Form 10-Q. Except as required by law, we assume no obligation to update these forward-looking statements publicly, or to update the reasons why actual results could differ materially from those anticipated in the forward-looking statements, even if new information becomes available in the future. Page 2
3 I. SUMMARY Page 3

4 At a Glance ShotSpotter is the leading provider of GUNFIRE DETECTION SOLUTIONS that help law enforcement and security personnel rapidly identify, locate, and respond to gun violence. 13, In Sensors deployed >650 Municipalities and cities Square miles under contract as of September 30, 2018 Our solution is a strategic resource allocation tool that enables an effective and efficient response to PREVENTING AND REDUCING GUN VIOLENCE. >99K alerts sent in 2017 >700K gunshots in our database Offered as an easy to acquire and use hosted solution sold on an ANNUAL SUBSCRIPTION BASIS. 35% YoY revenue growth (Q3 18) 32 Page 4
5 Investor Highlights Large Target Market ~ 1,400 US cities (1) ; ~ 200 cities overseas (1) ; ~5,000+ campuses (1) and ~1,800 transportation hubs (1) ~$1.3B estimated annual spend Industry Leader Proprietary Advanced Technology Attractive SaaS Model Proven Growth Strategy The market leader in acoustic gunshot detection solutions; No real competitors Over 90 cities and municipalities covering over 650 square miles (under contract) as of September 30, issued patents and advanced acoustic sensor/analytic platform 24/7/365 coverage delivering real-time, precise, and actionable alerts Recurring, high-margin revenue; strong projected revenue growth High 141% Revenue Retention Rate (2017) High sales & marketing efficiency of $0.34 sales & marketing spend per $1.00 of new sales (2017) Expand public safety customer base; Further penetrate existing customers Leverage brand recognition to grow ShotSpotter Missions & security solutions businesses (campus, etc.) Partner with Smart Cities solution providers (ATT/GE/Verizon) to develop new use-cases and applications 1. Includes US cities with 4+ homicides per 100,000 residents in 2015; overseas cities consists of outside the US with at least 500,000 residents; campuses consists of college campuses and airports in the US; transportation hubs includes [airports bus terminals etc.] Page 5
6 II. INDUSTRY OVERVIEW Page 6
7 Gun Violence Many urban communities are under siege due to gun violence. Yet, residents call police 20% LESS THAN OF THE TIME(1) When they do call, the information is usually late, inaccurate and incomplete. Active Shooter Incidents becoming an increasingly tragic reality. Often 3-5 minutes before the first 911 call. Rapid law enforcement and EMT response can save lives. 1. The Brookings Institute, 2016 Page 7


8 Total Addressable Market (TAM) Cities Sq. Miles Opportunities Chicago 100+ Philadelphia NYC 60+ Los Angeles Washington DC 19 Dallas San Francisco 13 Puerto Rico Denver 13 Seattle Boston 12 Houston Baltimore Jacksonville Atlanta San Diego 4 CORE DOMESTIC PUBLIC SAFETY MARKET OPPORTUNITY Currently in over 90 cities and municipalities representing over 650 square miles sold as of September 30, 2018; ~6 miles covered per city We estimate 1,400 domestic cities x 400,000 / year = ~$560 million annually EXISTING DEPLOYMENTS IN 10 OF TOP 25 CITIES IN THE U.S. Charlotte We estimate we are only <10% penetrated in our core market opportunity 1. Source: National Center for Education Statistics GROWTH DRIVERS & ADDITIONAL OPPORTUNITIES Expand Internationally ~200 cities in Latin America, South Africa, Europe Leverage Cape Town Success Expand SecureCampus solutions ~1,900 campuses with 2,000+ students in the U.S. (1) Nine (9) campus deployments to date Drive Intelligent City Solutions Relationships with Verizon, AT&T & GE Core solutions extensions / TAM Expansion ShotSpotter Missions Analysis / Reporting / Predictive (BIG DATA) Case management Highway deployment Targeted strategic M&A Selectively review strategic adjacencies / targets We believe our total addressable market represents a $1.3B annual revenue opportunity Page 8
9 III. SOLUTIONS Page 9

10 How Our Solutions Work A gun is fired. The sound of the explosion (impulse) radiates in a sphere. Multiple sensors in the coverage area are triggered and time stamped based on impulse detection. Based on the multiple time stamps, the location of the gunfire is triangulated within seconds. ShotSpotter s software and acoustic experts review and qualify data for outdoor gunfire. A qualified alert is then sent to subscribers as well as video management systems. Officers arrive to precise gunshot location with faster response time and greater situational awareness and preparation. Post incident data can include analysis of aggregated data for resource allocation or specific alert data in a court accepted Detailed Forensic Report. Page 10
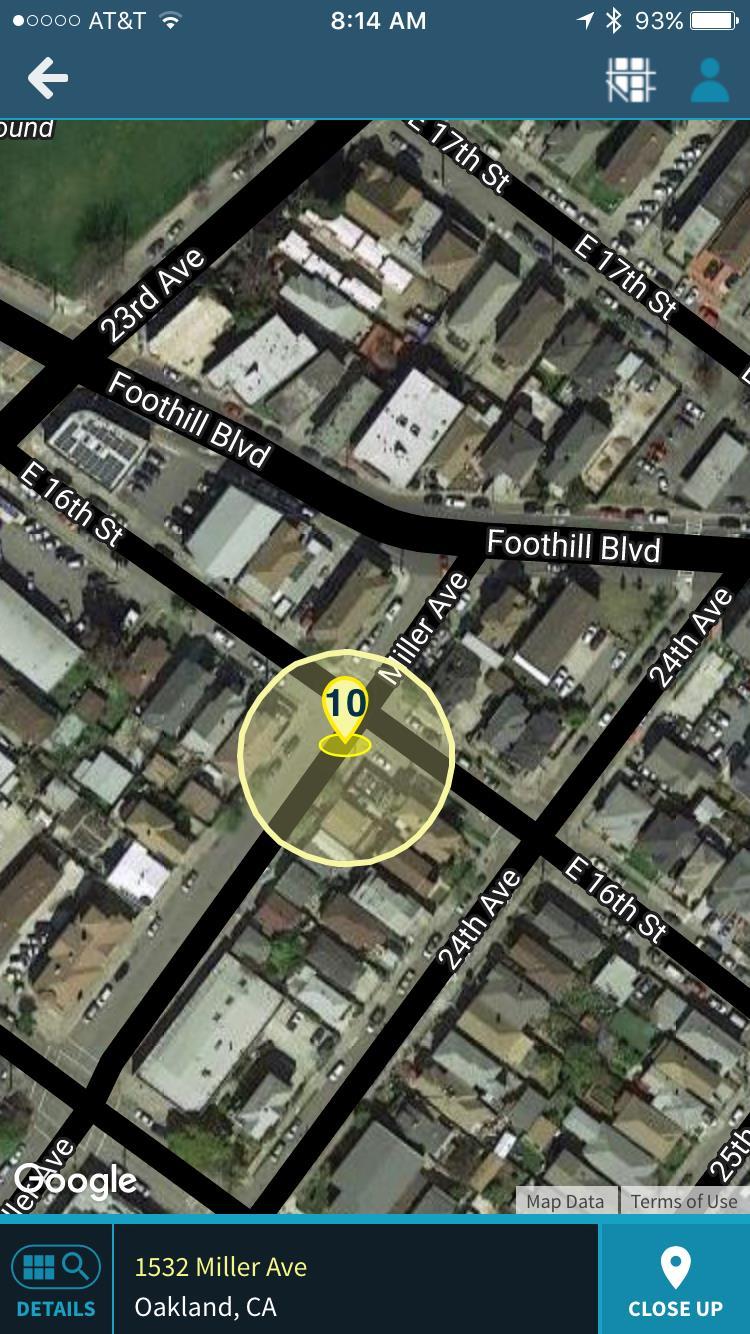

11 ShotSpotter Alerts Page 11
12 IV. CUSTOMERS & GROWTH Page 12


13 Select Customers CUSTOMERS SST BRANDED SOLUTION SMART CITY PARTNERS Page 13


14 Land and Expand Strategy 120 CHICAGO LIVE MILE INCREASE 100 > x Increase In coverage The Chicago Police Department will be expanding its gunshot detection capabilities and their integration with other crimefighting technology into six patrol districts, a police spokesman said Friday night. This means that more than half of the city's 22 patrol districts will be using ShotSpotter and other technology to help Chicago police better predict where shootings may occur, in the hopes of allowing officers to respond more quickly to violence Initial miles at deployment Phase 1 Phase 2 Phase 3 Phase 4 Phase 5 Executed Phases Through 6/30/18 Page 14


15 Media Coverage ShotSpotter was mentioned Over 10,000 times in national and local print and broadcast media in 2018 so far C A S E S T U D Y Page 15
16 V. BUSINESS MODEL / FINANCIALS / KPIs Page 16
17 SaaS Recurring Revenue Model 10 9 $8.9 $ $4.6 $4.6 $5.8 $6.8* $6.5 $6.9 Nearly 100% of revenue is subscription-based Q416 Q117 Q217 Q317 Q417 Q118 Q218 Q318 Revenues in millions of dollars *Includes ~$900K in revenue from termination of Puerto Rico/USVI Page 17
18 Strong Revenue Growth and Operating Leverage CAGR Revenue Growth 42% Revenue Growth YTD 45% 25 $ $ Revenue and Gross Profit in millions of dollars and Gross Margin in percent of Revenue $ % 30% $ % 38% 49% $ % 49% 50% 54% YTD Thru Q YTD Thru Q Gross Profit Revenue Gross Profit Revenue Page 18
19 Attractive Customer Economics In 2017 the company spent 34 to generate $1 of new annualized revenue WHILE ACHIEVING REVENUE RETENTION 141% Page 19
20 Strong Deferred Revenue Growth & Balance Sheet Total Deferred Revenue in millions of dollars Long-term Deferred Revenue $13.9 $3.1 $18.5 $2.7 $15.8 $20.4 $1.2 $19.2 Short-term Deferred Revenue $ /31/16 12/31/17 9/30/18 Strong Balance Sheet - >$12 million in Cash Untapped Line of Credit - $10M with potential to grow to $25M Page 20
21 Financials: Selected Income Statement Data & KPIs YEAR ENDED 12/31 PERCENTAGE YTD THROUGH PERCENTAGE YTD $ 000 s Q317 Q318 Q317 Q318 Revenue $15,507 $23, % 100.0% $17,244 $25, % 100.0% Gross profit 5,958 11, % 48.8% 8,424 13, % 54.4% Operating expenses Sales and marketing 4,475 6, ,269 6, Research & development 4,093 4, ,024 3, General & administrative 2,362 5, ,206 6, Total operating expenses 10,930 15, % 67.0% 10,499 16, % 66.5% Operating loss $(4,972) $(4,333) (32.1%) (18.2%) (2,075) (3,035) (12.0%) (12.1%) Adjusted EBITDA* $(2,909) $(4,957) (18.6%) (20.9%) (3,730) 1,458 (21.6%) 5.82% Revenue retention rate 127.0% 141.0% Marketing spend per $1.00 of new annualized contract value** $0.28 $0.34 *Adjusted EBITDA - All in (000 s) - 12/31/16 NL ($6,860) plus net interest $1,317, D&A of $2,551 and SBC of $83 = ($2,909) 12/31/17 NL ($9,980) plus net interest $1,114, income taxes of $160, D&A of $3,121, and SBC of $628 = ($4,957) YTD Q NL ($7,477) plus net interest $1,167, D&A of $2,274 and SBC of $306 = ($3,730) YTD Q NL ($3,027) less net interest $72, less Income tax benefit of $32, Plus D&A of $2,766 and SBC of $1,823 = $1,458 ** Values for 2016 and 2017 were calculated under ASC 605 Page 21
22 Financial Highlights Summary Annual subscription-based SaaS revenue Efficient sales & marketing = Low customer acquisition costs High margin & low variable costs Rapid cash payback of installation costs Significant leverage in every operating expense category Low customer attrition/churn = High revenue retention Goal of cultivating 10+ year relationships = High lifetime value of a customer Page 22