Year End Results Presentation to 30 June Motoring To Be Inserted
|
|
|
- Simon Pope
- 5 years ago
- Views:
Transcription


1 Year End Results Presentation to 30 June 2011 Motoring To Be Inserted

2 Organisational Structure * * Denotes new brands since 30 June 2010
3 Performance Update
4 Operational Overview Operational Performance Continued strong growth in automotive enquiry volumes up 15% on pcp. Enquiry volumes on new cars up 29% on pcp. New car inventory levels in line with the same time last year. Overall automotive inventory remained over 200,000 cars online. Strong double digit growth in private ad volumes on pcp. Strong ongoing growth in display advertising sales. Mediamotive revenue growing 51% on pcp. Non automotive verticals all performed well, with bikes; caravan & camping highlights. Livemarket customer acquisition continues to grow. On Market share buy back program commenced with 670,578 shares acquired and cancelled by the company in early July. Many significant new product releases completed throughout the year with many planned for coming months. Market Dynamics Automotive industry has had to deal with the natural disasters in both Japan and Queensland earlier in the year, to date these have had minimal financial impact on the company, which we expect to remain the case. Mobile continuing to grow as a channel again registering +300% growth in page impressions on pcp in automotive. Mobile now accounts for 13% of carsales automotive traffic and larger than competitors desktop sites based on page impressions. carsales once again continued its growth in market leadership.
. Final FY2011 dividend of 10.5 cents per share declared (Interim FY2011 dividend of 9.")

5 Financial Overview Continued solid growth in Operating Revenue to $152.5m, up 26% on pcp. EBITDA up 30% on pcp to $83.8m and EBITDA margins at 55%. Operating cashflow of $60.1m, up 19% on pcp. EPS of 25.0 cents per share, up 34% on prior full year (H2 FY cents per share, up 27% on prior H2). Final FY2011 dividend of 10.5 cents per share declared (Interim FY2011 dividend of 9.4 cents per share). Capex spend of $1.4m, down 33% on pcp, *excluding the $1.0m acquisition of Oztion assets and $1.5m in multiple domain name acquisitions. Headcount rose to 366 full time equivalents up 22% on pcp The profit impact to the group of the September acquisition of Oztion assets was negligible. $A Millions Growth Year Ending 30 June 2011 FY2010 FY2011 $'s % Operating Revenue (Excluding Interest Revenue) Online Advertising % Data & Research % Total Operating Revenue % Operating Expenses (Before Interest and D&A) % EBITDA % EBITDA Margin 53% 55% D&A % EBIT % Net Interest Expense 0.2 (1.0) (1.2) (600%) Profit Before Tax % Income Tax Expense % Net Profit After Tax % Earnings Per Share (cents) % Net Operating Cashflow (Before Capex) % Capex* (0.7) (33%) Millions OPERATING REVENUE Millions EBITDA Millions NPAT $83.8 $152.5 $120.6 $64.5 $95.9 $43.7 $30.7 $71.9 $28.3 $18.7 $46.2 $17.1 $11.8 $43.2 $58.3 Source: Carsales CAGR 34.8% CAGR 48.9% CAGR 49.1%

6 Revenue Segment Performance $A Millions Growth Year Ending 30 June 2011 FY2010 FY2011 $'s % Operating Revenue Dealer % Private % Display* % Dealer & Data Services % Total Operating Revenue % FY2011 SEGMENT REVENUE * FY2010 revenue re stated to reflect a change in accounting policy, in relation to revenue recognition where certain agency commissions paid are now reflected as reduction in revenue as opposed to an expense. Refer to Annual Report for further details Dealer again delivered a sturdy performance, with used vehicle enquiries growing steadily throughout the year. New vehicle enquiries on both in stock and generic new vehicles both grew strongly throughout H2 FY2011. Customer acquisition continued to rise at a steady rate, with automotive customers now comfortably in excess of 2,800. FY2010 SEGMENT REVENUE Private performed exceptionally well with a combination of strong ad volume growth throughout the year across all verticals and price rises in particular in automotive (standard ad price rose from $50 to $60 from the 2 nd of September 2010) being major growth drivers. Mediamotive continued the rapid growth seen in H1 FY2011, growing 37% in H2 FY2011 on pcp. Dealer and Data services once again performed strongly throughout the year and grew 23% in H2 FY2011 lead largely by the continued growth in Livemarket Source: Carsales Note - Dealer includes Cars, Bikes, Marine, Industry and Caravan camping


7 Operational Metrics Automotive enquiry volumes grew 15% on pcp Automotive Enquiry Volumes Dealer enquiry volumes remained robust growing 11% overall on pcp, with new enquiry volumes particularly on in-stock new cars up 54% on pcp. Private vehicle enquiry volumes continued to grow steadily throughout the year. Automotive inventory volumes remained at around 200,000 vehicles. New car inventory volumes remained stable at around 40,000 cars throughout the year, somewhat impacted by shortages as a result of Japanese tsunami. Dealer used inventory continued to track at around 80,000 cars. Automotive Inventory Private inventory continued to grow at a steady rate up 6% on pcp to over 80,000 cars. Source: Carsales

, which highlights the")

8 Industry Landscape Continued to acquire market share in traffic throughout the year*. Traffic Metrics June % of all time spent looking at automotive classifieds websites around Australia was done on a carsales owned site. Page Impressions generated in June 2011 on the.mobi and iphone applications were similar to those generated by the Fairfax, News Corp and Telstra Automotive Ad Networks desktop sites combined (see the chart below), which highlights the speed in which this market is evolving. Consumers have downloaded more than 366,000 carsales iphone/ipad applications since their launch last year and approaching 40,000 downloads of our bike and marine applications. Page Impressions Mobi & iphone Apps v Competitor Desktop Sites** Traffic Metrics June 2010 * Source: Nielsen Online Market Intelligence, Automotive Ad Networks, Jun 2011 & Jun 2010 **Source: carsales Mobi, carsales Mobi & App: Nielsen, Site Census, Mobile Aggregate, August 2009 to June 2011; Drive, Trading Post & Carsguide (Fairfax, Telstra & News) desktop sites: Nielsen, Market Intelligence, Domestic traffic for audited sites, Australia, June
9 Performance Outlook Ongoing focus on new car dealer customer and inventory acquisition to continue. Trading Conditions A significant number of new products being prepared for deployment over the next financial Outlook year. Mobile / app we expect will continue to grow at a strong rate and will be a key area of ongoing focus. Further investment in headcount anticipated to continue in order to support sales and product development expansion. Continue search for opportunities in appropriate markets that will enhance, leverage or complement current capabilities. Capex spend expected to more than double in the next financial year to cater for a planned relocation of the Melbourne Head Office. Trading for the first six weeks have been solid and a further update to be provided at our October AGM.
10 New Products Released


11 Trading Conditions Outlook Motoring
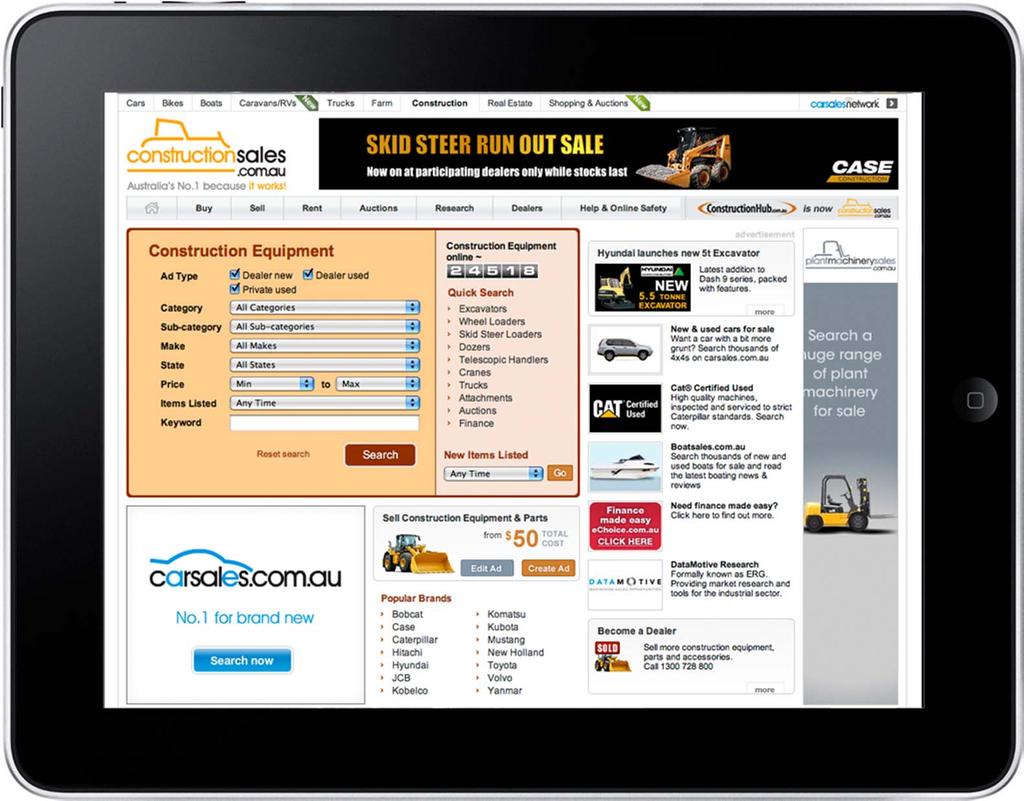


12 Trading Conditions Outlook Apps for Industry
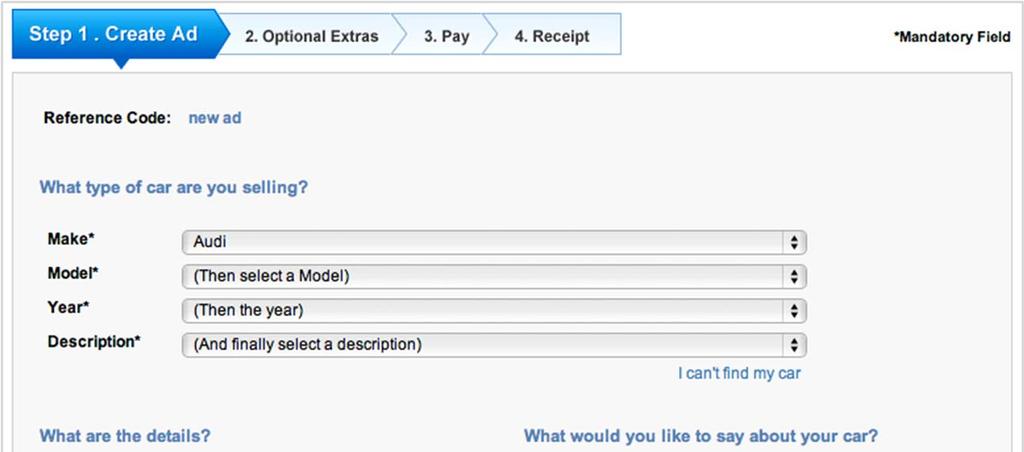
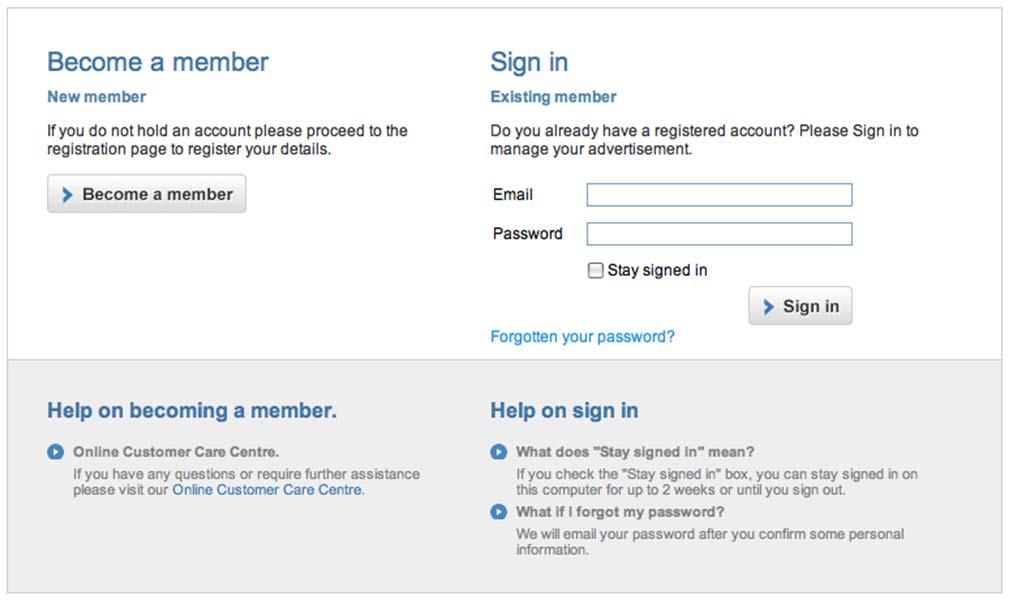
13 Trading Conditions Outlook SSE for Cars

14 Trading Conditions Outlook Autogate for Cars


15 Trading Conditions Outlook New Car Promise