Future priorities for the West Coast Main Line: Released capacity from a potential high speed line
|
|
|
- Meryl Cameron
- 5 years ago
- Views:
Transcription

1 Future priorities for the West Coast Main Line: Released capacity from a potential high speed line January 2012
2
3 Future priorities for the West Coast Main Line: Released capacity from a potential high speed line January 2012
4 Contents Network Rail Foreword 4 1 Introduction 6 Structure of this paper Study purpose and overview 7 2 Research summary & market segmentation Summary of the research conducted Market segmentation How rail users value the constituent elements of the rail service offer 11 3 Conditional outputs London suburban London urban West Midlands suburban London interurban Non-London interurban Freight 15 4 Initial service specification & assessment Potential fast line service pattern The extent to which the conditional outputs can be delivered 19
5 Contents Passenger Focus Foreword 5 1 Management Summary Summary of key findings Background and research approach Findings from the research: existing users of the WCML Differences in priorities of existing users by market segment Findings from the research: potential market among car drivers 25 2 Background and Research Objectives Acknowledgements on the scope of the research 26 3 Methodology Sample: existing users Questionnaire existing users Sample: car drivers who are potential WCML users Interviewing and questionnaire car drivers Weighting 31 4 Findings: Existing users of the WCML Findings from the stated preference task Linear modelling of the stated preference results Non-linear modelling of the stated preference results: creating the model Non-linear modelling: outputs resulting from the model Implications of the findings for the five main market segments Existing users of the WCML other findings 39 5 Findings: potential market among car drivers Findings from the stated preference exercise Core target market among car drivers other key findings from the research 44 Appendix 48
6 Network Rail Foreword West Coast Main Line capacity study: phase one The West Coast Main Line is vital to Britain s economy. It connects many of our largest cities, enabling thousands of people to travel to work and for leisure and a vast array of goods to be delivered to shops and businesses across the country each day. Despite the economic downturn, demand for rail travel continues to grow. Significant investment on the West Coast Main Line means passenger services are now faster and more frequent than ever before, and freight operators have been able to increase their services to meet the demands of their customers. But this is not enough. In 2009 Network Rail published its New lines study into the long-term capacity issues facing the railway. The conclusions were clear. By the end of the next decade, despite all the investment that has been made and all the additional capacity that has and will be provided, the West Coast Main Line will be full. Continuing to rely indefinitely on incremental growth on the existing route would be expensive and highly disruptive. Our analysis concluded that the building of a new high speed line connecting London, the West Midlands and the north of England would not only transform travel between our major cities it would also be the best way of solving the capacity crunch facing the West Coast Main Line. Releasing the train paths currently used by longdistance intercity services provides huge potential for a radical overhaul of services on the West Coast Main Line. But what should be done with this additional capacity to best meet the needs of rail users? Do London commuters want faster journeys or more frequent trains? Do passengers in the West Midlands want less crowding or better connections? Understanding the answers to these questions puts us in a much better position to manage future service provision on the West Coast Main Line. This report represents the first stage of a study into the best uses of the West Coast Main Line if Government s initial proposals for high speed rail are implemented, i.e. a new high speed line between London and Birmingham, with a connection with the existing main line at Lichfield. Drawing on a number of sources, we segmented the West Coast Main Line rail user market, enabling Passenger Focus to provide a detailed, quantitative assessment of the value placed on a range of improvements by different types of rail users. This assessment has been used to produce a series of conditional outputs for each market segment, which could form the building blocks of a future West Coast Main Line timetable. An initial assessment of capacity, which will be used to inform the second stage of this study, suggests that HS2 phase one would enable delivery of the majority of the conditional outputs. These service improvements would be most marked in those places where capacity constraints loom largest on the horizon, such as Northampton and Milton Keynes, with significantly reduced overcrowding, faster journey times and a reduced requirement to change trains. Freight users would also benefit as sufficient capacity could be provided to accommodate growth projections between the south of the route and the West Midlands. This would remove significant numbers of lorries from heavily used sections of the motorway and trunk road network, thereby reducing traffic congestion. The second stage of this study will develop a more detailed understanding of the shorter-term trade-offs between delivery of the specified conditional outputs for the West Coast Main Line, as we look to provide the optimum mix of improvements across the spectrum of rail users. Paul Plummer Network Rail group strategy director 4
7 Future Passenger Priorities for the West Coast Main Line Passenger FocusForeword Passenger Priorities for Released Capacity on the West Coast Main Line If a major new rail line, such as HS2, is built between London and Birmingham this should free up space on the existing lines (the West Coast Mainline WCML ) in two ways. Firstly, if some passengers move to faster services on a new line, this may release capacity on WCML trains. Secondly, if and when fast train services migrate to any new line, this might have the effect of releasing additional track capacity along the WCML. The Department for Transport has asked Passenger Focus, in partnership with Network Rail, to find out what passengers might want from this released capacity. This could be more frequent trains, less crowding, faster journey times, or a lesser need to change trains for a journey. It is likely that any future improvements to train services would attract new passengers to the WCML, so we also gathered the views of car drivers to understand what kind of train service would encourage modal switch. Network Rail has used the findings from this research to develop a set of potential improvements which could be made to WCML services, to provide the greatest benefit to future passengers. If a new line goes ahead, real improvements could be made to the existing service on the WCML, benefiting passengers and potentially attracting new users. Our research has highlighted the key priorities for passengers; over the long term, these will feed into any development of the WCML train services, if a new line goes ahead. Over the short term, these priorities provide useful indicators of how to improve passenger experience on routes along the WCML currently. Colin Foxall Passenger Focus chairman Our research shows that although current passengers are reasonably happy with their train service, there is room for improvement. The quality of their train experience is most influenced by: Crowding on trains passengers dislike overcrowding on trains and really care about getting a seat for their journey Interchange passengers want direct services; the time waiting between trains is inconsequential in itself, passengers do not want to change trains at all. For car drivers, our research found that the most influential factors were: The price of travel car drivers consider the cost of travel first and foremost Direct services they also want direct services if they are to consider switching to train. 5
8 1 West Coast Main Line capacity study: phase one West Coast Main Line capacity study: phase one Examining the best uses of the existing route if Government s proposal for a new high speed line between London and Birmingham is implemented Structure of this paper The structure of the rest of the paper follows the key deliverables of the first stage of the study: Section 2 presents the outcome of the passenger research, namely; a segmentation of the current and likely future WCML users into groups of individuals and businesses that share the same definining characteristics and requirements from the current route, and how these groups would value different service improvements. Section 3 articulates the key future requirements of these market segments through a statement of the conditional outputs that the rail industry should aspire to deliver on the existing route if HS2 phase one were implemented. Section 4 presents an initial analysis of the potential for the capacity released by HS2 phase one to enable delivery of these outputs. The Passenger Focus Research Report follows this paper and presents the detailed research methodology and conclusions.
9 1 Introduction 1.1 Study purpose and overview The Department for Transport (DfT) has asked Network Rail and Passenger Focus to conduct a study to understand the best use of the capacity that would be released on the West Coast Main Line (WCML) if the first stage of proposals for a new high speed rail network were implemented. This first stage (HS2 phase one) is a line between London Euston and Birmingham with a connection into the WCML at Lichfield. The study is split into two stages: The first stage develops an understanding of the key current and potential future groups of individuals and businesses for which the WCML is integral to their social and economic wellbeing, the requirements of these groups articulated as conditional outputs, and the potential for HS2 phase one to enable delivery of these outputs. This first stage will help inform the Department for Transport s (DfT) decision as to whether to progress with development of HS2. The second stage develops a series of train service specifications to deliver these outputs, and an assessment of the economic value and business case for each. This work will be used to support the future planning of the WCML, should DfT decide in favour of progressing HS2. Commencement of the second stage is therefore contingent on this decision. The scope of the study has been limited to journeys on the WCML that could be improved by HS2 phase one. For simplicity this includes all journeys to, from and between sections of the route that would be bypassed by HS2 phase one, and excludes any journeys that would be made on the new line. The study has not considered the WCML in the advent of Government s second stage of proposals for high speed rail, namely the extension of HS2 phase one into a Y-shaped network towards the North West and Yorkshire. However, it is recognised that that HS2 phase one is only the first stage of the proposed eventual network. The main sources of evidence that support this stage of the study have been developed in partnership with or with assistance from other rail and transport industry stakeholder organisations: Passenger Focus has conducted a detailed survey of existing and potential new WCML passengers. This work utilises an analytical technique called stated preference which allows a quantitative assessment of individuals preferences and demand responses to varying levels of the rail service offer, for example journey time. Over 6,000 completed survey responses have been received, making the exercise one of the largest of its type ever conducted in the UK. The work has been peerreviewed by the University of Leeds Institute for Transport Studies. Network Rail has conducted a series of workshops with local authorities to gain their unique perspective on the defining characteristics of groups in the areas which they represent, how they are likely to change over time, and the key attributes that these groups require from the WCML. The Office of Rail Regulation (ORR) has recently established the West Coast Main Line Route Utilisation Strategy (RUS), produced by Network Rail under the governance of a group of over 20 stakeholder organisations. This work is useful for understanding the future requirements of freight users, as the underlying freight demand forecasts have been developed in partnership with and scrutinised by members of the Strategic Freight Network Steering Group, which is the umbrella organisation of Government and rail industry stakeholders responsible for the governance of long-term rail freight planning. This summary paper presents the outputs from the first stage of the study, which have been developed by Network Rail using this evidence. The following report presents Passenger Focus detailed research methodology and conclusions.
10 2 West Coast Main Line capacity study: phase one 2 Summary of research cond This section is split into three sub-sections: A high-level summary of the research that has been conducted, A segmentation of the WCML passenger markets, which has been developed using this research, and An explanation of how the research has estimated the relative value that these groups place on the constituent elements of the rail service offer (e.g. frequency of trains), to enable development of the appropriate conditional outputs for the WCML post implementation of HS2 phase one. 2.1 Summary of the research conducted Passenger Focus has conducted a survey to understand the benefits that people would derive from the improvements to WCML rail services that could be enabled by HS2 phase one. This survey was split between existing WCML passengers, and car users who may be attracted to rail by these improvements. Over 6,000 individuals responded to the survey covering 66 of the most commonly made journeys on the route (e.g. Milton Keynes London). Of these around 5,000 were existing rail passengers and around 1,000 were potential new users. The analytical technique 1 stated preference was used to design the surveys and analyse the data that they produced. This advanced technique has been used in numerous industries to estimate the value that consumers of a product place on the elements that comprise it, where this product does not yet exist. This makes it an ideal mechanism to test the impact of major changes to transport provision. The research has provided two main sets of conclusions, namely: robust estimates of the value that current and potential future rail passengers place on the constituent elements of the WCML service offer that could be improved by HS2 phase one; and a segmentation of the WCML market into groups of passengers with similarities in these estimated values. This research, which is presented in summary below and 8
11 cted & market segmentation in detail in Passenger Focus following report, is one of the largest and most analytically rigorous exercises of its type conducted in the UK for a number of years. In addition to this, discussions with a number of stakeholder organisations and other transport professionals were used to augment this research and sense-check the results. The principal means of this was a series of workshops and discussions were held with the local authorities on or adjacent to the WCML between London and Cheshire. Representatives from 22 of the 40 authorities invited attended one of the sessions. These individuals contributed to the discussions on the understanding that it did not prejudice the position of their employers. Informal meetings were also held with the Passenger Transport Executives within the same geography. The workshops, survey work and analysis yielded broadly the same conclusions. In particular, trends and preferences with respect to the existence of market segments and the value that each segment would be likely to place on potential improvements to WCML services, were articulated by local authority representatives and identified in the survey responses. These key conclusions are presented in the following two sections and form the basis of the conditional outputs. Meetings were also held with two of the largest freight operating companies to understand the likely requirements of future freight users. This dialogue concluded that these requirements are already articulated in the WCML RUS and the Initial Industry Plan (IIP), which are underpinned by the industry-standard forecasts produced under the banner of the Strategic Freight Network. The conditional outputs for the freight market are therefore presented directly in section Market segmentation The weight of previous research indicates that two main factors differentiate between people s valuation of the service improvements considered, these are journey purpose and the distance travelled. On the basis of this, the following market segmentation was produced to support Passenger Focus research, defined first by journey purpose and secondly by distance travelled articulated as a set of geographical passenger movements. This segmentation would have been refined ex-post if the survey data had suggested that other factors provided a better differentiation of passengers preferences. This was not found to be the case Commuting Defined as travel between individuals home and normal place of work, usually based around the beginning and end of weekday office hours. This segment can be differentiated further by distance travelled, with commuters categorised as either short distance or medium/long distance. Medium/long distance commuters typically travel from a small to medium sized urban location, or a rural or parkway station to the centre of a large or medium sized urban area. A significant proportion of these passengers travel a distance of several miles between their residence and the station where they access the network. The private car is the predominant mode of access, and the point of access is often determined by the ticket pricing structure as well as the cost and availability of car parking. Most medium/ long distance commuting occurs between London and locations to the north such as Buckinghamshire and Northamptonshire. On this basis a single market sector has been identified: 9 1 Otherwise known as conjoint analysis
12 2 West Coast Main Line capacity study: phase one London suburban. Defined as passengers that travel on the route section between London, Milton Keynes, Rugby and Northampton. Some commuting occurs over even greater distances, however not in sufficient volumes to justify specification of a market sector. Short distance commuters typically travel from their residence within a large urban area to the commercial centre of the same area. Most short distance commuting on the inscope sections of the WCML occurs within London and the West Midlands metropolitan area. On this basis two market segments have been defined, namely: London urban. Defined as the passengers that use services currently operated by London Overground on the route section between Watford Junction and London Euston. These services use the DC lines, which is a segregated, albeit parallel, section of the WCML connecting predominantly inner London stations with central London via London Euston, and also via the London Underground Bakerloo Line. West Midlands suburban. Defined as passengers that travel between stations on the Coventry Birmingham New Street route section Business travel Defined as travel on behalf of an employer, typically between an individual s residence or normal workplace and other business premises. This segment can be differentiated further by whether travel is to/from inner London or another location. Most business trips by rail are relatively long distance as, outside of large urban areas, it is usually faster and more convenient to travel short distances by car Leisure travel Defined as travel for reasons other than those described above. Although this sector covers a number of journey purposes, ranging from holidays to personal business, travel for these reasons is typically more discretionary than thecommuting and business travel sectors, with price and convenience key determining factors. Rail is particularly competitive with car in these areas over longer distances, and leisure trips are concentrated to/from major tourist destinations such as inner London. This means that leisure and business passengers tend to travel between the same locations, with two market sectors identified: London interurban. Defined as travel between London and locations north of Rugby. Non-London interurban. Defined as travel between locations within the south of the WCML, and between the south and the north of the WCML, excluding London in both cases. Both market sectors exclude journeys that would be served by HS2 phase one services, for example London Birmingham. Furthermore, although some shorter distance business and leisure travel occurs into London, it accounts for a small proportion of demand on the services in question and has therefore only been considered in the suburban and urban segments Freight The SFN has defined the freight market by the major groups of commodities transported, namely; solid fuels; construction; metals and ore, ports non-bulk, and domestic non-bulk. For the purpose of this exercise freight is defined as a single market sector, as the SFN work detailed above allows production of conditional outputs without reference to this distinction. 2.3 How rail users value the constituent elements of the rail service offer Existing passengers The research into the preferences of existing passengers concentrated on four key attributes that could be improved following the introduction of HS2 phase one. These are: In-vehicle journey times, defined as the time spent on the train; Frequency, defined as the time between trains; Crowding, defined as the number of people on the train versus the space available; and Interchange, the requirement to change trains. A key objective of the research was to develop a quantitative understanding of passengers priorities for improvements to these attributes, in order to identify which of these should be enhanced, and to inform development of any required service trade-offs. Analysis of the survey responses was therefore used to estimate passengers relative valuations of each of these 10
13 attributes, and then to aggregate these values for each of the identified market sectors. The unit for these estimates is minutes of in-vehicle seated time, where estimated values for frequency, crowding and interchange are presented as the equivalent of the number of minutes seated. This is standard practice as it allows direct comparison between all attributes. The remainder of this section presents a summary of Network Rail s interpretation of these values. This interpretation combines the results of the research with existing WCML service characteristics for each market sector. Some service characteristics were not assessed on a quantitative basis: Although train punctuality and ticket prices are very important to passengers, they were only considered briefly as opportunities to alter these attributes are not dependent on HS2. Other service characteristics such as the availability of car parking spaces and luggage storage facilities were assessed using a qualitative rather than quantitative approach, as these are detailed considerations that would be more appropriate to consider at a later stage. Overcrowding Passengers were found to be strongly averse to travelling in overcrowded conditions, and removal of overcrowding would be the most valuable way to improve rail services in the typical circumstances where it currently exists. Passengers dislike for overcrowding can be split into three elements; namely the level of overcrowding, the amount of time spent on a crowded train and having to stand when there are more passengers than seats available. Although passengers dislike all of these elements the strength of this preference is relatively small providing that passengers are able to get a seat. As soon as passengers are required to stand the value that they derive from the rail service reduces significantly. This strength of reaction is proportional to both the time spent standing and the number of other people standing given the space available, as passengers are most averse to standing in extremely congested conditions for long periods of time. Passengers in all of the market segments detailed above share this dislike for crowding. Leisure passengers have the strongest aversion, followed by business users and finally commuters. However there is little difference between the estimated strength of these preferences. This similar valuation across journey purposes differs from previous research where commuters have been found to have significantly lower values of overcrowding. This has often been interpreted as people becoming used to travelling in overcrowded conditions, and should therefore apply to WCML passengers as trains on the route are very busy at peak times. A plausible explanation of why this may not be the case is the long journey times faced by a significant proportion of WCML commuters. The journey time from London to Northampton for example is at least 50 minutes, and standing for this duration is an unattractive proposition for the 3.1 million passengers who make this journey annually. Interchange Passengers were found to be strongly adverse to having to change trains, with the strength of this dislike increasing in proportion to the length of journey. Where interchange is currently required on the WCML, provision of a direct train would be the most valuable way to improve services for passengers. Existing business users are most inconvenienced by interchange, which is consistent with previous research suggesting that business passengers use in-vehicle time productively, and this is not generally possible when changing trains. Commuters and leisure passengers are only slightly less averse to interchange, with little difference in the valuation of each of these groups. The quality of the interchange facilities is also important to passengers, however it has not been possible to estimate a value for this. In-vehicle journey time Passengers were found to be less adverse to in-vehicle seated time than time spent either standing on a train or changing trains. Despite this, passengers would still attach a significant value to reductions in current journey times. The strength of this preference is strongest for the London-based market sectors, in particular the London suburban sector. This is consistent with the relatively long existing journey times discussed above. 11
14 2 West Coast Main Line capacity study: phase one Frequency Passengers attach the lowest relative value to the frequency of services. Commuters have a higher value of frequency than either business or leisure users. This could be interpreted as a result of commuters expectations for higher frequency services, or as a result of a greater proportion of seat reservations for other journey purposes. The value of service frequency increases relative to the other attributes as the journey time reduces, and for the very shortest-distance trips on the WCML frequency accounts for a greater proportion of perceived journey time than the time spent on the train itself. The exception to the relatively low valuation is where either the frequency is so low that it results in overcrowding or necessitates an interchange. In such instances an increase in service frequency would be the most effective way to improve the product offered to passengers. Other factors Of the other factors considered on a qualitative basis, the cost and availability of car parking are perceived to be the most important. This is because a costly or limited supply of parking spaces can influence where passengers choose to access the rail network, or in extreme cases act as a constraint on rail system capacity Car users who may switch to rail if services were improved Cost of travel In addition to the attributes considered above the cost of rail travel versus users perceived cost of car travel was also considered as previous research suggests that price is a dominant factor. The majority of respondents concurred with this. Rail service attributes Of the other attributes considered, overcrowding and the requirement to change trains provoked the strongest negative responses. Reducing the number of journeys where these occur would therefore be the most effective way to attract car users to the WCML. Perceived comparative advantage of car travel Respondents were also questioned on why they currently choose to travel by car rather than rail. The main reason can be summarised as car users having a perception that certain elements of travelling by rail are inferior to car travel, in particular train punctuality, the requirement to travel at a fixed time of day, and the cost of travel. 12
15 3 Conditional outputs This section details the conditional outputs for the WCML post implementation of HS2 phase one. These outputs are a statement of the improvements to WCML services that would provide the greatest benefit to future users of the route based on the evidence that is summarised in section 2, and the SFN requirements. These outputs are unconstrained, in that development of them has taken no cognisance of the amount of additional capacity on the WCML that HS2 phase one is likely to provide. Successful delivery of these outputs is therefore conditional on sufficient capacity being generated by HS2 phase one, and a high-level assessment of whether this is likely is presented in section 4. The conditional outputs have been split by the market sectors identified above, namely: London suburban (commuting) London urban (commuting) West Midlands suburban (commuting) London interurban (business and leisure) Non-London interurban (business and leisure) Freight. 3.1 London suburban Accommodating peak demand Overcrowding currently occurs on services at peak times and is forecast to worsen over time as passenger growth continues. Given the length of most journeys, passengers typically stand for in excess of 20 minutes. The most effective way to improve the service for passengers would therefore be to increase the level of peak train capacity to the point that all passengers have a reasonable expectation of a seat during normal operation. In turn the most effective way to provide this capacity would be to increase the frequency of peak services so that passengers receive the dual benefit of a seat and a reduction in the time spent waiting for a train. Output 1 The conditional output is therefore an increase in the provision of London suburban peak services to the level where all passengers travelling for more than 20 minutes have a reasonable expectation of a seat for the duration of their journey Reduced journey times A reduction in the journey times between the London and the largest commuter stations on the route would produce a significant improvement for passengers. This is for two reasons; firstly because journey times to/from some of the largest commuter stations are slow relative to other routes, and secondly because services between London and these stations are a mixture of non/limited stop and stopping services. These differentials in speed lead to imbalances in passenger numbers across different services, and a continuation of these speed differentials will undermine the ability of an increase in frequency to provide sufficient capacity. Output 2 The conditional output is therefore a reduction in journey times between London and major commuter stations, such that the mixture of non/limited stop and stopping services to/from any given station does not lead to overcrowding. 3.2 London urban Increased train frequency Trains are currently busy at peak times, leading to significant numbers of passengers standing on a regular basis. This can partly be explained by the layout of the high-density rolling stock used on the route, which has large amounts of standing capacity and relatively few seats. 13
16 3 West Coast Main Line capacity study: phase one The frequency of services is typically three trains per hour, which is low relative to inner-suburban routes elsewhere in London, and comprises a significant proportion of passengers perceived journey time given that most journeys last for little more than a few minutes. On this basis an all day increase in train frequency would significantly improve services for passengers. Output 3 The conditional output is therefore an all day increase in the minimum frequency of London urban services to four trains per hour. This is the typical frequency elsewhere in inner London. 3.3 West Midlands suburban Improved connectivity HS2 phase one would provide space in the timetable by re-routeing three trains per hour from the Coventry Birmingham section of the WCML to the new line, however it would be necessary to replace these services in order to provide sufficient capacity, journey times and frequency for the local market. These replacement trains would be less busy than the existing fast London services, providing the opportunity to address any peak overcrowding. In addition, train lengthening would be the most straightforward way to target extra capacity on any remaining crowded local services. Given that the replacement service would be likely to have some seats available and that locations such as Coventry and Birmingham International are major generators and attractors of trips, the most effective way to improve services would be to increase the number of direct connections between the Coventry Birmingham corridor and other major centres in the West Midlands such as Wolverhampton and Walsall. Output 4 The conditional output is therefore the provision of additional direct services between major centres in the West Midlands metropolitan area. 3.4 London interurban Maintained connectivity Existing long distance high speed services that are diverted via HS2 would no longer call at a number of intermediate stations that are currently served by these trains. It is necessary to replace these calls in order to provide regular direct services to/from London, as well as maintaining journey times that are appropriate for the market sector. Output 5 The conditional output is therefore the provision of services to broadly maintain the existing connectivity between London and intermediate stations Reduced journey times A number of sizeable locations on the WCML have relatively slow journey times to and from London, compared to similarly sized places on other routes. This is a result of capacity constraints on the current timetable, and is particularly the case at locations in the Trent Valley such as Nuneaton, Tamworth and Lichfield, where is it often faster to change trains rather than catch a direct service. On this basis a reduction in the journey times would significantly improve services for passengers. Output 6 The conditional output is therefore a reduction in journey times between London and Trent Valley stations. 14
17 3.5 Non-London interurban Improved connectivity There are limited opportunities in the current timetable to travel directly between sizable locations at the south of the route such as Watford, Milton Keynes and Rugby to major towns and cities further north such as Liverpool, Preston, Glasgow and Birmingham. These journeys often require an interchange which causes inconvenience and imposes a significant increase in the total journey time. Passengers wishing to travel to/from medium-sized locations on the south of the route such as Hemel Hempstead face the same requirement to change trains, albeit often with an additional interchange at a larger nearby station. On this basis an increase in the number of direct services between the largest towns and cities on the north and south of the route, and specification of the local timetable to connect with these new services, would significantly improve the product that is currently offered to passengers. Output 7 The conditional output is therefore an increase in the number of direct trains between large stations at the north and south ends of the WCML, and specification of the local timetable to connect with these services. 3.6 Freight Accommodate forecast freight market growth on the south end of the WCML 2 The capability of the WCML to accommodate forecast levels of freight traffic is fundamental to the role of the route as a key enabler for national and international trade with less environmental damage and road congestion than would be generated by road freight traffic. Despite recent economic difficulties, the level of freight on the WCML is predicted to increase significantly over the longer-term, with the growth principally driven by domestic and international demand for containerised goods. By 2030 it is forecast that traffic on the Wembley Rugby and Rugby Stafford sections of the WCML will have increased to 85 and 80 trains per day respectively, versus 58 and 47 currently. Peaks in the passenger market limit the number of freight trains in operation near large urban centres during busy periods, typically from 07:00 09:59 and from 16:00 17:59, although this can vary by location. Based on a continuation of this limitation, the frequency of freight services at other times would be required to increase to between four and five trains per hour in each direction in order to meet the 2030 forecasts. Output 8 The conditional output is therefore to accommodate 85 and 80 trains per day on the Wembley Rugby and Rugby Stafford sections of the WCML respectively. These freight paths should not have significantly longer journey times, or reduced capability compared to currently, to ensure that rail remains competitive with road haulage. The market for rail freight is expected to continue to grow beyond 2030, and development work for the second stage of Government proposals for high speed rail, (the Y-shaped network), will provide an opportunity to understand how this further growth can be accommodated No additional constraints on freight growth to the north of Lichfield A significant proportion of the forecast growth in freight traffic will be to or from locations north of where HS2 phase one connects with the WCML at Lichfield. Other planned infrastructure schemes for the WCML, detailed in the Initial Industry Plan, will help accommodate this growth provided that the combined WCML and HS2 passenger timetable north of Lichfield does not impose any additional constraints on the route. Output 9 The conditional output is therefore to be able to accommodate the same level of freight traffic with high speed services using the route north of Lichfield, as would be the case without these new services Numbers of trains quoted are trains in each direction in the Working Timetable and are based on the standard SFN assumptions of six-day working and 640 metre trains
18 3 West Coast Main Line capacity study: phase one 4 Initial service Enable freight operators to compete in time-sensitive markets It is anticipated that over the period to 2030 there will be an increase in demand from freight customers for early morning deliveries of containerised goods. A number of the container terminals with the potential to stimulate growth of this nature are located in the West Midlands, and whilst spare track capacity is likely to exist for inbound services which typically arrive before 07:00, the opposite is true for outbound services which would require paths in the timetable during the passenger peak. These paths would be in the contra-peak direction, travelling away from the main urban centres. It is not possible to articulate this capability as a conditional output until more is known about the location of terminals and the requirements of these markets, however further investigation of this would be useful for long-term industry planning purposes. This section presents a high-level analysis of the extent to which HS2 phase one could enable delivery of the conditional outputs for the WCML articulated above. The results of this analysis are indicative and require the eventual support of the more detailed work proposed for the second phase of this study. This analysis is presented in two ways: Firstly, as an initial high-level service specification for the WCML fast lines in order to show the interdependencies between serving the various market sectors; and Secondly, with respect to the defined market sectors. 4.1 Potential fast line service pattern The development of an initial service specification started with longer distance services as the route section to the north of Lichfield where HS2 day one services join the WCML is likely to be the main constraint on the timetable Services to/from north of the connection between HS2 and the WCML Throughout the duration of HS2 phase one, high speed trains would travel on the new high speed line and join the existing WCML in the Lichfield area. Freight services also operate on the WCML north of Lichfield and the current track layout means freight needs to be pathed across the passenger services. For example, on the circa two mile track section between Colwich Junction and Milford Junction the reduction from four tracks to two tracks means that any freight would have to use the same two tracks as the High Speed and WCML services. The number of freight movements in this area reduces the capacity available for additional services and vice versa. There are three high-level options available to meet the conditional outputs for freight and WCML passengers. These are based on different generic service trade-offs. 16
19 specification & assessment Option 1 Operate the maximum potential requirement of four to five freight trains per hour plus the HS2 phase one specification and three or four WCML passenger services per hour in addition to this. These additional WCML passenger services could connect London and the locations to the south of the WCML with a number of locations further north such as Manchester, Stockport, Crewe, Chester, North Wales, and Glasgow. 3 One or more of these additional services could also be specified to improve journey times between Trent Valley stations and London through use of released 125mph rolling stock and no longer diverting via Northampton. 4 Option 2 A reduction in the number of freight services in this area in the high peak to between one and three per hour would allow additional passenger services to operate. This capacity could be used to operate additional services, providing a greater level of through journey opportunities. Option 3 An alternative to meet both the freight outputs and the connectivity-based passenger outputs would be to divert a limited number of passenger services via Birmingham and Wolverhampton. This would impose a significant journey time penalty but allow a greater quantum of trains to operate over the route as a whole. Government s proposals for a subsequent extension of HS2 phase one into a Y-shaped network would obviate the requirement for this trade-off. However, in the mean time option one is closest to delivering all of the conditional outputs so has been used as a basis for development of an illustrative service specification further south Services between London and the West Midlands and London suburban services Re-routeing existing long-distance high speed services via the new line means that very few trade-offs are required to meet the conditional outputs at the south end of the WCML. Peak passenger growth can be accommodated by using the released fast line capacity to increase the frequency of services between London and the busiest commuter stations, namely Milton Keynes Central, Watford Junction and Northampton. Serving these flows exclusively on the fast lines 5 and with the released 125mph rolling stock would significantly reduce journey times and all but eradicate speed differentials between services to/from the same locations. There would be a sufficient quantum of services and seating capacity available to call services at Hemel Hempstead, Berkhamsted and Leighton Buzzard, which are the next busiest stations. Furthermore, it would be possible to define a stopping pattern so that at least two of these stations could be served exclusively by fast line trains, without materially increasing journey times for through passengers. These services could also be extended to maintain connectivity between the south end of the WCML and locations in the West Midlands such as Coventry which would otherwise be lost when existing WCML services are re-routed via HS2. This extension of fast line peak services would be unlikely to cause overcrowding. Furthermore, there would be a sufficient quantum of these trains to limit the number of calls at commuter stations, therefore keeping the journey time penalty for through passengers to a minimum. This potential service quantum would significantly reduce the number of passengers on peak slow line services, and divert at least one train per hour from the slow lines. This would be likely to provide sufficient capacity to accommodate passenger growth from the remaining stations (through an increase in peak frequency if necessary) and to enable the required increase in freight traffic. 3 Subject to further analysis to determine optimal service patterns north of Preston. 4 This would involve an interchange for passengers travelling between the Trent Valley and Northampton, and would require further investigation during the second stage of this study. 5 Except the route section between Northampton and Milton Keynes Central 17
20 4 West Coast Main Line capacity study: phase one Figure 1 below illustrates the resulting potential standard hour WCML passenger service quantum and Figure 2 details the potential peak fast line service quantum for London suburban stations. Figure 2 Potential peak hour passenger service level between the busiest commuter stations and London Figure 1 Potential standard hour off-peak WCML passenger service level (fast lines) Rugby Northampton Birmingham New Street Birmingham International Coventry Rugby Northampton Milton Keynes Central Milton Keynes Central Leighton Buzzard Berkampsted Hemel Hempsted Watford Jn Watford Jn London Euston All trains call Calls added to required number of services only All trains call Calls added to required number of services only Calls added as required, but no more than 2 calls per train Peak only 18
21 4.2 The extent to which the conditional outputs can be delivered London suburban Output 1 An increase in the provision of London suburban peak services to the level where all passengers travelling for more than 20 minutes have a reasonable expectation of a seat for the duration of their journey. HS2 phase one would be likely to allow the complete delivery of this output. Output 2 A reduction in journey times between London and major commuter stations, such that the mixture of non/limited stop and stopping services to/from any given station does not lead to overcrowding. HS2 phase one will allow significant reductions in the journey times between London and the six busiest stations on the south of the WCML, equivalent to around 10 million journeys per annum. These stations are Milton Keynes Central, Watford Junction, Northampton, Hemel Hempstead, Berkhamsted and Leighton Buzzard, and at least five of the six would have no significant difference in journey times between the trains that serve these stations London urban Output 3 An all day increase in the minimum frequency of London urban services to four trains per hour. This would only be possible with additional infrastructure or a reduction in the frequency of Bakerloo line services on the DC lines that serve both London Euston and London Underground West Midlands suburban Output 4 Provision of additional direct services between major centres in the West Midlands metropolitan area. It will be possible to provide two additional services across Birmingham, and to increase the number of connections between the West Midlands and stations on the south end of the WCML London interurban Output 5 Provision of services to broadly maintain the existing connectivity between London and intermediate stations. HS2 phase one is likely to enable delivery of this output. Output 6 A reduction in journey times between London and Trent Valley stations. HS2 phase one is likely to enable delivery of this output, although there is a potential trade-off with other outputs to the very north of the Trent Valley. It will also be possible to maintain the quantum of services between London and Coventry with a minimal increase in journey times. 19
22 4 West Coast Main Line capacity study: phase one Non-London interurban Output 7 An increase in the number of direct trains between large stations at the north and south ends of the WCML, and specification of the local timetable to connect with these services. The route section just north of where HS2 phase one joins the WCML will be the foremost constraint on additional through services on the WCML prior to implementation of the second stage of Government s proposals for high speed rail. The number of additional through services will be limited by rail freight growth, and vice versa. If the freight conditional outputs were accommodated, it would be possible to provide a quantum of passenger services which broadly maintains existing connectivity, albeit with better connections into an improved local timetable on the south of the WCML Freight Output 8 To accommodate 85 and 80 trains per day on the Wembley Rugby and Rugby Stafford sections of the WCML respectively. These freight paths should not have significantly longer journey times, or reduced capability compared to currently, to ensure that rail remains competitive with road haulage. This output is likely to be fully deliverable between the south of the WCML and the West Midlands. However, as discussed above the output will only be deliverable north of Lichfield by trading-off the number of additional passenger services. Output 9 To be able to accommodate the same level of freight traffic with high speed services using the route north of Lichfield, as would be the case without these new services. This output is likely to be deliverable but also requires the trade-off with additional passenger traffic identified above. Development of the HS2 timetable would need to fit with the WCML timetable and vice versa Conclusion This paper has presented the first stage of a study into the best uses of the West Coast Main Line if Government s initial proposals for high speed rail were implemented. This is a new high speed line between London and Birmingham, with a connection with the existing WCML at Lichfield. This work draws from a number of sources of evidence, to develop a segmentation of the WCML rail market into key groups of rail users, and a quantitative assessment of the value that these segments would derive from the types of improvements to services that HS2 phase one could enable. This assessment has been used to articulate a series of conditional outputs for each market segment, which could form the building blocks of a future WCML service specification. An indicative capacity assessment, which will be used to inform the second stage of this study, suggests that HS2 phase one will enable delivery of the majority of the conditional outputs. On this basis, the large numbers of passengers who use the southern and central section of the WCML could benefit in particular through significantly reduced overcrowding, faster journey times and a reduced requirement to change trains. Freight users will also benefit as sufficient capacity would be provided to accommodate growth projections between the south of the route and the West Midlands. This will remove significant numbers of lorries from heavily used sections of the motorway and trunk road network, thereby reducing traffic congestion. Other passengers and freight users would also derive significant benefit as although the northern extent of the phase one infrastructure is Lichfield, the capacity for additional services is less constrained on the WCML north thereof than on the south end of the WCML currently. One possible trade-off during the operation of the HS2 phase one scheme would be to accommodate freight growth projections, improve journey times between London and the Trent Valley, and improve connectivity for passengers who are currently required to change trains. The second stage of Government s proposals for high speed rail, namely the Y-shaped network towards the North West and the North East, would be likely to alleviate the constraints identified. This would allow delivery of the remaining conditional outputs, and provide an, as yet not assessed, step-change in rail service provision further north. In the mean time the second stage of this study will develop a more detailed understanding of the shorter-term trade-offs between delivery of the specified conditional outputs for the WCML. 20
23 21
24 1 Future Passenger Priorities for the West Coast Main Line Passenger Priorities for the West Coast Main Line: Released capacity from High Speed 2 January
25 1 Management Summary 1.1 Summary of key findings If a major new rail line goes ahead, the first stage may free up capacity on the existing WCML. This will offer opportunities to improve services on the WCML, in terms of increased frequency, faster journey times, less crowding and a lesser need to change between trains during a journey. Passenger Focus has undertaken research to understand which of these potential improvements would be of greatest value to passengers ( existing users ), and the findings will be taken into account when planning the future service provision along the WCML. The research also covered people who travel by car on journeys which could feasibly be made by train on the WCML ( car drivers ). Passenger Focus would like to thank the train operating companies on the WCML, for their co-operation with this research. In summary, the research shows that for existing passengers using the WCML: Room to sit/ stand and the need for/ length of interchange have the most influence on the quality of passenger experience Passengers care about getting a seat, and are concerned to a lesser degree about loading once seated, or level of crushing once standing particularly for shorter distance commuters (the research did not ask passengers how overcrowding should be addressed) Passengers care about having direct services. The time to interchange is fairly inconsequential in itself, passengers are reluctant to change at all If the preferred changes are made, a sizeable proportion of passengers (19%) say they will make many more journeys by train. The research shows for car drivers: Price of rail travel is the most influential factor to encourage mode switch from car Having direct services is a secondary, but important factor to encourage modal switch The number of car drivers currently making journeys that could switch to rail is relatively small, but amongst this group propensity to switch appears healthy given the right service provision. However this study does not account for any new journeys that might be created as a result of HS2, if improved rail services encourage people to move their homes and/or work in new areas. 1.2 Background and research approach The survey included a stated preference task, where all respondents indicated the appeal of a number of scenarios for future rail services. This has been used to derive which elements of rail services are most important, and enables prediction of the appeal of future potential service formulations. Existing users were surveyed in five market segments (London suburban, London urban, West Midlands suburban, London interurban and non-london interurban). The existing users research has been reviewed by the University of Leeds Institute for Transport Studies, as extremely robust and offering rigorous understanding of the issues described here. Findings from the research, which are summarised below and then given in more detail in the main body of this report, have formed the basis of conditional outputs produced by Network Rail for future service operation on parts of the WCML. 23
26 1 Future Passenger Priorities for the West Coast Main Line 1.3 Findings from the research: existing users of the WCML The following emerged as the key findings for existing users priorities: While for many, current service provision on the WCML is reasonably satisfactory, there is certainly room for improvement. Indeed, since many WCML journeys are commutes, improvements could have a significant impact, by affecting passengers daily lives Passengers are extremely averse to overcrowding, and removing this would be the most valuable way to improve the service on most routes Reducing overcrowding would be valuable to all existing users, but leisure travellers are shown to be the most sensitive to overcrowding, followed by business travellers and then commuters (commuters are likely to be more used to crowding, and therefore more used to standing, and this is the likely reason that they appear to be more accepting). However the differences in overcrowding aversion between commuters and business/leisure travellers is small, and this could be due to the longer commuter journeys included in this research. Existing users are also very reluctant to change between trains. The need to change between trains does not affect all journeys on the WCML, but where it does, removing any need to interchange would typically be the most valuable way to improve WCML services and for these journeys it would be even more valuable than reducing overcrowding Journey length is a little less important to existing users than the two factors above, but it is clear (and intuitive) that passengers prefer shorter journeys to longer journeys Frequency tends to be the factor which is least likely to improve existing users overall experience (indeed this is one of the areas that is felt to be most satisfactory currently). There are some differences for the different segments, however, as described below. In addition to the areas which can be improved if HS2 goes ahead (frequency, journey times, crowding and the need for interchange), existing users were also keen to stress the importance of other factors (when given the opportunity to make any other comments about services on the WCML). The main additional factors of importance were: Reliability (punctuality and the handling of delays/disruption) Cost (a combination of the cost of the rail ticket, plus costs such as car parking). 1.4 Differences in priorities of existing users by market segment The key findings outlined above are true for all five market segments, i.e. improvements to crowding in order to increase the likelihood of getting a seat, would be valuable to all. There are some differences between the segments however, which are, in summary: London suburban Although getting a seat and having direct services are important, faster journey times would be worth consideration for this segment in particular. Many journeys in this segment are commutes, and often quite long distance, and we have also seen a lower level of satisfaction with journey length here than in other segments. London urban Passengers in this segment are also mainly commuters, but are making shorter journeys. Therefore reducing overcrowding through increasing frequency would benefit passengers the most, more than reducing journey time, as they are currently using the train for making much shorter trips (and frequency in particular is an area of lower satisfaction currently). West Midlands suburban This segment is used for a mix of journey purposes (although commuting is important). Therefore generally, improving the ability to get a seat will be most valuable to passengers using these routes (as the need to make interchanges is rare). London interurban Providing direct services would be a priority for all routes where an interchange is currently necessary meaning that this improvement would be particularly valuable on the 24
27 London interurban segment, where interchanges are currently made on a number of routes Non-London interurban Journeys made on routes in this segment are also made for a variety of purposes, and so generally, improving connectivity will be of greatest value here and this is the other segment for which a large proportion of journeys involve a change between trains currently. 1.5 Findings from the research: potential market among car drivers Among car drivers (those not using the WCML currently), the key improvements which are most likely to encourage them to consider using the train for journeys along the WCML are, For shorter journeys: price, followed by the ability to get a seat (less crowding) For longer journeys where an interchange might be necessary: price and provision of direct services, followed by the ability to get a seat. In addition, certain aspects of train travel versus car travel act as barriers to using trains for journeys along the WCML currently, such as being tied to timetables. This research also suggests that the number of car drivers currently making journeys that could switch to rail is relatively small, but amongst this group propensity to switch appears healthy given the right service provision. However, it is acknowledged that this study does not account for any new journeys that might be created as a result of HS2, if improved rail services encourage people to move their homes and/or work to new areas. 25
28 2 Future Passenger Priorities for the West Coast Main Line 2 Background & Research O Proposals have been made to open a high speed line (HS2) between London and the West Midlands, and the North West. If the proposals are taken forward, the first stage (phase one) will be to open the link between London and Birmingham, with the extension of the Y-shaped route into the North West and Yorkshire implemented later. If the first stage goes ahead, capacity will be freed up on the existing West Coast Main Line (WCML), in two ways: Some existing passengers between London and the major destinations in the Midlands and North West will transfer to the new line, freeing up capacity on the existing WCML trains Some of the faster services will now be available on the new line, freeing up track capacity on the existing WCML. This will offer potential opportunities on the existing WCML in a number of key areas: Increased frequency of train services Faster journey times Less crowding Better connectivity between some key stations. Passenger Focus in partnership with Network Rail wished to understand, if HS2 goes ahead, which of these potential improvements would be of greatest priority to passengers, in order to manage future service provision on the WCML in the most appropriate way. This research was undertaken at the request of the Department for Transport. Research has been undertaken by the independent market research agency BDRC Continental, with the following key objectives related to this extra WCML capacity: Understand the needs and priorities for current and potential future users in relation to key elements that could be improved on the route (i.e. frequency, journey times, level of crowding and connectivity) Understand priorities of different types of passengers, i.e.: those currently using the WCML for different journey purposes (commuters, business and leisure travellers) existing users those travelling on different parts of the route (across five different route segments; three segments covering short and long distance commuters in London and the West Midlands, and two interurban segments) potential new customers who do not currently travel by train on the WCML, but make journeys between destinations along the route by car car drivers Explore whether there are any major differences in priorities when analysed by other factors such as weekday vs. weekend, distance travelled/journey time. The outputs from this passenger research are being used by Network Rail to develop feasible planning scenarios that meet passenger priorities. Views of freight users and local authorities have also been separately collected by Network Rail and have been used alongside this passenger research to inform a set of conditional outputs for WCML services. 2.1 Acknowledgements on the scope of the research The study as a whole has been limited to understanding priorities on WCML journeys that could be improved by HS2 phase one; it has not considered journeys which will be impacted by the second phase. In addition to the four journey aspects described above, we know that price is likely to be a key factor in decisions about rail travel, and indeed this was confirmed during a pilot stage of the research. However, since the pricing regime for HS2 is not yet known, it was decided that price should be neutralised, by asking existing users to express their priorities for future services, assuming rail prices are broadly as they are now. The pilot demonstrated that price was such an influential factor for current car drivers, that it was decided to include price as a service feature to be traded off against the four others listed above. This was necessary for this group because, as became clear in the pilot, without acknowledgement of price car drivers felt that the survey was not completely relevant and this was likely to limit participation. 26
29 jectives 3 Methodology 3.1 Sample: existing users Previous rail industry research has shown that distance travelled and journey purpose are influential in passengers valuation of potential service improvements. Thus the research covered five passenger segments defined (by Network Rail) in relation to distance and journey purpose. These segments are detailed on the right. Within the five segments, questionnaires were distributed to existing users of 66 individual routes along the WCML, as they were about to board a relevant train. The times and days for distribution were aligned with the journey purpose profile of each segment as defined by Network Rail. For instance, questionnaires were distributed at peak times during weekdays for the first three segments below which have high commuter use. For the two interurban segments questionnaires were distributed throughout the day, including at weekends, to reflect the more varied times at which these routes are typically used. The research covered routes operated predominantly by London Midland, London Overground and Virgin Trains, and questionnaires were distributed at both ends so that journeys in either direction were included. Examples of the specific routes are shown for each segment on the right, and the full list of 66 routes is included in the appendix to this report. London suburban (mainly commuters) Medium distance trips to and from London. Predominantly commuters, with a smaller proportion of business and leisure users. E.g. London Euston Hemel Hempstead London urban (mainly commuters) Short distance trips within London mainly using the line between Euston and Watford. Predominantly commuters, with a smaller proportion of other users. E.g. London Euston Kilburn High Road West Midlands suburban (mainly commuters) Short distance trips, largely in the West Midlands. Predominantly commuters, with a smaller proportion of other users. E.g. Stechford Birmingham New St London interurban Long distance trips to and from London excluding passengers re-routed via HS2 services or infrastructure. Mixed journey purposes, although commuting is less prevalent. E.g. London Euston Coventry Non-London interurban Long distance trips between regional and local urban centres. Mixed journey purposes, although commuting is less prevalent. E.g. Milton Keynes Birmingham New St 27
30 3 Future Passenger Priorities for the West Coast Main Line Network Rail initially supplied estimated passenger volume data on the key origin-destination pairs in each segment, and the research agency selected a sample of these origin-destination pairs in each segment with probability proportional to the number of journeys. That is, all the origindestination pairs were listed in order of passenger volume within each segment, and the total volume for each segment calculated. Origin-destination pairs were then selected systematically from the list at given intervals (i.e. no human decisions were made about which pairs to select). This means that higher-volume routes had a higher chance of being selected, because they are likely to represent a higher percentage of the total passenger volume in the segment. This therefore represented a good random sample of each overall segment. Questionnaires incorporated: conventional questions including details of the journey being made and demographics a trade-off section, where respondents were shown either 12 or 16 pairs of scenarios and asked which of each pair they preferred. This questioning technique enables Conjoint analysis, which provides a derived understanding of which features are the most important, and how attractive the features are as they improve or worsen. the scenarios included one of typically four levels for each of: journey time (time on the train itself) frequency crowding time taken for interchanges (including one option of a direct service). The questions, and Conjoint analysis, are also described in more detail in section 3.2. Questionnaires were given to existing users commencing their journey on any of the 66 nominated routes. Questionnaires were handed out at stations at both ends of each route, in order that travel in either direction of the route was covered in the research. The sample sizes used for reporting for each of the segments were as follows: Table 1 Sample sizes used for reporting for each of the segments: Route segment London suburban 1700 London urban 536 West Midlands suburban 901 London interurban 1249 Non-London interurban 809 Total 5195 These very large sample sizes combine to make this study one of the largest trade-off surveys ever undertaken in the UK rail industry. This ensures the data is both robust and capable of subdivision into a number of key subgroups. These subgroups included: individual segments (and in some cases, individual routes) passengers travelling for different reasons (business, leisure or commuting) passengers travelling into versus out of London (on London routes) those with and without seat reservations weekday versus weekend journeys. 3.2 Questionnaire existing users Sample size used for analysis Existing users of relevant services were surveyed via a self-completion paper questionnaire which was distributed at the stations at both ends of the routes in question. The questionnaire was tailored to the specific journeys, i.e. an existing user travelling from London Euston to Chester would be given a questionnaire which referenced specific journey times, frequencies and so on, which were relevant to that particular journey. 28
31 Questionnaires were distributed by fieldworkers who worked at varying times of day on different days of the week, to cover all types of journeys and journey purposes. For the three segments which are mainly used for commuting, fieldworker shifts were scheduled for peak times on weekdays only. Questionnaires captured a range of information about the existing user and their journey, as well as their satisfaction with aspects of the current rail service on their route. In addition, the key section of the questionnaire presented respondents with a number of pairs of scenarios in which the four service features (frequency, journey time, crowding and interchange) were varied; respondents were then asked to choose their preferred scenario from each pair. The features were varied with four levels, starting with the current level (e.g. 45 minute journey) and up to an estimate of the best possible if HS2 goes ahead (e.g. 35 minute journey), with two intermediate levels. An example of how the questions were presented is below: This trade-off questioning technique enables Conjoint analysis, which measures existing users preferences for different service combinations. The basic premise is that passengers value rail services based on a sum of their parts, so it is useful to present passengers with a series of complete packages to evaluate, rather than to ask them directly which individual elements are most important to them. By understanding how they rate each combination of the complete package, we can derive how important each of the constituent elements is. It is also possible to identify any tipping points where the levels of each element become either significantly more or less appealing, as well as understand how the different elements interact with each other (e.g. x factor is important but only when y factor is at a certain level). By measuring how much existing users value each of these constituent parts, it is then possible to design a final Q12l Please tick the box underneath the option that you would like the most Option 1 Option 2 Frequency of trains Every 15 minutes Every 30 minutes Room to sit or stand There are 100 seats and 120 passengers There are 100 seats and 80 passengers in standard class, unless you have a seat reservation, you stand for 35 All passengers get a seat minutes of the total time on the train Your total journey 1 hour 10 minutes 1 hour 12 minutes would take This is made up of: Time on the train itself 55 minutes 57 minutes Direct/need to change 1 change where you wait 15 minutes 1 change where you wait 15 minutes Preferred option (tick one only) Example of stated preference question, taken from questionnaire for route 47: London Euston Nuneaton. product to best meet their needs. Conjoint analysis is designed specifically to do just that to measure each component in order to understand (and even simulate) how passengers would respond to any possible service offered. The example above relates to a route where an interchange is currently necessary on some services between 29
32 3 Future Passenger Priorities for the West Coast Main Line the origin and destination. In cases like this, the questionnaire included 16 pairs of scenarios like the one above. For routes where an interchange is not currently necessary (and is unlikely to ever be necessary), the interchange feature did not need to appear as part of the scenario and so fewer pairs were necessary to conduct the Conjoint analysis. Respondents using these routes were shown 12 pairs of scenarios. The questionnaire was piloted, to ensure the wording used to define the scenarios was properly understood by existing users, and to check the level of willingness to complete the stated preference task 12 or 16 times. Checking wording was especially relevant for the crowding and interchange questions, and indeed some changes were made following the pilot. For each route in the WCML existing user sample, two versions of the questionnaire were used one with the scenario pairs in one order and one with the pairs in the reverse order; this rotation minimises the risk of order effects in the presentation of the scenarios, and thus in passengers responses. The questionnaire was 8 pages long, and an example is appended. 3.3 Sample: car drivers who are potential WCML users This sample covered those making journeys on specific WCML routes at present, by car rather than train. A list of specific routes was selected, established as having high volume highway passenger miles by Network Rail, using Census journey to work information. As for existing users, a sample of these routes was selected, using probability proportional to volume of use. The eight routes selected also represented a mix of short, medium and long journeys which could feasibly be made using rail services on the WCML: Short journeys Coventry to central Birmingham Hemel Hempstead to central London Bushey to central London Medium journeys Watford to central Birmingham Nuneaton to central London Rugby to central Manchester Long journeys Watford to central Manchester Stoke on Trent to central London. (NB. 10 routes were originally identified, but two were discarded during fieldwork due to very low numbers of people making the relevant journeys by car rather than train. These were Coventry-Northampton and Milton Keynes-Manchester). Respondents qualifying for interview were contacted face to face in the towns at one end of each route (the end where it was anticipated that most journeys on that route would originate from). To qualify, respondents needed: To have made the specific journey in the past six months by car To not have made this specific journey by train in the past year To not reject rail as a transport mode outright To have made the above journey on their own (to facilitate comparison of car and rail journey costs). Table 2 Sample sizes used for reporting for each of the segments were: Journey type Short journeys 613 Medium journeys 155 Long journeys 142 Total 910 Sample size used for analysis 30
33 3.4 Interviewing and questionnaire car drivers For the eight routes selected for the car drivers sample, respondents were interviewed face to face in the street, within postcodes identified as being in the catchment area for the relevant railway station. They were interviewed at the end of the route where it was felt it would be easiest to identify individuals making that particular trip. For example in the Bushey to London route, most of the trips were anticipated to be commuter trips from Bushey into London, and so interviews took place in Bushey where incidence of the journey would be higher than in Central London. As part of the interview, car drivers indicated the appeal of a number of different scenarios, similar to the existing users. The difference was that for the car drivers survey, respondents indicated their likelihood to switch from car to train for each scenario. An example of how the scenarios were presented to car drivers is below; as for existing users, the scenarios were tailored to be relevant to the specific route in question, in terms of journey times and so on. Show Card SP16 If the train service between Watford and Birmingham had these features, how likely would you be to make the journey by train, rather than by car? Each respondent saw 16 scenarios like the one above, each using a different combination of different levels for each feature of the service. As for the existing users, there were four levels for each feature starting with the current level of service, up to an estimate of the best possible if HS2 goes ahead. As can be seen above, the rail scenario is presented in relation to the price of a car journey. In order to understand the results in context, and to make the scenarios meaningful to car drivers, we also asked respondents about the cost and time required for their current, equivalent car journey. This included cost of petrol, parking, and any other charges such as tolls or congestion charges; it did not include costs such as car purchase and insurance, as previous research (including the pilot for this study) has indicated that car drivers rarely include these factors when making cost comparisons. At the time they were shown each scenario, they also were shown these details of their car journey in terms of cost and time taken. An example of the questionnaire used for car drivers is provided in the appendix: see page 4 of this questionnaire for the form filled in to record car drivers own estimate of cost and journey times. 3.5 Weighting For both the existing users and car drivers surveys, the data for each route was weighted to the total number of estimated journeys for that route. This enables the various routes to be easily amalgamated into a single existing users and a single car drivers dataset. Conventional data tables were then produced from these datasets, in order to read results from the other non stated preference questions that were asked in the survey. Cost for a return journey per person Frequency of trains Room to sit or stand Total journey time This is made up of: Time spent on the train itself Direct train/need to change 20 more expensive than car Every 10 minutes There are 100 seats and 70 passengers all passengers get a seat 1 hour 25 minutes 1 hour 10 minutes 1 change where you wait 15 minutes Example of stated preference question, taken from questionnaire for route 3: Watford to central Birmingham 31
34 4 Future Passenger Priorities for the West Coast Main Line 4 Findings from Existing users of the the research: 4.1 Findings from the stated preference task Modelling based on the existing users results was conducted on the following variables, which are standard in the rail industry. All times given are in minutes. Seated in-vehicle time journey time where there were at least as many seats as there were passengers or if the respondent had a seat reservation Where there were more passengers than seats, the seated in-vehicle time was valued as zero, because the passenger would be standing There were a few routes where crowding would be likely to diminish during the course of the journey, and in these cases respondents were told that they would need to stand for some of the journey (rather than the whole journey), if there were more passengers than seats. Therefore in these cases, seated in-vehicle time was calculated as total journey time less the time standing. Standing in-vehicle time journey time minus seated time Headway time between trains (from frequency information) Interchange time already given in minutes on the questionnaire, and when respondents were shown an option with a direct service, interchange time was valued at zero minutes For many routes, there is never likely to be an interchange necessary. In these cases, interchange was always valued at zero minutes Linear modelling of the stated preference results One of the outputs from modelling the results of this stated preference task is a utility function for possible scenarios (or packages ). The utility is essentially a measure of the relative appeal of a scenario the higher the utility value, the higher the appeal to existing users of the WCML. We initially constructed a simple model where the utility was assumed to be a linear combination of these factors. Models were constructed separately for each journey purpose i.e. commuters, business and leisure. In this model, a scaling variable is included for each segment as the journey length overall is not explicitly included. This allows all segments to be included in the same model, whilst taking account of the differing characteristics of each segment. For the London urban segment, the vast majority of travellers were commuters since the survey focused on the peak services; therefore for this segment all business and leisure travellers were incorporated into the commuter group. For this reason, this segment does not have scaling values for business or leisure travellers. Detailed results for the model are given in the appendix, in table 2A. The chart below shows the key information from the model in graphical form. This graph shows the relative importance of each service feature, and as described above the figures are expressed in minutes. This means that the higher the number, the more minutes of the journey the feature is worth. So the higher the bar in the chart, the more negative the feature is for existing users, and the more it has the potential to impact negatively on their journey experience. We can see therefore, that the need to stand and the need to interchange during the journey have a very negative impact on journey experience, and this is the case for all types of passenger. Other key points of interest from this analysis are: Standing: For commuters, 1 minute standing is equivalent to 1.48 minutes seated. The need to stand during the journey has even more negative impact for business, and especially leisure travellers Headway: For business and leisure travellers, 1 minute waiting at the platform is equivalent to around half a minute on the train these travellers are not especially worried about frequency of trains (it is likely that they plan in advance, know what time their train is, and arrive at the station in time for that specific train, so frequency affects them relatively little). For commuters, waiting at platform is perceived to have more significant impact on total journey time these passengers are more likely to arrive at the station at a random time, knowing that there will be several possible trains within a reasonably short period of time. This makes frequency important. Need for interchange: Having to change trains is undesirable for all, and particularly for business and leisure travellers for whom 1 minute waiting between connections is as valuable as 1.82 minutes and 1.73 minutes respectively, actually on the trains (when presumably they will also make use of the time on some other activity). 32
35 WCML Graph 1 Relative value of journey features output from linear model Relative value in minutes versus journey (in-vehcle) time Seat Seated in vehicle time Stand Level of crowding, forcing standing Headway Frequency Wait time Need for interchange, and wait time between trains Commuter Business Leisure Non-linear modelling of the stated preference results: creating the model The linear models were then expanded by including additional factors and allowing the terms to act in a non-linear fashion 1. For instance it may be the case that increasing standing time from 10 minutes to 20 minutes has a greater or lesser impact on utility than increasing it from 20 to 30. A non-linear model includes more types of variables to account for this. The additional variables in the non-linear model are: Base time current journey time (equal to the longest time presented in the conjoint task) Load factor crowding on the train as a ratio of passengers to seats. Thus where there were 100 seats and 100 passengers, load factor was valued at 1, whereas if there were 100 seats and 170 passengers the load factor was valued as 1.7 The results from this model show that it is far better at describing the data than the linear model. One of the key benefits of using this non-linear model is that it can predict passenger preferences for the routes covered by this research, as well as other potential routes (origin-destination pairs) along the WCML. Detailed results about the non-linear model can be found in Table 2 in the appendix. Note that when using the linear model, we were able to state, for instance, that for commuters, 1 minute standing is equivalent to 1.48 minutes seated. Because the non-linear model allows for the impact of variances in frequency, invehicle time, loading and interchange time, relationships such as that between the value of time (the level of appeal) when seated versus standing are, by definition, not so fixed. It is possible to look at the differences in the appeal of specific different scenarios, but these will vary depending on the parameters involved. However, broadly and at an overall level, the patterns in the level of appeal for different scenarios did reflect the findings generated by the linear model. So for example, the non-linear model also indicates that, at an overall level, time spent is significantly less appealing than time spent seated, and time spent making interchanges is less appealing still. The non-linear model can be used to look at the level of appeal for a very large number of different combinations of journey features when it is relevant and useful to do so. However this report focuses on the general principles in passenger preferences which have been established; the next section describes these principles Note that the approach used for this non-linear model was Multinomial Logit; this is the usual approach used for modelling stated preference data, in the transport industry
36 4 Future Passenger Priorities for the West Coast Main Line Non-linear modelling: outputs resulting from the model Routes where an interchange is not applicable The non-linear model described above allows us look at the impact of improving each of the factors, and the following are some examples of the insights that this provides. Firstly, we take an example of one of the routes in the London suburban segment. This particular route does not (nor is likely to) have a necessary interchange between trains; we also look at an example of a route which does, later in this section. Graph 2 shows how passenger appeal varies as time spent on the train ( in-vehicle time ) decreases. The faster this WCML journey is, the more appealing it is to existing users, and there is no obvious tipping point at which appeal can be optimised and then improved little further the rail industry should simply make the journey as short as practicable. All existing users will appreciate faster journeys, but faster journeys will be a little more appealing to business travellers and commuters, than leisure travellers. Graph 2 Impact on passenger appeal as journey time decreases (output from non-linear model) example used is a route in the London suburban segment Relative appeal versus current headway Current in-vehicle time = 1 hour Commuter Business Leisure In-vehicle time (minutes) Best potential in-vehicle time = 45 mins 34
37 Graph 3 Impact on passenger appeal as frequency increases (output from non-linear model) example used is a route in the London suburban segment 1.5 Commuter Business Leisure Relative appeal versus current headway Current frequency = every 20 minutes Headway (minutes between trains) Best potential frequency = every 8 minutes Graph 3 shows the impact on passenger appeal as the time between trains frequency improves. Again, there is almost a linear relationship between frequency and appeal: existing users prefer more frequent trains. This clearly matters more to commuters than it does to business passengers, and especially leisure passengers (and this is consistent with the findings generated by the linear model). Finally, Graph 4 shows how appeal varies as the level of crowding on the train improves, and this graph shows a different kind of pattern. The relationship between level of crowding and appeal for existing users of the WCML is not at all linear, because a seated journey is clearly favoured over standing. There is a slight preference for less crowding when either seated or standing, but this is of less importance overall, than the fact of having a seat again this is consistent with the findings generated from the linear model. Graph 4 Impact on appeal as crowding ( load factor ) improves, and likelihood of seat increases (output from non-linear model) example used is a route in the London suburban segment Relative appeal versus worst possible crowding Commuter Business Leisure Load factor of 1 = 100 pax per 100 seats. At load factors higher than this, some have to stand; at lower load factors, all may sit Worst possible = 170 pax per 100 seats Load Factor (crowding, expressed as no. passengers per seat) 35
38 4 Future Passenger Priorities for the West Coast Main Line Commuters are a little less affected by increased crowding once already standing (because the gradient of the line once already standing is slightly less steep than for other types of passenger). Commuters are probably more used to having to stand and therefore more accepting of crowding once standing (if not accepting of having to stand in the first place); they are also likely to make slightly shorter journeys on average than leisure or business travellers, meaning that crowding once standing is less of an issue. The previous three graphs show how appeal changes as a single journey feature is improved, and so we can see how far the rail industry might need to push improvements in order to genuinely make a difference to passengers experiences. Of course it is also important to look at which of those journey features is more important this will indicate which features are the priorities for improvement, as well as knowing to what level they should be improved. Graph 5 below, puts all of the journey features into perspective, showing the relative appeal for each feature if they could be improved to their best possible Graph 5 level. We can see from the below that the relative appeal of less crowding is higher than the relative appeal of improved journey time or improved frequency for all types of passenger. Thus it would seem sensible for the rail industry to prioritise this aspect of their services, if budget and/or other issues do not allow all aspects of the service to be improved. (Note that it could be argued that by increasing frequency, crowding would be improved as a result, and so it could be possible to improve more than one aspect of the service via one action). Routes where interchanges could be necessary On routes where interchanges are necessary, the model generates similar predictions for passenger preferences for frequency, in-vehicle time and level of crowding, as was seen for the London suburban route above (an example of a route with no interchange). Passengers on routes with interchanges are predicted to have a better experience when frequency is higher (and as for non-interchange routes this is true for commuters in particular). Similarly, the patterns in appeal as journey time and crowding are improved on interchange routes, are also similar to the patterns seen above for the London suburban (no-interchange) route. Because the patterns for journey features are similar for routes with and without interchanges, we do not show more charts here to illustrate this. The difference for routes with necessary interchange is that the scenarios presented to these respondents also included interchanges, with different lengths of time offered to make the connection (including direct services). Graph 6 shows how passenger appeal varies as the impact of interchange improves, for an example route in the non-london interurban segment. Interchange is evaluated in terms of a wait time between connections of 40 minutes, all the way down to 10 minutes, and then no need to make a change Summary of impact of all journey features on passenger appeal (output from non-linear model) example used is a route in the London suburban segment Relative appeal versus current/worst possible Commuter Business Leisure Improve invehicle time to best possible (45 mins) Improve headway (frequency) to best possible (every 8 mins) Improve crowding to best possible (80 passengers per 100 seats) Improve all factors to best possible 36
39 Graph 6 Impact on passenger appeal as the impact of interchange increases (output from non-linear model) example used is a route in the non-london interurban segment Relative appeal versus worst possible (longest) wait time Worst possible = 25 min wait at connection Commuter Business Leisure Wait time (minutes for interchange) Lowest possible = 10 min wait at connection Best possible = direct train (i.e. a direct service). As illustrated, appeal increases a little as interchange time decreases that is, as the interchange has lower impact on their overall journey time. Graph 7 However the key insight is that all existing users on this route would vastly prefer to use a direct service and make no change at all. Indeed having a direct train is around twice as appealing as the shortest possible interchange waiting time. Summary of impact of all journey features on passenger appeal (output from non-linear model) example used is a route in the non-london interurban segment Relative appeal versus current/worst possible Commuter Business Leisure Improve in-vehicle time to best possible (45 mins) Improve headway (frequency) to best possible (every 8 mins) Improve crowding to best possible (80 passengers per 100 seats) Direct trains on this route Improve all factors to best possible As for the London suburban route, it is important to understand the relative importance of the different journey features, versus each other. Graph 7 summarises the level of appeal if each journey feature was improved to its best possible level. This time, we can see that having direct services is the most appealing of all potential improvements, and so should be the priority over other potential service improvements. 37
40 4 Future Passenger Priorities for the West Coast Main Line Implications of the findings for the five main market segments As described at the beginning of this report, the research among existing WCML users was conducted across five main market segments (London suburban, London urban, West Midlands suburban, London interurban and non-london interurban). Analysis showed that important differences exist between people travelling for different purposes, and not necessarily by market segment, and so the findings have thus far been discussed with regard to the differences between commuters, business and leisure travellers. However, the findings can be made more actionable when they are considered in relation to the five segments, since the segments also relate to either geographical areas along the WCML, or types of service that are offered. Therefore it is also important to consider the findings from this perspective. London suburban This segment is predominantly used by commuters for longer distance commutes (such as Watford to London), so the issues which are important to commuters will be the most important journey factors on these parts of the WCML. The most valuable way to improve passenger experiences in this segment would therefore be to reduce crowding (which could be achieved either via increased frequency or via additional carriages on trains), and journey times. As will be described in section 4.2, there is currently relatively low satisfaction with journey length in this segment and so improving journey times is likely to be of particular value for these WCML users. London Urban Again, journeys in this segment are primarily commutes, from destinations in and around London. Therefore, while getting a seat is the most important factor (of those surveyed), frequency is also important. Although frequency is shown to be a lower priority for improvement than other factors surveyed, frequency does carry greater importance for commuters than others, and has particular importance for this segment. Passengers in this segment are currently less satisfied with frequency than those in other segments 22% are dissatisfied (and this is not simply due to lower satisfaction in general among London urban passengers). This may be due to higher expectations, or commuters on these routes may be more sensitive to frequency because lower frequency can cause more crowding on trains. It is likely to be a combination of these factors that makes frequency more important. Increasing frequency would appear to be a useful strategy for improving passenger experiences for routes in this segment, as this is also likely to have a positive impact on the level of crowding and therefore the likelihood of getting seat. Journey time is of slightly lower importance, which is likely because journeys in this segment are very short (typically between about 6 and 20 minutes at present, depending on origin and destination), and the need to interchange was not given as an option to passengers in this segment since this is not relevant on such short journeys. West Midlands suburban This segment includes a slightly broader mix of journey purposes, although just over half of the sample are commuters. Additionally, this segment was sampled at peak times only (questionnaires were distributed during peak hours on weekdays only), meaning that all passengers surveyed were travelling under typical commuting conditions (i.e. heavy passenger volume and passengers paying peak time fares). Thus again we would say that the most important factors for passengers in this segment would be the ability to get a seat and provision of direct services, followed by journey length and frequency. With the exception of the London suburban segment, the West Midlands suburban segment is where passengers are most likely to be dissatisfied with the amount of space to sit (or stand) currently: a quarter are dissatisfied with this aspect of the service. This strengthens the notion that the level of crowding is the priority for improvement, from a customer perspective, on these routes. London interurban The majority of routes surveyed for this segment could require an interchange, therefore the provision of direct services is likely to be of particular value. As for commuters, improving crowding and journey times will also be valuable on these routes indeed, we have seen that space (often to work) is of great importance to business travellers, and the London interurban segment is particularly important for business travel. 38
41 Non-London interurban A large proportion of the journeys in the non-london interurban segment can involve an interchange currently (two thirds of the routes surveyed in this segment). This implies that provision of direct services would also be very beneficial for passengers on these routes and the survey findings show that direct services are the most influential factor on passenger experience for all routes with an interchange at present. Since there are also a sizeable number of commuters on these routes (55%), this would also make intuitive sense: commuting on a route where an interchange is possible will be rather laborious. The above are the key issues which are identifiable for each of the segments, based on the findings from this research alone. Network Rail has put these findings into the context of current service provision, patterns of passenger volume, and feasible logistical parameters, to produce defined recommendations on how to improve the product offering to passengers in each segment. Graph 8 Journey purpose Commuter Business Leisure Journey purpose, total existing user sample 16 % 18 % 66 % 4.2 Existing users of the WCML other findings The key outputs from the research are the parameters derived from fitting conjoint models to the preference data generated from the pairs of scenarios, as described above. However, the following are also some additional points of interest which emerged from the other questions on the survey. For many existing users, changes to the WCML service could mean real improvements in their daily lives Around two thirds of the existing users who completed the survey were commuters (see figures to graph 8) making the journey in question very frequently (4.6 days per week on average). This implies that if the right mix of positive changes to the WCML services are made, they have the potential to be very impactful and could make a positive difference to many people s daily lives. Note that the high proportion of commuters in the sample was partly designed in, since routes in the London suburban, London urban and West Midland suburban segments were surveyed only during peak times on weekdays. However this was felt to be appropriate for these segments, and so the sample provides a good representation of the WCML users who will be affected if proposals for HS2 go ahead. Table 3 Journey purpose by market segment Commuting Business Leisure London Suburban 77% 6% 16% London Urban 78% 12% 10% London Interurban 32% 39% 30% West Midlands Suburban 55% 18% 27% Non-London Interurban 53% 18% 29% Journey purpose, by segment in existing user sample As might be expected, London interurban routes (i.e. intercity routes such as Coventry to London) are important for business travel 39% of existing users surveyed on this route were travelling on business. All intercity routes were important for leisure trips, as were routes in the West Midlands suburban segment. 39
42 5 Future Passenger Priorities for the West Coast Main Line There is certainly scope to improve passenger experiences on the WCML Graph 9, shows the level of satisfaction overall with journeys made on the WCML, as well as satisfaction with the four key factors of interest for this survey. While few existing users (12%) are actually dissatisfied with their journey overall, there is a substantial number who are only either fairly satisfied or neither satisfied nor dissatisfied so there is room to improve the service and provide a better experience for more people. Frequency and journey length are satisfactory to most existing users, however the time allowed for interchange is less so. This data suggests that, of the four journey features covered in the survey, space for passengers to sit or stand on the train is in most need of attention, with nearly a third dissatisfied with this aspect currently. Thus improving the ability to get a seat, and reducing the impact of interchange (preferably by removing the need to interchange altogether) are likely to be the most popular changes. Table 4 shows how satisfaction with these aspects of the service varies for people making different types of journey. As can be seen, commuters tend to be less satisfied with most aspects of the journey than other types of passengers. With experience from other research where a similar pattern is also seen we know that this is for a number of reasons, including: They are in the work mind-set, very different from leisure travellers in particular They often have no choice about whether and how to make the journey They often pay the highest prices (for peak travel), and travel on the most crowded trains. Journey length appears to be one aspect of the journey with which commuters level of satisfaction is more in line with other travellers. However, one exception to this is for routes in the London suburban segment, where satisfaction is much lower than other commuter segments. Indeed this is an important factor in this segment s lower satisfaction with the journey as a whole. This could be explained by the routes in London suburban segment; typically passengers in this segment are making longer commuter journeys. Time spent to interchange and space to sit/stand are less satisfactory than other factors for all types of passenger, but space to sit or stand is a particular area for improvement for business and commuter trips. Graph 9 Satisfaction with current service Overall experience of service on route Frequency of trains on route Scheduled length of journey Time allowed for interchange Space to sit/stand Very/fairly satisfied % % % % % Very satisfied Fairly satisfied Neither satisfied nor dissatisfied Fairly dissatisfied Very dissatisfied Overall satisfaction with the current WCML service, and satisfaction with four key aspects of the service. Base: total existing user sample 40
43 Table 4 Satisfaction with current service Commuters Business Leisure Overall satisfaction with journey 66% 82% 86% Frequency of trains on route 73% 85% 85% Scheduled length of journey 84% 89% 88% Time allowed for interchange 54% 72% 73% Space to sit or stand 50% 64% 74% Satisfaction with aspects of current WCML service, by journey purpose. % scores are % either very or fairly satisfied When asked how their journey habits would change if preferred changes were made to the WCML service, a sizeable proportion (19%) of passengers said they would make many more journeys by train. There are of course other service features which are extremely important to existing users This survey was set up to evaluate the relative importance of four service features which might feasibly be improved as a result of capacity release on the WCML, if HS2 goes ahead: journey time, frequency, time impact of interchange and the amount of room to sit or stand. However, the questionnaire also gave existing users the opportunity to make any other comments about the service along their route, via an open-ended question. The following key topics arose from their comments, which align with findings from other passenger research that Passenger Focus has conducted: Reliability, i.e. punctuality versus minimisation and effective management of delays and disruption, will always be crucial I think the fundamental issue around satisfactory rail travel is timing ON TIME arrival and departure. This needs to be fixed. If a new line can fix this, then great. (Existing user on non-london interurban route) High prices are a very big issue for passengers and when combined with poor perceptions of reliability, often equates to feelings of poor value for money I do not believe the service I receive represents fair value (Existing user on London interurban route) Far too expensive. It should never be cheaper to drive somewhere than to get public transport (Existing user on London interurban route) The level of First Class provision can be controversial Need to get rid of first class it is hardly used while people are left standing (Existing user on West Midlands suburban route) Some also feel that improvements can be made to Parking at stations Cycle provision on trains Luggage space Facilities for the disabled. Poor reliability. Information is poor quality too much irrelevant info on the train indicator boards, not enough on when trains are actually expected when things go wrong. Also too few reserve crews (none at Euston) so disruption lasts for hours (Existing user on London suburban route) 41
44 5 Future Passenger Priorities for the West Coast Main Line 5 Findings from Potential market am the research: 5.1 Findings from the stated preference exercise The potential market for the WCML was defined as those who currently make journeys by car, which could feasibly be made by train. These excluded routes which would switch to the HS2 line, if it goes ahead (e.g. London to Manchester). This group were shown a range of rail journey scenarios, and asked how likely they would be to travel by train rather than car, given the configuration of service features presented to them. The following are the key findings arising from this exercise. As may be expected, rail scenarios which offer the best improvements are most appealing to car drivers The figure below shows the percentage of car drivers who would definitely or probably consider using the train for each scenario they saw, and the scenarios have been ranked in order of car drivers preference in the chart, from 1 to 16. The data shown here is for one route, as an example: the example used is a short journey. So, in scenario 1 (car drivers favourite), the features offered were the most desirable: Price: rail journey is 10 cheaper than equivalent car journey (best of four price levels presented) Frequency: every 8 minutes (best of four frequency levels presented) Space to sit/stand: 80 passengers per 100 seats (best of four crowding levels presented) Journey time: 15 minutes (fastest of four journey times presented). Graph 10 In scenario 16 (least preferred), the combination of features was the least desirable: Price: rail journey is 10 more expensive than equivalent car journey (worst presented) Frequency: every 10 minutes (not the worst level of frequency on offer, but not the best either, and other factors in this scenario are at their worst, making the overall combination least desirable) Space to sit/stand: 170 passengers per 100 seats (worst presented) Journey time: 18 minutes (almost the slowest presented). For shorter journeys, price will be the most influential factor in generating modal switch from car to train Graph 10 below, also indicates the price level presented as part of each scenario, through colour coding of the bars. The darker coloured bars, which represent the lowest price, are all towards the left hand side: i.e. lower price is strongly associated with the most appealing rail scenarios. A similar, although slightly less sharply defined pattern Appeal of individual rail scenarios to car drivers, indicating impact of price: short journey used as example % car drivers would probably or definitely travel by train in each scenario Colour of bar indicates price relative to current car journey, offered within scenario 10 cheaper 5 cheaper 5 more expensive 10 more expensive Rail Scenario (1 being driver s preferred; 16 being driver s least preferred) 42
45 ong car drivers was seen for the varying levels of on-train crowding. Therefore, after price, crowding is another very influential factor on the potential for modal switch from car to train on the WCML: if they are to switch to train, most car drivers will want to be guaranteed a seat. Graph 11 below, summarises both the importance of each service feature for encouraging modal switch on (short) journeys like those in the London suburban segment, as well as the relative appeal of each level of service within those features. In this graph, the higher the number, the more appealing and influential the feature. We can see at a glance that the most important aspect of a WCML train service for car drivers is the price. The next most influential feature, as we have seen, is the degree of crowding on the train. Note that the level of appeal does not have a directly linear relationship with the level of crowding: there is a big jump in appeal between options where you get a seat and options where you do not. This indicates that getting a seat is desirable, but that once sitting, there is relatively little difference in appeal between sitting on a train where all the seats are filled versus sitting when some other seats are empty: what car drivers mainly care about is getting a seat itself. Note that the analysis used in the summary chart below uses the Hierarchical Bayesian (HB) modelling approach to Conjoint analysis. This is a slightly different approach to that used for analysing the stated preferences of existing WCML users, for which the Multinomial Logit (MNL) approach was used. It was felt that the HB approach gave more sensible and useful results for the car driver sample. HB was used for the car drivers as MNL failed to deal adequately with the overwhelming influence of price on non-rail users motivations. Further details on the differences between these two modelling approaches can be found in the appendix. Graph 11 Summary of appeal of each level of service feature: short journey used as example Appeal (utility scores) Frequency In-vehicle time Price Crowding Every 15 minutes Every 12 minutes Every 10 minutes Every 8 minutes 20 minutes 18 minutes 17 minutes 15 minutes dearer than car 5 dearer than car 5 cheaper than car 10 cheaper than car seats, 80 passengers 100 seats, 100 passengers 100 seats, 120 passengers 100 seats, 170 passengers For longer journeys, both price and the provision of direct services will be very influential factors in generating modal switch from car to train The previous examples are based on a relatively short journey along the WCML route. For longer journeys, especially those where there is a need to change between trains along the route, the findings are slightly different. Graph 12 on the next page, takes an example of a long journey where interchanges are 43
46 5 Future Passenger Priorities for the West Coast Main Line Graph 12 Summary of appeal of each level of service feature: long journey used as example Appeal (utility scores) Frequency In-vehicle time Price Crowding Interchange Every 30 minutes Every 25 minutes Every 20 minutes Every 15 minutes 2 hours 40 minutes 2 hours 30 minutes 2 hours 25 minutes 2 hours 20 minutes dearer than car 10 dearer than car 10 cheaper than car 20 cheaper than car seats, 50 passengers 100 seats, 70 passengers 100 seats, 90 passengers 100 seats, 110 passengers Direct train 1 change, wait 15 minutes 1 change, wait 25 minutes 1 change, wait 40 minutes necessary, and indicates that, while price is still influential, having a direct train is more important if a trade-off needs to be made between price and interchange. Again, room to sit is also very important. These findings would also be evident if we were to look at the percentage likely to switch to train for each scenario, and observe the patterns of price, interchange and crowding within the scenarios, as we saw in the first bar chart in this section. Unless all journey features can be improved to their best potential, there is unlikely to be a one size fits all solution Interestingly, scenarios with a necessary interchange but an attractive price had almost exactly the same degree of appeal as scenarios with a direct service but a more expensive fare. This suggested that direct trains and inexpensive fares are priorities for different people, i.e. unless both can be improved, the rail industry will need to decide whether it is more important to seek to attract those willing to pay more by implementing direct services, or to target those who are only slightly concerned about direct services if the price is right. 5.2 Core target market among car drivers other key findings from the research In addition to understanding motivations to switch from car to train, it is also important to consider the size of the core target market, and how likely they would be to switch to train. There is a core target market who could potentially switch from car to train Respondents who made relevant journeys by car were in scope for this survey. From graph 13, we can see that there 44
47 Graph 13 Size of core target market and reasons for exclusion Core target market Peripheral market Would never consider train Current users Travel with others % Long Medium Short Base: All those approached for the survey who make relevant journeys by car is a core target market, particularly for long distance journeys. This core market is defined as people who make relevant car journeys, have not used the train in the last year, and are not rejecters of train. People in the core market have the most potential to switch from car to trains along the WCML. There is also a peripheral market, which consists of people who have made the journey by car, but do so infrequently (i.e. over six months ago). Of the non-switchers, many are rejecters of trains or currently use the WCML to make train journeys. A good proportion of this core target market would consider switching to train For the stated preference task we could see that for some scenarios car drivers would consider switching from car to train, if price, journey time, crowding and/or interchange were preferable. If we look at the average of car drivers responses for all scenarios shown, we can see (Table 5) that a considerable proportion would probably or definitely travel by train: Table 5 % of car drivers who would probably/ definitely travel by train for the scenarios shown Short journeys 41% Medium journeys 38% Long journeys 29% 45
48 5 Future Passenger Priorities for the West Coast Main Line The best case scenarios which were preferred by a greater proportion of car drivers, would encourage even more car drivers to switch to train, so there is a real opportunity to encourage modal switch for some current car drivers, across all types of journey. However, the penetration of these potential switchers amongst our sample was small Many people who were approached for this survey were not eligible, which implies that the actual penetration of the core target market in the catchment area of the selected stations is currently small. However, the penetrations of potential switchers may be higher in areas where medium-long distance car drivers are more likely to be found, for example near motorways. It would be sensible to test this proposition before any final conclusions are drawn. Graph 14 below includes those people who were out of scope for this survey, and for longer routes in particular, many people (65%) living in the station catchment area simply do not currently make the journey in question by any mode although this is less of a market limitation for shorter journeys (and people in these areas may make other journeys by train, or may make these particular journeys in future). This means that the market penetration of the core market in the total catchment area of the selected stations is currently an average of 6%. This research also found that, in the catchment area of the selected stations, a substantial proportion of the journeys made along the WCML route by car drivers are relatively infrequent leisure trips, so do not represent high volume. Of course none of the above accounts for any changes that improved rail services might make to the profile of people living in station catchment areas. We cannot tell from this research whether improved rail services would attract people to live in the area, and thus create a new market of people making entirely new journeys that are not made currently, either by train or by car/other modes. Barriers to train reflect potential motivations identified by the stated preference task Car drivers were asked about their reasons for not using the train for relevant journeys. As can be seen in graph 15, the principle reason was the reluctance to be tied to times, followed by: Cost / value for money Difficulty in access/egress to/from the station Potential for delays and disruption Necessity of an interchange with another train or other mode of transport. Graph 14 Penetration of core target market % Core target market Peripheral market Would never consider train Current users Travel with others Do not make that journey (out of scope) Do not make journey by car (out of scope) Long Medium Short 14 Base: All those approached for the survey 46
49 Graph 15 Reasons for not using train for WCML journeys Don t wish to be tied with times Cost / poor value for money Difficulty in astation access / egress Too many delays Need to interchange with train / other mode Parking too expensive Difficult with children Habit / don t really think about it Difficult with baggage Inadequate station parking Trains too infrequent Total time for door-to-door journey Trains too crowded Hassle Poor information provision (eg train times) Concern about personal safety on trains / stations Difficult due to disability Lack of staff on trains / stations Lack of comfort on board trains Other 8% 8% 7% 7% 6% 6% 6% 6% 5% 5% 5% 4% 3% 3% 2% 2% 2% 2% 1% 12% Some of these issues were not covered by the stated preference exercise, in which the survey covered only frequency, journey time, crowding, interchanges and price. However beyond these additional areas, the findings are consistent, indicating that price and provision of direct train services are influential in encouraging mode switch among car drivers. Arguably, the cost of rail travel is also difficult to separate from the issue of flexibility the biggest barrier for car drivers since cheaper tickets tend to be more restricted and flexibility comes at a sometimes very high price. 47

50 A Future Passenger Priorities for the West Coast Main Line Appendix Questionnaire distributed to existing users of the WCML (example shown is for Route 64: Coventry-Milton Keynes) 48
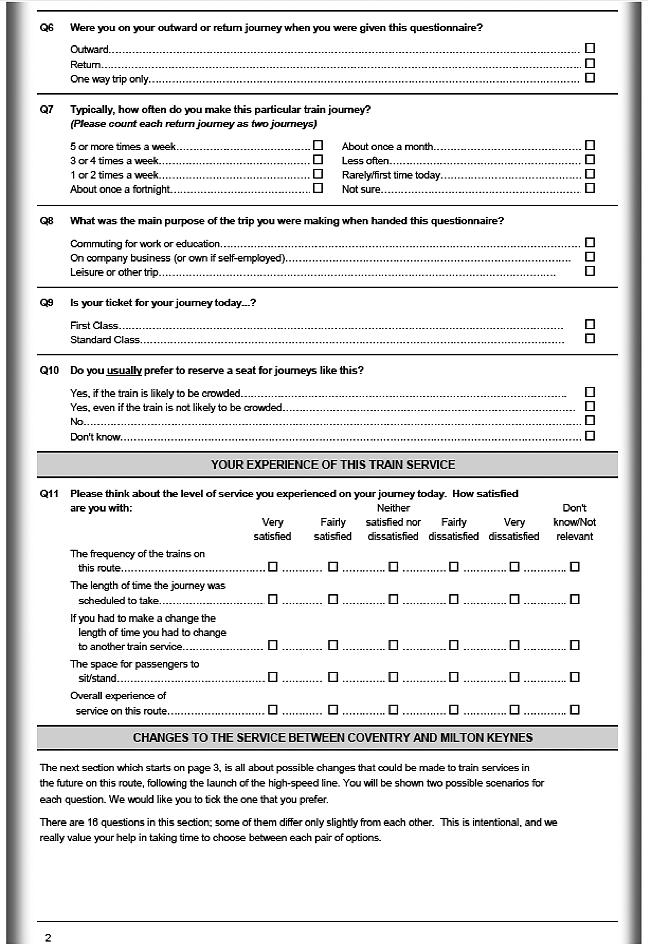
51 49

52 A Future Passenger Priorities for the West Coast Main Line 50
53 51
54 A Future Passenger Priorities for the West Coast Main Line 52
55 53

56 A Future Passenger Priorities for the West Coast Main Line 54
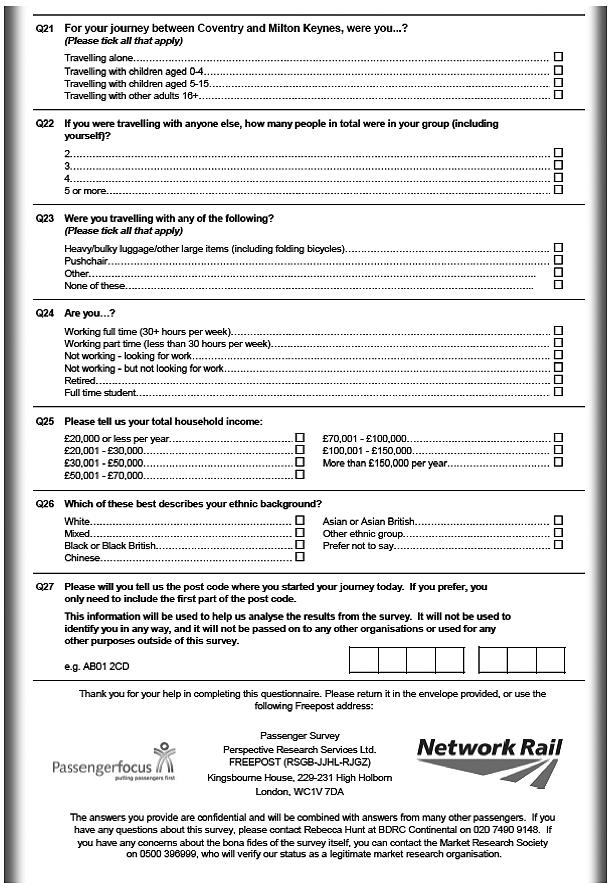
57 55

58 A Future Passenger Priorities for the West Coast Main Line Questionnaire distributed to car drivers (example shown is for Route 1: Coventry-central Birmingham) 56
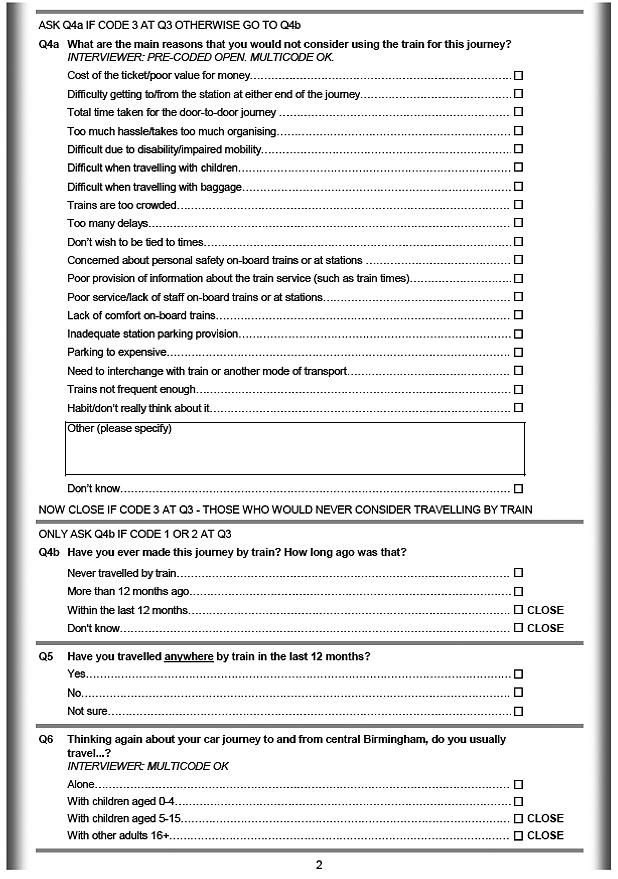
59 57

60 A Future Passenger Priorities for the West Coast Main Line 58
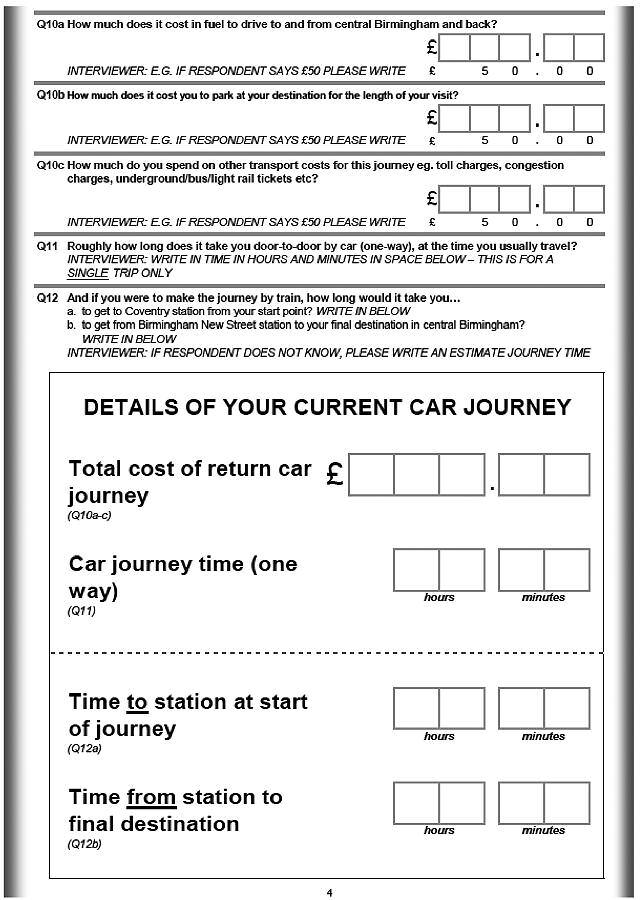
61 59

62 A Future Passenger Priorities for the West Coast Main Line 60
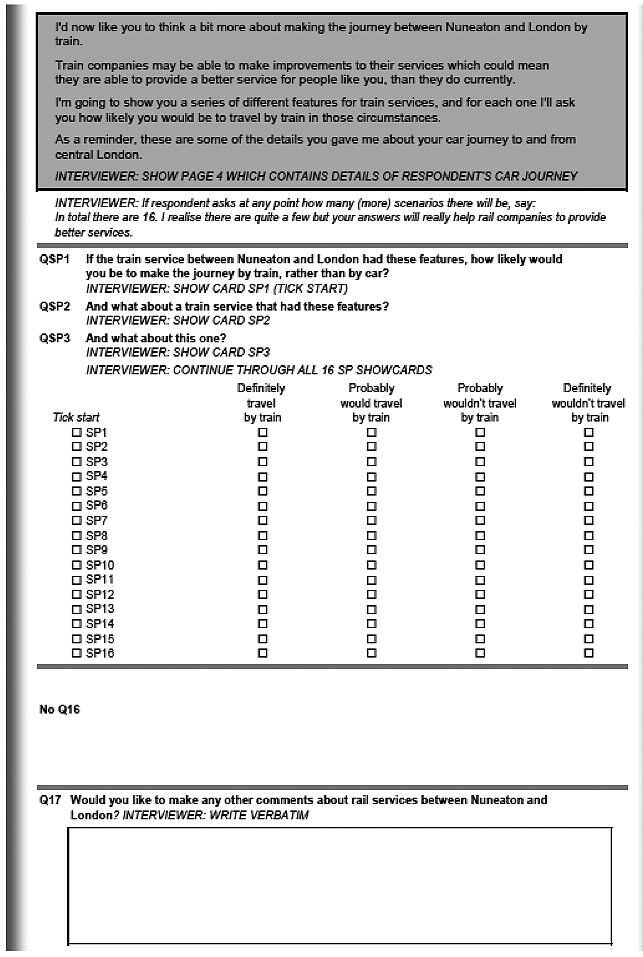
63 61

64 A Future Passenger Priorities for the West Coast Main Line 62