REINVENTING. the future of cleaning. INVESTOR PRESENTATION November 2016 TENNANTCO.COM
|
|
|
- Kathryn Oliver
- 5 years ago
- Views:
Transcription

1 REINVENTING the future of cleaning. INVESTOR PRESENTATION November 2016 TENNANTCO.COM
2 Safe Harbor Statement This presentation contains certain statements that are considered forward-looking statements within the meaning of the Private Securities Litigation Reform Act of Forward-looking statements generally can be identified by the use of forward-looking terminology such as may, will, expect, intend, estimate, anticipate, believe, project, or continue or similar words or the negative thereof. These statements do not relate to strictly historical or current facts and provide current expectations of forecasts of future events. Any such expectations or forecasts of future events are subject to a variety of factors. We caution that forward-looking statements must be considered carefully and that actual results may differ in material ways due to risks and uncertainties both known and unknown. Information about factors that could materially affect our results can be found in Part I, Item 1A, Risk Factors in our Annual Report on Form 10-K for the year ended December 31, 2015, and in Part II, Item 1A Risk Factors in our most recent quarterly report on Form 10-Q. Shareholders and potential investors are urged to consider these factors in evaluating forward-looking statements and are cautioned not to place undue reliance on such forward-looking statements. We undertake no obligation to update or revise any forward-looking statement, whether as a result of new information, future events or otherwise. Investors are advised to consult any further disclosures by us in our filings with the Securities and Exchange Commission and in other written statements on related subjects. It is not possible to anticipate or foresee all risk factors, and investors should not consider any list of such factors to be an exhaustive or complete list of all risks or uncertainties. 2


3 About Tennant Company 71 consecutive years of cash dividends 44 consecutive years of increase in annual cash dividend payout Balance sheet Tennant Company, a Minnesota corporation founded in 1870 and incorporated in 1909, is a world leader in designing, manufacturing and marketing solutions that empower customers to achieve quality cleaning performance, significantly reduce environmental impact and help create a cleaner, safer, healthier world Revenues: $812M 2015 Employees: 3,164 NYSE Symbol: TNC 3


4 OUR VISION We will lead our global industry in sustainable cleaning innovation that empowers our customers to create a cleaner, safer and healthier world. 4

5 Competitive Landscape 2015 $5B Global Cleaning Equipment Market* Tennant Nobles Alfa Orbio 18% Nilfisk Advance Clarke Viper Karcher Windsor TecServ ProChem Hako Minuteman PowerBoss Taski 17% 11% 9% 3% 42% of the market consists of others with a market share of 3% or less. * Estimated market size in constant currency U.S. dollars for Tennant-like equipment categories and aftermarket. 5


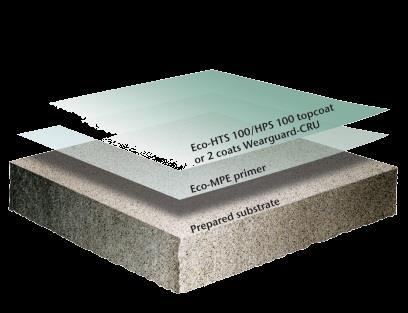


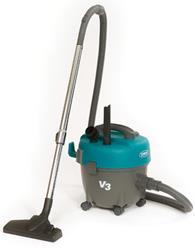
6 COMMERCIAL INDUSTRIAL ESSENTIALS AFTERMARKET Broad Portfolio of Quality Products ORBIO TECHNOLOGIES COATINGS 6


7 Strong STRONG Direct DIRECT Sales SALES & Service Organizations & SERVICE ORGANIZATIONS Global Revenue by Sales Channel Global Sales Employees Global Direct Service Employees Direct 75% % Distribution Americas EMEA APAC Americas EMEA APAC Distribution Partners More than 80 countries around the world Global Strategic Accounts Cross-functional teams & market specialists Factory-Service Direct Locally based & factory-trained service technicians 7


8 Broad Range of Global Customers MARKETS 8 8
9 2015 Revenue of $812M EMEA 17% 61% Equipment* *Equipment Mix Commercial 52% Industrial 44% Outdoor 4% Americas 73% Net Sales by Geography APAC 10% Service & Other Net Sales by Product Group 14% 22% Parts & Consumables 3% Coatings 9 9


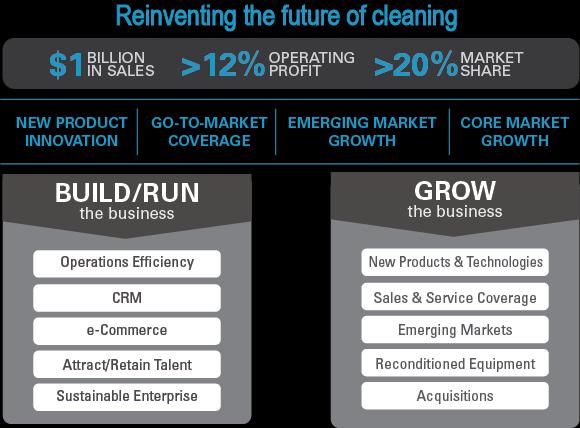
10 Growth Strategy We remain committed to organic Sales goal of $1 Billion and 12% or above Operating Profit Margin Reach new markets and new customers Deliver a strong product & technology pipeline Build Tennant s e-business capabilities Be disciplined about improving margins & controlling expenses 10
 New Products $80M (up to 3%) Emerging Markets $40M (up to 2%) 11")
11 Our Journey to $1 Billion GDP Growth $60M (2%) $1B $752M Go-To-Market $70M (up to 3%) New Products $80M (up to 3%) Emerging Markets $40M (up to 2%) 11 11

12 Our Progress toward $1 Billion Growth from overdelivery on new products & go-tomarket initiatives partially offset by major foreign currency headwinds 12
13 Strategic Priorities. 13


14 Sales & Service Coverage Increasing our Presence 3 COMPONENTS OF MARKET SHARE ENHANCED GO-TO-MARKET STRATEGY VERTICAL MARKETS & MARKETING ANALYTICS Industrial Retail Product Portfolio Hit Rate Market Coverage (Presence) Education Healthcare 14
15 Emerging Markets Focused approach Long-term growth potential despite economic headwinds China Organic Sales Growth % 5.5% 2015 Organic Sales Growth % 3.5% 2015 Brazil 15


16 Operations Efficiency Strategy Deployment to Drive Four Key Initiatives VELOCITY & LEAN SUPPLY CHAIN OPTIMIZATION Be the absolute leader for serving the customer! SERVICE LEVELS QUALITY FOCUS 16


17 CRM & Marketing Automation Perpetual Lead Generation Prospecting Leverage deep history to prioritize the known Visualize the potential to discover the new Speed-to-Lead Better lead visibility and new processes mean we can convert leads faster Keep the lead pipeline full with automated marketing capabilities embedded inside CRM 17


18 e-commerce Cleaning solutions made easy online Good Experience Empower our customers Anticipate their needs Enhance their experience Increase Revenue New customers New geographies Expand products Lower Cost of Sale Self-service Reduce manual interventions Cost avoidance 18


19 Reconditioned Equipment Attracting a New Set of Customers New Commercial Recon Facility New e-commerce Website 19 19
20 Attract & Retain Talent Tennant Employee Value Proposition Talent Management Focus Commitment to Innovation Rewarding work with opportunity for career growth A Focus on Stewardship Strong Legacy Build a world-class talent acquisition function Develop leadership & key talent capabilities Align high-performance culture with business strategy 4 Reward performance that creates value 20

")
 Disclosure")

21 Sustainable Enterprise Tennant Corporate Sustainability Report Score 2012 CY ( 13 Report) 2013 CY ( 14 Report) 2014 CY ( 15 Report) Disclosure Performance Band D C C Industry Average 49/C 53/C 60/D 21


22 New Product Development Strongest Product Pipeline Ever!

23 Tennant Company New Products Launched M20 & M30 Sweeper-Scrubbers and T20 Heavy-Duty Industrial Rider Scrubber with hightech features Touch-n-Go TM Steeringwheel-mounted control module Pro-Panel TM intuitive touch-screen interface 23

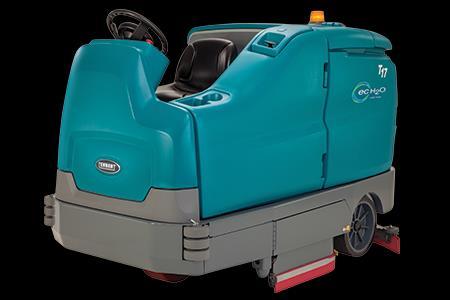
24 M17 Battery-Rider Sweeper-Scrubber VERTICAL MARKETS Logistics & Manufacturing VALUE PROPOSITION Full single-pass cleaning capability (sweeping/scrubbing) & fume-free operation ProPanel provides a high-visibility, operator-centric interface with PerformanceView camera, operator security log-in, safety checklists & onboard training Improved shrinkwrap recovery answers significant market need 24


25 ec-h2o NanoClean The Responsible Way to Clean Next generation ec-h2o Cleans more soils in more applications ec-h2o SCRUBBERS 2008 thru 3Q 2016 HOW IT WORKS: $1.0 billion+ cumulative revenue 85,000+ machines Record Sales of $157M in ,000+ customers 30,000+ sites 25


26 ORBIO Technologies On-Site Generation Technology Improving health and safety for the environment, employees and people in their care while reducing costs. GENERATES cleaner & disinfectant/sanitizer on-site FOCUS ON 3Cs CAMPUS CHAINS CONTRACTORS 26

27 Customer Insights Reinventing the Way the World Cleans PRODUCTS FEATURES & BENEFITS FUNCTIONAL BENEFITS SOLUTIONS EMOTIONAL BENEFITS Traditional Approach Voice of customer & needs identification to shape new product development NEW Thinking Acknowledge the reality of our customer s business Deploy new tools for better insights Think solutions, not just products Objective research from innovation experts Challenge status quo new lens for opportunities Embrace a holistic view of our customers 27


28 Advanced Product Development Future Technologies + Asset Management Battery Technologies Water Recycling Robotics (AGV) Manage cleaning programs better Fleet management Lower cost-to-clean Lithium-Ion, Fuel Cell, etc. Improving cost & availability ROI for customer Reduced weight & footprint size Sustainability Productivity Game-changing solution Addresses labor costs Largest potential growth opportunity 28


29 IRIS Asset Management System CUSTOMERS Manage cleaning programs better Fleet management Lower cost-to-clean ON-BOARD MACHINE DIAGNOSTICS Increased Market Differentiation Service Efficiency Customer Intimacy 29


30 Acquisitions Strategic Filters Sales & Service Coverage Underserved Markets Complementary Products Technology Platforms 30
31 FINANCIAL Summary Reinventing the future of cleaning. 31
32 2015 Full Year Organic Sales Growth 4.3% Americas Sales up 6.4% Organically CHANGE SALES $811.8 M $822.0 M (1.2%) GROSS MARGIN 43.0% 42.9% +10 bps R&D EXPENSE (% of sales) Adjusted* S&A EXPENSE (% of sales) Adjusted* OPERATING PROFIT Adjusted* OPERATING PROFIT MARGIN Adjusted* DILUTED EPS 4.0% 30.6% $68.1 M 8.4% $ % 30.5% $72.1 M 8.8% $ bps +10 bps (5.5%) (40 bps) (7.8%) *2015 results are adjusted to exclude restructuring charge in S&A of $3.7M pre-tax ($0.17 per diluted share) and non-cash long-lived asset impairment of $11.2M pre-tax ($0.58 per diluted share). 32
33 2015 Full Year Constant Currency View (excludes estimated foreign exchange impact) SALES GROSS MARGIN Adjusted* OPERATING PROFIT Adjusted* OPERATING PROFIT MARGIN Adjusted* DILUTED EPS AS REPORTED 2015 $811.8 M 43.0% $68.1 M 8.4% $2.49 CONSTANT (1) CURRENCY CHANGE $857.1 M 43.8% $81.4 M 9.5% $3.00 $822.0 M 42.9% $72.1 M 8.8% $ % +90 bps +12.9% +70 bps +11.1% (1) Constant Currency : estimated income statement which assumes no change in exchange rates from prior year. *2015 results are adjusted to exclude restructuring charge in S&A of $3.7M pre-tax ($0.17 per diluted share) and non-cash long-lived asset impairment of $11.2M pre-tax ($0.58 per diluted share). 33
34 4.3% Organic Sales Growth in 2015 Full Year Americas 2015 Organic Sales 6.4% EMEA 2015 Organic Sales (2.1%) APAC 2015 Organic Sales 1.3% 34
35 2016 Third Quarter Organic Sales Growth (2.2%) Americas Sales up 1.2% Organically Q3 16 Q3 15 CHANGE SALES $200.1 M $204.8 M (2.3%) GROSS MARGIN 42.6% 43.3% (70 bps) R&D EXPENSE (% of sales) Adjusted* S&A EXPENSE (% of sales) Adjusted* OPERATING PROFIT Adjusted* OPERATING PROFIT MARGIN Adjusted* DILUTED EPS 4.2% 30.3% $16.3 M 8.1% $ % 30.7% $17.5 M 8.6% $ bps (40 bps) (7.4%) (50 bps) (5.9%) *Q3 15 results are adjusted to exclude restructuring charge in S&A of $1.8M pre-tax ($0.09 per diluted share) and non-cash long-lived asset impairment of $11.2M pre-tax ($0.64 per diluted share). 35
36 2016 Third Quarter Constant Currency View (excludes estimated foreign exchange impact) SALES GROSS MARGIN Adjusted* OPERATING PROFIT Adjusted* OPERATING PROFIT MARGIN Adjusted* DILUTED EPS AS REPORTED Q3 16 $200.1 M 42.6% $16.3 M 8.1% $0.64 CONSTANT (1) CURRENCY Q3 16 Q3 15 CHANGE $200.1 M 42.4% $15.8 M 7.9% $0.62 $204.8 M 43.3% $17.5 M 8.6% $0.68 (2.3%) (90 bps) (10.2%) (70 bps) (8.8%) (1) Constant Currency : estimated income statement which assumes no change in exchange rates from prior year. *Q3 15 results are adjusted to exclude restructuring charge in S&A of $1.8M pre-tax ($0.09 per diluted share) and non-cash long-lived asset impairment of $11.2M pre-tax ($0.64 per diluted share). Organic Sales Growth was approximately (2.2%), foreign currency exchange impact was neutral and excluded the net unfavorable impact from the divestiture of Green Machines and the acquisition of Florock of 0.1%. 36
37 2016 First Nine Months Organic Sales Growth 0.1% Americas Sales up 1.9% Organically YTD 16 YTD 15 CHANGE SALES $596.8 M $605.9 M (1.5%) GROSS MARGIN 43.2% 43.2% +0 bps R&D EXPENSE (% of sales) Adjusted* S&A EXPENSE (% of sales) Adjusted* OPERATING PROFIT Adjusted* OPERATING PROFIT MARGIN Adjusted* DILUTED EPS 4.1% 31.4% $45.9 M 7.7% $ % 31.2% $48.4 M 8.0% $ bps +20 bps (5.1%) (30 bps) +1.8% *YTD 15 results are adjusted to exclude Q3 15 restructuring charge in S&A of $1.8M pre-tax ($0.09 per diluted share) and non-cash long-lived asset impairment of $11.2M pre-tax ($0.64 per diluted share). 37
38 2016 First Nine Months Constant Currency View (excludes estimated foreign exchange impact) AS REPORTED YTD 16 CONSTANT (1) CURRENCY YTD 16 YTD 15 CHANGE SALES $596.8 M $602.7 M $605.9 M (0.5%) GROSS MARGIN Adjusted* OPERATING PROFIT Adjusted* OPERATING PROFIT MARGIN Adjusted* DILUTED EPS 43.2% $45.9 M 7.7% $ % $47.5 M 7.9% $ % $48.4 M 8.0% $ bps (1.8%) (10 bps) +5.3% (1) Constant Currency : estimated income statement which assumes no change in exchange rates from prior year. *YTD 15 results are adjusted to exclude Q3 15 restructuring charge in S&A of $1.8M pre-tax ($0.09 per diluted share) and non-cash long-lived asset impairment of $11.2M pre-tax ($0.64 per diluted share). Organic Sales Growth was approximately 0.1%, excluding approximately 1.0% unfavorable foreign currency exchange impact and the net unfavorable impact from the divestiture of Green Machines and the acquisition of Florock of 0.6%. 38
39 NET SALES (in millions) History of Sales Growth Average Organic Sales Growth of 7% $800 $700 $600 $500 $400 $300 $200 $100 $553 $599 Organic Growth $664 $701 $596 $668 $754 $739 $ Guidance $805M to $822 $812 $815M Anticipated Organic Growth 8% 7% 6% <1.5%> <13%> 12% 10.5% 0% 3% 10.3% 4.3% 0.2%-1.4% $
40 TENNANT COMPANY Strong Balance Sheet FY 15 YTD Sept 15 YTD Sept 16 Commitment To Shareholder Return 40
41 Average Invested Capital Improved Profitability & Balance Sheet Leverage Return on Invested Capital Improvement * $000s $240,000 $230,000 $220,000 $210,000 $200,000 $223, % 25.7% $214, % 30.9% $206,954 $212, % $227, % $223, % 30.0% 25.0% 20.0% 15.0% $190, % $194, % $180,000 $170,000 Adj OP $19.5M Adj OP $39.2M Adj OP $55.2M Adj OP $62.7M Adj OP $65.4M *On a Constant Currency basis, 2015 ROIC would have been 33.7%. OP $72.1M Adj OP $68.1M 5.0% 0.0% 41 41
42 Operating Profit Margin Goal Remain committed to at least 12% OP Margin Sales Growth 5-9% Gross Margins 43-44% R&D 3-4% S, G & A Expense 27-28% Drive organic revenue growth in mid- to highsingle digits Hold fixed costs essentially flat in manufacturing as volume rises Strive for zero net inflation at gross profit line Continue to invest in innovative new products & technologies Standardize & simplify processes to improve scalability of business model 42
43 2016 EPS & Sales Guidance 2015 ACTUAL As Reported $1.74 EPS $811.8M SALES As Adjusted $2.49 EPS $811.8M SALES 2016 Financial Outlook $2.40 to $2.60/$805M to $815M KEY EXPECTATIONS FOR 2016 Net sales in the range of $805M to $815M versus $811.8M in Continued slow economic growth in North America, modest improvement in Europe, and growth in emerging markets. Unfavorable foreign currency impact on sales of approximately 1%. Sales decline from Green Machines divestiture of approximately 1%. Sales increase from Florock acquisition of approximately 1%. Organic sales growth, excluding foreign currency exchange impact, divestiture and acquisition in the range of 0.2% to 1.4%. Foreign currency exchange headwinds estimated to negatively impact operating profit in the range of $2M to $3M, or approximately $0.08 to $0.12 EPS. Gross margin performance in the range of 43% to 44%. R&D expense of approximately 4% of sales. Effective tax rate of approximately 31% (negatively impacting 2016 by approximately $0.05). Capital expenditures in the range of $25M to $30M. 43

44 Summary $1B Anticipate foreign currency & global economic volatility remain challenging Tennant has never been positioned better in the market with its innovative product and technology portfolio and go-tomarket strategy We remain committed to our goals of $1 Billion in organic sales & a 12% or above operating profit margin 44