Dry Pipes: Associations between Utility Performance and Intermittent Piped Water Supply in Low and Middle Income Countries
|
|
|
- Hilda White
- 5 years ago
- Views:
Transcription

1 Dry Pipes: Associations between Utility Performance and Intermittent Piped Supply in Low and Middle Income Countries Dr. Jessica Kaminsky, University of Washington, & Dr. Emily Kumpel, University of Massachusetts Amherst,

2 Intermittent Supply (IWS) Serves ~ 1 billion people globally quality, quantity, cost, & health impacts to consumers May mean consumers abandon utilities

3 Research Question & Data Identify associations between International Benchmarking Network (IBNET) Data & IWS 2155 utilities from 46 countries All water variables Utilities coded as intermittent or not
4 Method Limitations 125 separate multiple logistic regression models IBNET data self-reported by utilities Control for GNI per capita, urban/rural proxy Statistical p < 0.05 & p < Binary definition of IWS Hows & whys / direction of causality
5 Selected Results 42 statistically significant variables (p < 0.05) 5 statistically significant variables (p<0.000) (Municipal vs. Regional Company, Total Number of Staff, WUPI, Operational Cost Split - %, Continuity of Service (hrs/day)) Selected Themes Physical Infrastructure
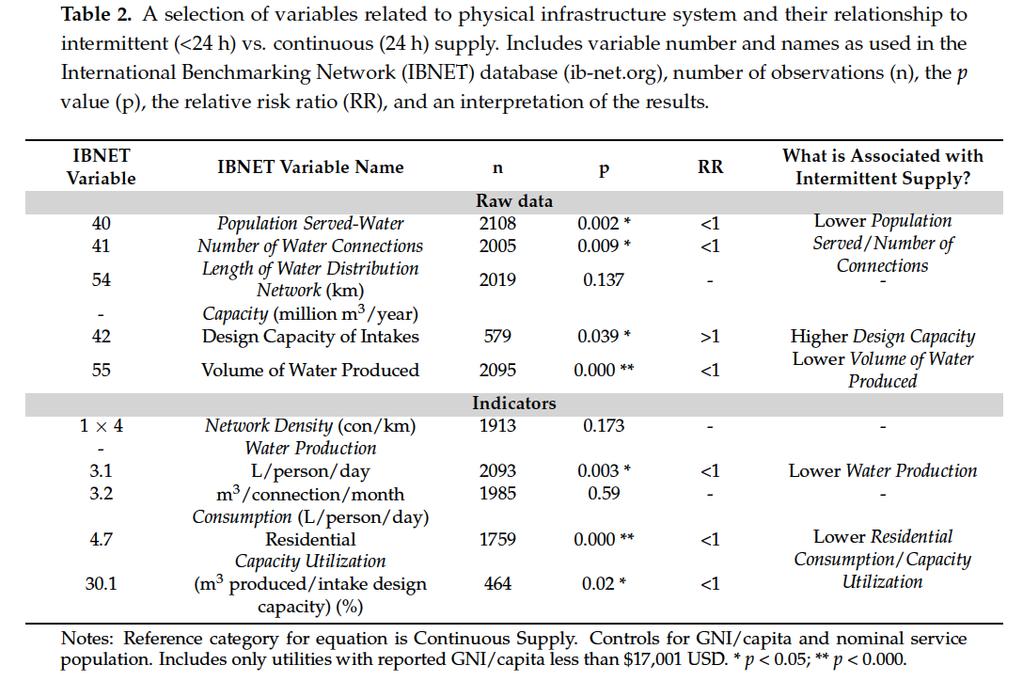
6 Infrastructure For example Population served Number of water connections Design capacity of water intakes Length of distribution network Network density Volume of water produced
7 Infrastructure INTERMITTENT Lower Availability CONTINUOUS Higher Availability
8 Infrastructure INTERMITTENT CONTINUOUS Lower Availability Higher Availability For Example (Lower) Production Per Person & (Lower) Raw Volume of Produced are significantly associated with intermittency
9 Infrastructure INTERMITTENT CONTINUOUS Lower Availability Higher Availability For Example (Lower) Production Per Person & (Lower) Raw Volume of Produced are significantly associated with intermittency But, Production per Connection is not significantly associated with intermittency
10 Overall (IBNET 1.1) is the population with access to water services (either with direct service connection or within reach of a public water point) as a percentage of the total population under utility s nominal responsibility
11 INTERMITTENT Lower Overall What s Going On? Utilities that serve lower % of population also tend to have intermittent supply CONTINUOUS Higher Overall More research needed to explain why - population growth, etc.
12 INTERMITTENT Lower Overall via (PWP) CONTINUOUS Higher Overall via Household Connections
13 INTERMITTENT More People, & Higher Percentage of People, served by PWP CONTINUOUS Fewer People, & Lower Percentage of People, served by PWP
14 INTERMITTENT CONTINUOUS More People, & Higher Percentage of People, served by PWP Fewer People, & Lower Percentage of People, served by PWP So What? Results generally support policies of eliminating PWP (concerns with subsidies, etc.) But, Per Capita Use from PWP is not a significant predictor of intermittency PWP as cause of or reaction to intermittency?
15 Residential Commercial/Industrial Institutional/Other Bulk Total
16 What is Associated with Intermittency? Volume Sold (59-59d) Consumption (% Total) ( ) Revenue (% Total) ( ) Billings (90e-90h) Residential Lower - Higher Lower Commercial/Industrial Lower Higher Lower Lower Institutional/Other Lower Lower - Lower Bulk Total Lower - - Data Unavailable
17 What is Associated with Intermittency? Volume Sold (59-59d) Consumption (% Total) ( ) Revenue (% Total) ( ) Billings (90e-90h) Residential Lower - Higher Lower Commercial/Industrial Lower Higher Lower Lower Institutional/Other Lower Lower - Lower Bulk Total Lower - - Data Unavailable
18 What is Associated with Intermittency? Volume Sold (59-59d) Consumption (% Total) ( ) Revenue (% Total) ( ) Billings (90e-90h) Residential Lower - Higher Lower Commercial/Industrial Lower Higher Lower Lower Institutional/Other Lower Lower - Lower Bulk Total Lower - - Data Unavailable Lower volumes sold, and correspondingly lower billings, tend to be associated with intermittent supply.
19 What is Associated with Intermittency? Volume Sold (59-59d) Consumption (% Total) ( ) Revenue (% Total) ( ) Billings (90e-90h) Residential Lower - Higher Lower Commercial/Industrial Lower Higher Lower Lower Institutional/Other Lower Lower - Lower Bulk Total Lower - - Data Unavailable More utility revenue from residential consumers, and less revenue from commercial/industrial consumers, is associated with intermittent supply.
20 What is Associated with Intermittency? Volume Sold (59-59d) Consumption (% Total) ( ) Revenue (% Total) ( ) Billings (90e-90h) Residential Lower - Higher Lower Commercial/Industrial Lower Higher Lower Lower Institutional/Other Lower Lower - Lower Bulk Total Lower - - Data Unavailable BUT, higher consumption from Commercial/Industrial consumers is associated with intermittent supply.
21 INTERMITTENT Higher Consumption by Commercial/Industrial s CONTINUOUS Higher Revenue from Commercial/Industrial s
22 INTERMITTENT CONTINUOUS Higher Consumption by Commercial/Industrial s Higher Revenue from Commercial/Industrial s What s Going On? Temporally or geographically concentrated demands? Utilities may prioritize big customers? Non-payment of larger bills may impact financial resiliency? Higher logistical challenges of collecting revenue from many HH vs. fewer commercial/industrial customers More research needed this consumer type may be a leverage point for IWS
23 (NRW) is water that is delivered but not paid for.
24 INTERMITTENT No Statistically Significant Associations Observed for NRW CONTINUOUS No Statistically Significant Associations Observed for NRW
25 INTERMITTENT CONTINUOUS No Statistically Significant Associations Observed for NRW No Statistically Significant Associations Observed for NRW What s Going On? Physical losses Depend on pressures & time of supply Commercial losses Depend on metering More research needed
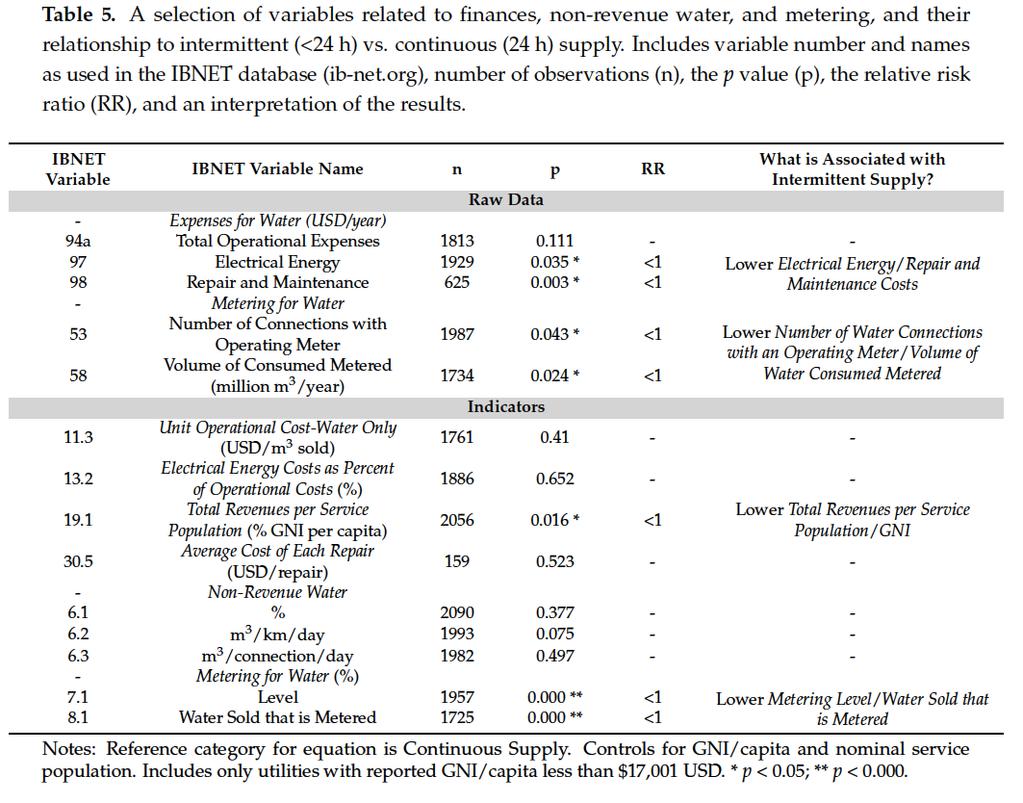
26 factors have to do with money (costs, revenue, billing, etc.)
27 INTERMITTENT Fewer Utility Resources (lower operating cost coverage, lower total revenues as % GNI) CONTINUOUS Greater Utility Resources (higher operating cost coverage, higher total revenues as % GNI) Note, the analysis controls for GNI/capita
28 INTERMITTENT CONTINUOUS Fewer Utility Resources (lower operating cost coverage, lower total revenues as % GNI) Greater Utility Resources (higher operating cost coverage, higher total revenues as % GNI) But Many IBNET financial metrics are not statistically significant predictors of IWS (total operational expenses, unit operational cost of water, average cost of repairs, electrical energy as % of operational costs, etc.) Need to integrate context: are higher costs waste, or contextual necessity? Note, the analysis controls for GNI/capita
29 High consumption & lower revenue from commercial/industrial customers IWS is Associated with Lower water availability Utilities that serve lower % of population (lower coverage) (but not per capita water use from PWP)
30 IWS is Associated with Lower water availability Utilities that serve lower % of population (lower coverage) (but not per capita water use from PWP) High consumption & lower revenue from commercial/industrial customers Utility Indicators (for IWS) Should normalize on people, not infrastructure scale Should use contextualized financial indicators Should adjust non-revenue water indicators in IWS contexts
31 Thank You! Kaminsky, J., Kumpel, E. (2018). "Dry Pipes: Associations between Utility Performance and Intermittent Piped Supply in Low and Middle Income Countries.". (10) 8, doi: /w OPEN ACCESS. Dr. Jessica Kaminsky, University of Washington, & Dr. Emily Kumpel, University of Massachusetts Amherst,
32
33
34
35
36