J.P. Morgan Global High Yield & Leveraged Finance Conference. February 24, 2015
|
|
|
- Barry Chambers
- 5 years ago
- Views:
Transcription


1 J.P. Morgan Global High Yield & Leveraged Finance Conference February 24, 2015
2 Forward Looking Statement The following information contains, or may be deemed to contain, "forwardlooking statements (as defined in the U.S. Private Securities Litigation Reform Act of 1995). By their nature, forward-looking statements involve risks and uncertainties because they relate to events and depend on circumstances that may or may not occur in the future. The future results of the company may vary from the results expressed in, or implied by, the following forward-looking statements, possibly to a material degree. For a discussion of some of the important factors that could cause the company s results to differ from those expressed in, or implied by, the following forward-looking statements, please refer to the company s Offering Circular. The company undertakes no obligation to update or revise any forward-looking statements. 2


3 NMG is the world s preeminent luxury retailer Revenue Sources (1) Merchandise Allocation Online $1.2B 24% Cosmetics & Fragrances 11% Men's Apparel & Shoes 12% Home Furnishings & Décor 5% Designer & Precious Jewelry 11% Other 2% Specialty Retail Stores $3.7B 76% Women's Shoes, Handbags & Accessories 28% Women's Apparel 31% 41 full line Neiman Marcus stores 2 Bergdorf Goodman stores 30 Last Call stores 12 Last Call Studios 6 Online Platforms LTM Q1 FY 2015: (1) Based on LTM Q1 FY 2015 revenue. Revenue: $4.9 billion Adj. EBITDA: $670 million 3

4 All About the Customer Affluent, educated and wired Gender: 88% female Age: 61% are 25-54, 37% are 55 and over Average Household Income: 40% over $200,000 72% over $100,000 40% have a net worth over $1M 73% research online before shopping in a store for any luxury merchandise Average NM brand customer owns 48 pairs of shoes and 18 handbags 4

5 Sales Associates Customer Focused - Service Driven ~ 4,400 sales associates across Neiman Marcus and Bergdorf Goodman Average tenure of 8 years Emphasis on building long-term relationships rather than transactionbased results Primarily commission based Leveraging technology with roll-out of ~8,000 smart phones and tablets, and Wi-Fi capabilities throughout the store base Instill and reinforce a culture of service Continuously measure and track customer service Formal and continuous training to enhance customer service and selling skills New hiring tools focused on customer service attributes 5
6 Attractive Opportunities to Drive Growth Strategy Examples Omni-channel NMG One Merchant & Planning team reorganization Data analytics Enhanced customer delivery methods 6


7 Omni-Channel Anytime, Anywhere, Any Device Customer Deliver an Unparalleled Omni-channel Customer Experience 7

8 Omni-Channel Anytime, Anywhere, Any Device 8
9 Omni-Channel Anytime, Anywhere, Any Device 9
10 Attractive Opportunities to Drive Growth Strategy Examples Omni-channel NMG One Merchant & Planning team reorganization Data analytics Enhanced customer delivery methods Technology New POS system Mobile apps Sales associate tools Memory Mirror 10


11 Technology - Mobile App - Connecting Customers and Associates Customer calls her store sales Associate Associate views the Customer s wishlist Associate creates a custom look and shares it Customer adds an item to her wishlist Customer contacts the associate via Facetime Associate notifies the customer Customer checks the custom look and adds it to her cart or wishlist 11


12 Technology - Mobile App SNAP.FIND.SHOP. 12

13 Technology - Mobile App SNAP.FIND.SHOP. 13


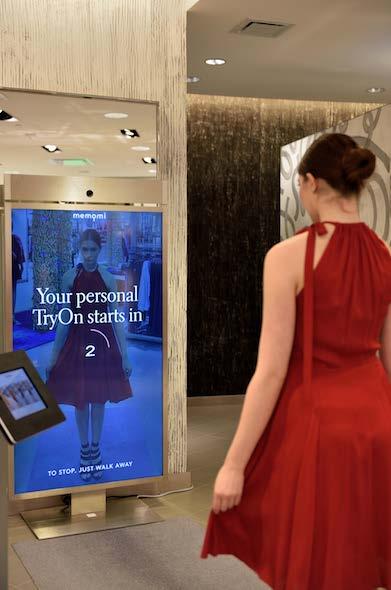
14 Memory Mirror 14
15 Attractive Opportunities to Drive Growth Strategy Omni-channel Examples NMG One Merchant & Planning team reorganization Data analytics Enhanced customer delivery methods Technology New POS system Mobile apps Sales associate tools Memory Mirror Online Site personalization Mobile Additional payment options International sales Targeted marketing 15


16 Online platform Neiman Marcus Bergdorf Goodman mytheresa CUSP Horchow Last Call 16


17 Online Opportunity U.S. Online Luxury Market Growth Luxury Market Online Contributions vs. Neiman Marcus Online Revenue Contribution ($ in billions) 24% $19 18% 14% $10 7% $4 2009A 2013A 2018E 2009A Online Luxury Market 2014A Neiman Marcus Online Industry leading 24% of sales come from Online Source: Euromonitor International Ltd. and Company filings. 17
18 Attractive Opportunities to Drive Growth Strategy Technology Online Examples New POS system Mobile apps Sales associate tools Memory Mirror Site personalization Mobile Additional payment options International sales Targeted marketing International Develop multi-language website platform Focused marketing programs to build awareness Additional payment options mytheresa.com 18


19 International - Neiman Marcus Group Acquires mytheresa.com and THERESA.com 19

20 International - Neiman Marcus Group Acquires mytheresa.com and THERESA Mytheresa.com is a leading online luxury fashion retailer in Europe with a focus on first season luxury fashion for women with only the world s most exclusive designers Global reach, with sales to over 120 countries and more than 65% of sales outside of Germany Approximately $130 million in annual sales, including Theresa store Unique product assortment based on trusted brand relationships Loyal and affluent customer base International and experienced management team with complementary industry backgrounds and proven execution capabilities Assortment of the world s most exclusive designers 20
21 Attractive Opportunities to Drive Growth Strategy Examples New Store Growth Roosevelt Field (Long Island) Hudson Yards (Manhattan) Last Call Studios 21


22 New Store Growth Roosevelt Field 22

23 New Store Growth Hudson Yards 23

24 New Store Growth Hudson Yards 24
 Los Angeles Oakbrook (Illinois) Palo")
25 Attractive Opportunities to Drive Growth Strategy New Store Growth Examples Roosevelt Field (Long Island) Hudson Yards (Manhattan) Last Call Studios Reinvest in the Stores - Remodels Bergdorf Goodman Michigan Avenue (Chicago) Los Angeles Oakbrook (Illinois) Palo Alto 25


26 Reinvest in the Stores Beverly Hills Remodel After Before 26


27 Reinvest in the Stores Palo Alto Remodel After Before 27


28 Reinvest in the Stores - Michigan Avenue Remodel Before After 28


29 Reinvest in the Stores - Michigan Avenue Remodel Before After 29

30 Financial Overview 30
31 Historical financial performance Revenues Adj. EBITDA ($ in millions) ($ in millions) $4,648 $4,839 $4,897 $672 $678 $670 $4,002 $4,345 $1,031 $1,149 $1,173 $533 $603 $879 $757 $3,245 $3,467 $3,617 $3,691 $3, % 13.9% 14.4% 14.0% 13.7% LTM Q1FY15 Specialty Retail Stores Online LTM Q1FY15 Adj. EBITDA % Margin % Comparable revenues (1) 8.1% 7.9% 4.9% 5.5% 5.4% % Growth (1) 8.4% 8.6% 5.5% 5.5% 5.4% Note: Fiscal year is the 52 or 53-week period ending on the Saturday nearest July 31. FY 2013 is a 53-week year. (1) Based on 52-week convention. 31
32 Financial performance update ($ in millions, except where otherwise specified) Q1 FY14 Q1 FY15 11/2/ /1/2014 Revenues: Specialty Retail Stores $889 $922 Online Total revenues $1,129 $1,186 % comparable revenue growth 5.7% 5.5% Gross profit $444 $458 % margin 39.3% 38.6% Selling, general & administrative $267 $288 % margin 23.6% 24.3% Adj. EBITDA $193 $186 % margin 17.1% 15.7% Capex, net $36 $55 % of sales 3.2% 4.6% 32
33 Continued Comparable Revenue & Productivity Momentum Neiman Marcus Group Rolling LTM sales / sq. ft. (1) FY 2012: 7.9% FY 2013: 4.9% FY 2014: 5.5% 9.0% 8.0% 7.9% 6.7% 5.4% 5.3% 5.4% 5.7% 5.5% 5.9% 4.9% 5.5% 3.6% 1Q12 2Q12 3Q12 4Q12 1Q13 2Q13 3Q13 4Q13 1Q14 2Q14 3Q14 4Q14 1Q15 $525 $530 $535 $539 $542 $545 $552 $560 $567 $575 $579 $586 Online Segment $513 FY 2012: 16.1% FY 2013: 15.7% FY 2014: 12.9% 15.2% 13.5% 17.5% 18.8% 13.5% 17.9% 15.1% 15.6% 10.4% 15.1% 13.7% 14.3% 11.7% 1Q12 2Q12 3Q12 4Q12 1Q13 2Q13 3Q13 4Q13 1Q14 2Q14 3Q14 4Q14 1Q15 1Q12 2Q12 3Q12 4Q12 1Q13 2Q13 3Q13 4Q13 1Q14 2Q14 3Q14 4Q14 1Q15 (1) Calculated on a 52-week basis. Excludes Last Call and CUSP. Includes Bergdorf Goodman and Neiman Marcus only. 33

34 Liquidity Management LIQUIDITY ($ Millions) Revolver Availability Cash $616 $720 $530 $615 $580 $322 $137 $197 $49 $82 FY11 FY12 FY13 FY14 Q1 FY15 34
35 Liquidity Management INVENTORY MANAGEMENT (% Change) NET CAPITAL EXPENDITURES ($ Millions) Q1 FY14 Q1 FY15 $ % 3.6% (1) 5.1% 7.0% (2) $142 $139 $168 Sales Inventory Sales Inventory $84 Maintained tight control of inventory FY11 FY12 FY13 FY14 FY15E (1) Q1 FY14 inventory growth excludes purchase accounting adjustments. (2) Q1 FY15 inventory growth excludes inventory acquired from Mytheresa and purchase accounting adjustments. 35
36 Debt Maturities ($ in millions) Term Loan Cash Pay Notes PIK Toggle Notes 2028 Debentures $3,000 $2,500 $2,000 $1,500 $1,000 $500 $ FY11 FY12 FY13 FY14 LTM Q1 FY15 Leverage Ratio (1) 5.0x 4.6x 4.0x 6.8x 6.8x Net Leverage Ratio (2) 4.5x 4.6x 3.9x 6.5x 6.8x (1) Long-term debt (excl. current maturities) divided by Adjusted EBITDA. (2) Assumes all available cash (less $50M) is used to pay down debt. 36
37 EBITDA Reconciliation ($ in millions) Fiscal Year Ended LTM 7/30/11 7/28/12 8/3/13 8/2/14 11/1/14 EBITDA $525 $584 $635 $349 $437 Plus: Transaction costs Plus: Amortization of inventory step-up Plus: Non-cash stock-based compensation expense Plus: Management fee paid to current sponsors Plus: Equity in loss of foreign e-commerce retailer Plus: Costs related to criminal cyber-attack Plus: Advisory and other fees (5) Plus: Other nonrecurring expenses 7 9 Adjusted EBITDA $533 $603 $672 $678 $670 % margin 13.3% 13.9% 14.4% 14.0% 13.7% Note: Fiscal year is the 52 or 53-week period ending on the Saturday nearest July 31. FY 2013 is a 53-week year. 37

38