Mobile market dynamics. Telkom SA Limited Analyst day
|
|
|
- Hugh Davidson
- 5 years ago
- Views:
Transcription
1 Mobile market dynamics Telkom SA Limited Analyst day
2 Disclaimer This presentation has been prepared and published by Vodacom Group (Proprietary) Limited. Vodacom Group (Proprietary) Limited is a private company and as such is not required by the Companies Act of 61 of 1973, as amended, to publish its results. Vodacom Group (Proprietary) Limited makes no guarantee, assurance, representation and/or warranty as to the accuracy of the information contained in this presentation and will not be held liable for any reliance placed on the information contained in this presentation. The information contained in this presentation is subject to change without notice and may be incomplete or condensed. In addition, this presentation may not contain all material information pertaining to Vodacom Group (Proprietary) Limited and its subsidiaries. Without in anyway derogating from the generality of the foregoing, it should be noted that: Many of the statements included in this presentation are forward-looking statements that involve risks and/or uncertainties and caution must be exercised in placing any reliance on these statements. Moreover, Vodacom Group (Proprietary) Limited will not necessarily update any of these statements after the date of this presentation either to conform them to actual results or to changes in our expectations. Insofar as the shareholder s of Vodacom Group (Proprietary) Ltd are listed and offer their shares publicly for sale on recognised Stock Exchanges locally and/or internationally, potential investors in the shares of Vodacom Group (Proprietary) Limited s shareholders are cautioned not to place undue reliance on this presentation. 2
3 Agenda Introduction Pieter Uys Market overview Margins and profitability Network capex Fixed mobile opportunities Shameel Joosub SA Retail environment Debbie Millar Growth strategy Dividend strategy 3
4 South African dynamics Pieter Uys MD: Vodacom (Pty) Ltd
5 Market overview
6 South African market growth Market growth still strong 30% pa 29% pa % for 6 months % for 9 months 16.9 Customers ('mil) Mar 2001 Mar 2002 Mar 2003 Sep 2003 Dec-03 Vodacom estimates based on reported subscribers Other operators Vodacom Total 6
7 South African market share analysis Revenue share a better indicator? 64% 63% 62.8% 62.5% 62% 61.4% % relative to MTN 61% 60% 59% 58% 57% 59.3% 60.7% 57.7% 60.1% 57.4% 59.9% 56% 55% 54% Mar'02 Mar'03 Sep'03 Vodacom reported subs (%) Vodacom active subs (%) Vodacom revenue (%) 7
8 South African market share Substantial market activity Gross connections have reached their highest level ever SA market share based on reported subscribers 53% Prepaid market affected by Changes to Vodacom activity rules increased prepaid churn and reduced net additions Contract market strong Continued growth Low churn Subscriber definition Do not know all operators disconnection policy 47% Vodacom Other operators Will have an impact on key indicators *Based on reported subscribers at 31 December
9 Gross connection history 650,000 VODACOM GROSS CONNECTION HISTORY 600, , ,000 Gross Subscriber Numbers 450, , , , , , , ,000 50,000 0 Apr May Jun Jul Aug Sep Oct Nov Dec Jan Feb Mar 1996/ / / / / / / /2004 9
10 High Pre-paid Churn 3month inactivity implemented increased churn 7 month inactivity (From mid Dec) 700, , , , , , , , , ,817 Customers 300, , ,000 66, ,080 0 (100,000) (200,000) (300,000) (187,450) Honouring time windows so there will still be some churn Oct'03 Nov'03 Dec'03 Gross Churn Net 10
11 Vodacom South Africa at a glance Customers 8.9 million Gross connections of 3.6 million Contract churn low at 10.4% Prepaid churn high at 48.7% ARPU stable at R184 per month Data importance increasing Active GPRS users 68,000 Active MMS users 46,000 Launch of Top-Up Hybrid 13%ytd South African Customers ('000) and ARPU (ZAR) 38.4%ytd 8,910 8, , ,130 Sep 2002 Mar 2003 Sep 2003 Dec-03 Customers ARPU All disclosures of Vodacomnumbers as at 31 December
12 Margins and profitability
13 Group profitability Still driven by South Africa >95% of EBITDA at Sep 03 Margin pressure due to Competition High level of connections Traffic mix Margins affected by Handset sales (10-12%) Traffic mix Revenue not net of discounts Distribution costs of SA market structure Margin expansion challenging in the medium term R millions 4,000 3,500 3,000 2,500 2,000 1,500 1, Group consolidated Six-monthly profitability 2,542 1,575 3,027 1,838 1, % 16.7% 8.9% 3,698 2,451 1,374 Sep 2001 Sep 2002 Sep % 33.3% 49.7% EBITDA Profit from operations Net profit 13
14 Group margins Six-monthly margins 40% 35% 33.8% 36.5% 32.1% 35.6% 32.7% 30% 25% 20% 15% 10% 20.9% 13.4% 23.7% 16.2% 19.5% 9.7% 24.1% 13.6% 21.7% 12.2% 5% 0% H H H H H EBITDA margin Operating profit margin Net profit margin 14
15 Service provider strategy There is a focus to, where appropriate, buy back margins currently in distribution channel Must maintain distribution strength Exclusive SP s distribution channels are initial focus In various stages of acquisition Independent SP s are a much more medium term issue Two substantial companies Business as usual Vodacom sensitive to the significant value they add Structural complications 15
16 Network capex
17 SA capex spend to stabilise Capital expenditure as a % of revenue 25.0% 21.9% 21.4% 20.0% 15.0% 13.4% 10.0% 7.8% 5.0% 0.0% Sep 03 17
18 Understanding SA capex investment Current capacity can accommodate anticipated growth Capex per subscriber affected by South African Capex and productivity efficiency measures Cell C roaming Substantial community service requirements Use of three suppliers 1,980 1,854 2,017 1,933 2,217 1,876 Core Siemens; Radio Motorola and Alcatel (regionalised) Spread of suppliers does not affect upgrades or integration of new products Sep 2002 Mar 2003 Sep 2003 Customers per employee Cumulative network capex per customer (ZAR) 18
19 Capex investment for the future Rollout to continue to support demand Ongoing high level targets for capacity and quality Increased focus on services Such as location based services etc Further development of higher data rate technologies including faster GPRS and use of EDGE 19
20 Fixed mobile opportunities


21 Fixed Mobile Opportunities Procurement Obtain better prices from common suppliers Optimise procedures Technology Develop new services based on the convergence between fixed and mobile network Sharing of network infrastructure Sales and Marketing Promote synergistic Marketing and Sales initiatives (e.g. New products, Fixed/Mobile integrated solutions to common key corporate accounts, developing joint Marketing campaign) 21
22 SA Retail Environment Shameel Joosub MD: Vodacom Service Provider Company (Pty) Ltd
23 Service Provider Model N E T W O R K VSP Exclusive SPs - 3 Independent SPs - 2 Corporates Franchised Stores Dealers Retailers Direct Wholesalers C U S T O M E R 23
24 Service Provider Model - Contract NETWORK SERVICE PROVIDERS CHANNELS CONTRACT SALES Connection incentive per tariff Deals are structured per tariff Receives connection bonus BILLING SPs are paid a % of customer billing = ongoing revenue Connecting channel receives ongoing revenue UPGRADES Upgrade incentive paid to SPs Upgrade deals are matched with acquisition deals Receives Admin Fee 24
25 Service Provider Model - Prepaid NETWORK SERVICE PROVIDERS CHANNELS STARTER PACK SALES Connection incentive Deals are structured Receives connection bonus RECHARGES Margin on vouchers & ongoing revenue paid to SPs Margin on vouchers & ongoing revenue paid to Connecting channel 25
26 Vodacom Service Provider Company 64% of the Total Vodacom subscriber base Contract VSP 70% of the Vodacom base 64% Gross connections YTD 54% higher than in 2002 Net connections 167% higher than 2002 Churn at 9.7% 36% VSP Independent SPs 26
27 Vodacom Service Provider Company Prepaid Gross Connections YTD 48.8% higher than in 2002 Top Up Launched in October 2003 Positioned between Prepaid & Contract 48% of Top Up connections are Prepaid to Top Up conversions 27
28 28

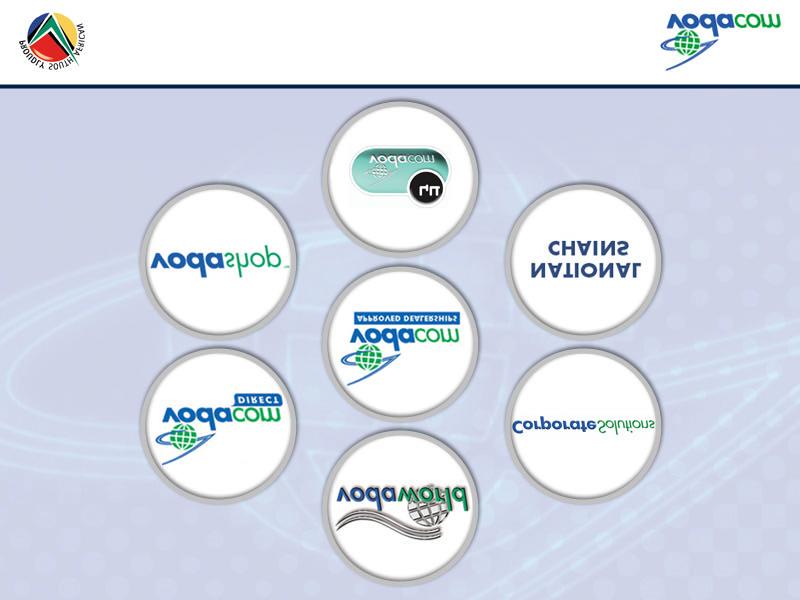
29 VSP Sales Channels Vodacom Direct An online ordering channel enabling customers to purchase goods telephonically or online 10% of Contract base Vodaworld The world s biggest one-stop cellular mall, open 7 days a week Vodacom Corporate Solutions Acquires and maintains highvalue contract subscribers 20 % of Contract base Vodashops 134 Franchise cellular stores located in major shopping centers nationwide 24 % of contract base National Chains Comprises large national chain stores & wholesale resellers encompassing Over distribution points 88 % of Prepaid connections Vodacom Approved Dealerships Comprises Electronic, General Dealers & Specialised Cellular Stores 30 % of Contract base Vodacom 4U stores 45 Franchised will be rolled out over the next 3 years targeted at the youth, focusing on cellular sales & customer service 6 stores rolled out 29
30 Group strategies Debbie Millar
31 Growth strategy Vodacom will continue to look for investment opportunities Limited to Africa, not all emerging markets Other African customers ('000) 1,070 1,274 Shareholders aligned Nigeria is the current focus Process is in place to ensure risk mitigation Single biggest opportunity in Africa Commercial risk profile more palatable now Sep 2002 Mar 2003 Sep 2003 Dec-03 31
32 Dividend strategy No formal policy Current year Interim dividend R0.6 billion 1,800 1,600 Shareholder distributions Final dividend approved of R1.5 billion, payable May 04 R2.1 billion cash paid in current year including repayment of shareholder loans of R0.92 billion Nigeria entry not expected to impact current level of dividend of around R1.5 billion p.a. Accordingly, current level to be maintained or increased R million 1,400 1,200 1, Sep 03 Dividends Interest Shareholder loans 32
33 Questions?