Debenhams Plc Preliminary Results 2006/07
|
|
|
- Bernice Black
- 5 years ago
- Views:
Transcription

1 Debenhams Plc Preliminary Results 2006/07
2 Chris Woodhouse Finance Director 1
3 Results Highlights Gross transaction value Like-for-like sales Gross margin % Profit before exceptional items (a) Net debt Underlying earnings per share Proposed final dividend +5.1% -5.0% - 90 bps 131.4m (1,017)m 11.9p 3.8p Note (a) After adding back 3.9m of capitalised bank fees. 2
4 Trading Results 2007 m % Change Gross transaction value 2, , Operating profit Interest (66.6) (125.4) Profit before tax and exceptionals Exceptional items (14.3) (50.7) Taxation (34.2) (18.4) Profit after tax Basic earnings per share 9.3p 7.4p 3
5 Sales Growth History 2,400 2,300 2,200 CAGR 6.6% Total Sales ( m) 2,100 2,000 1,900 1,800 1,700 1,600 1,903 2,087 2,193 2,306 1, LFL 1.6% 2.8% 0.5% (5.0%) 4
6 Sales Growth % % 2.4% 0.7% 0.2% +5.1% m movement (5.0%) (5.0%) 7.1% 7.0% (4.5%) LFL Roches Stores New Dept Stores New Desire Stores International 5
7 Quarterly LFL Performance 0.0 (1.0)% (2.0)% (2.0)% (3.0)% (3.0)% (4.0)% (5.0)% (6.0)% (6.0)% (7.0)% (8.0)% (9.0)% (9.0)% (10.0)% Q1 Q2 Q3 Q4 6
8 Gross Margin Movement 2007 Gross margin fall Improved intake margin Clearance Lower pricing Product mix Total Own bought mix bps Improved intake margin offset by Increased clearance to maintain clean opening stock position for 2007/08 New lower pricing across clothing Mix away from menswear to lower margin health and beauty & concession lines 70.8% 70.4% 69.5% ex Roches
9 Roches Integration Margin rate differentials - Roches v Total company P1 P2 Q1 P4 P5 Q2 P7 P8 Q3 P10 P11 Q4 P1 P2 Q1 P4 P5 Q2 P7 P8 Q3 P10 P11 Q4 0% -10% -20% -30% Q1 Q2 Q3 Q4 Q1 Q2 Q3 Q4 2006/ /08 06/07 Closing 07 07/08 Own bought mix 48% 58% 63% 8
10 Roches Operating Performance m Gross transaction value Gross margin Gross margin rate Costs EBITDA Depreciation Operating loss FY % (55.5) 2.7 (3.1) (0.4) 9
11 Direct Highlights Gross transaction value Sales growth Gross margin EBITDA 26.1m +31.7% bps % 70% 60% Quarterly LFL Growth 62.8% 50% 40% 30% 20% New Website launched Nov/ Dec % 41.0% 10% 0% 3.1% Q1 Q2 Q3 Q4 10
12 Store Costs m FY 07 FY 07 FY 06 (Ex Roches) Payroll % to sales 10.2% 10.0% 9.5% Store rent UK GAAP IFRS adjustment Total store rent % to sales 6.0% 5.7% 5.3% Energy % to sales 1.1% 1.1% 0.8% 11
13 Warehouse and Distribution m Change Labour Property Transport (0.1) Total distribution % to Sales 2.0% 2.4% 0.4% 12
14 Portfolio KPIs Space 2007 Sq Ft. (k) Dept Stores Desires Total 2006 Close 9, Dept stores openings Roches acquisition Llandudno 46 1 Wigan * 22 - Warrington 80 1 Desire store openings Birmingham Fort 13 1 Kirkaldy 13 1 Merthyr 14 1 Altrincham 15 1 Walton-on-Thames Close 10, * Resite (incremental space) 13
15 Portfolio KPIs Space Close Sq Ft. (k) Dept Stores Desires Total 10, Dept store openings Derby * 17 - Bangor * 30 - Exeter * 31 - Glasgow Silverburn 80 1 Ashford 60 1 Blackpool 65 1 Liverpool Welwyn 20 1 Llanelli 22 1 Desire store openings Ballymena 14 1 Closures Jervis Street (90) (1) 2008 Close 10, * Resite (incremental space) 14
16 Capital Additions Guidance Roches 23% Maintenance 14% Other 3% New stores 37% Systems 8% New stores 47% Other 7% Maintenance 12% Systems 8% Mods 13% Mods 28% 136.6m 150m 15
17 Refit Programme Spend m Guidance per sq ft
18 Balance Sheet Highlights m Movement Fixed assets 1,690 1, Stock Other working capital (403) (337) (66) Net debt (1,017) (1,096) 79 Liabilities and charges (352) (279) (73) Shareholders funds Fixed charge cover 2.3 x 2.5 x 0.2 x Net debt / EBITDA 3.5 x 3.1 x 0.4 x Pension surplus 87.3m 13.8m 73.5m 17
19 Balance Sheet Stock Headline growth % 18% New stores Earlier intake of Autumn Winter Lower prices International and Direct Other 10% 2% 2% 1% 3% 18% 18
20 Operating Cash Flow m Reported operating profit Depreciation Capital (a) Amortisation EBITDA Working capital including pensions spend Net capital expenditure change in work in progress Operating cash flow before exceptionals, Financing & taxation (39.9) 1.8 (96.5) (88.5) (136.4) (86.7) Net debt (b) 1,017 1,096 Note: (a) Includes loss on disposal of fixed assets (b) Net Debt includes 12m (2006: 16m) of capitalised debt flow 19
21 Taxation and Dividend m Guidance Profit and loss rate 30.2% 29.6% 29.1% Cash rate 27.3% 28.0% (a) 31.0% Dividend per share 6.3p 2.4p (a) Adjusted for pension contributions and share options 20
22 Rob Templeman Chief Executive 21

23 Review 2006/07 Key Issues Weaker clothing sales Menswear Range Price architecture Womenswear Reliance on outerwear Stock availability Competitive Arena Pricing Marketing Core Stores 22
24 Product Participation Own Bought Sales by Product Category 2005/06 Own Bought Sales by Product Category 2006/07 Foodservices Lingerie 3.8% 7.0% Womenswear 19.5% Foodservices 4.0% Lingerie 7.1% Womenswear 19.1% Accessories 10.9% Accessories 11.6% Health & Beauty 19.0% Home & Gift 15.6% Childrens 7.4% Menswear 16.8% Clothing 43.7% Health & Beauty 20.2% Home & Gift 14.8% Childrens 7.4% Menswear 15.8% Clothing 42.3% Own Bought Sales Mix 2005/ /07 (ex Roches) Own Bought Concession 2006/

25 Drive 2007/08 Actions Taken Improved product offer Design Quality Visual merchandising Price architecture Raising quality and design standards Price realignment Marketing New campaign launched Review of media strategy Core stores Refurbishment programme accelerated 24

26 Improved Product Offer Greater focus on products at the front end Improving and raising the style bar with Designers at Debenhams Enhancing design and quality perceptions Improving the visual merchandising Designers displayed in a more premium way Fast fashion displayed as trend statements Core lines displayed by category with authority Consolidation of some brands Creating destination areas Removing duplication Widening the target audience 25


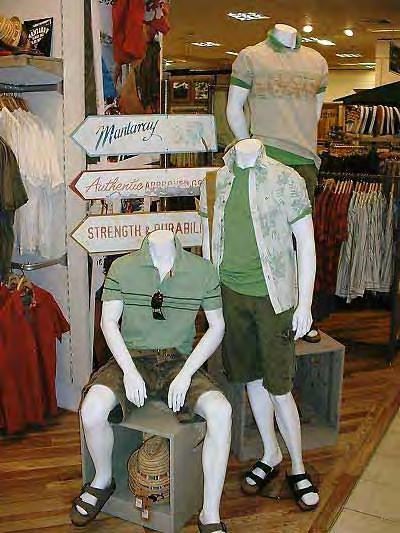
27 Focus On Product Design And Quality 26


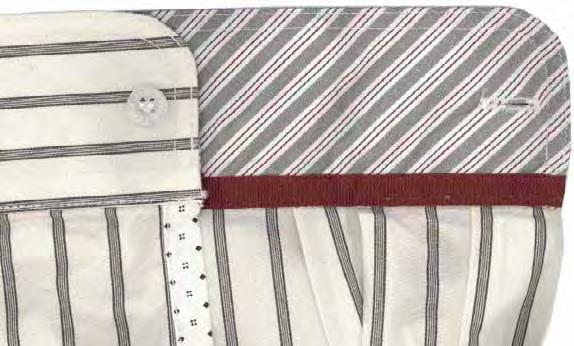


28 Enhanced Design Details 27
29 Price Architecture Key Issues Menswear Price Survey - March Exit Average Basket Value - Index to Survey Average (Base = 100) Source: Retail Map Entry Main Competitor 1 Survey Average Price Architecture By Competitor 28 Main Competitor 2 Debenhams Own Label Debenhams Designers
30 Price Architecture Price Realignment Menswear Womenswear Childrenswear Upper 42% Upper 28% Upper 87% Autumn Winter 2005/06 Upper Middle Middle 16% 20% Upper Middle Middle 25% 25% Upper Middle Middle 5% 6% Lower Middle 15% Lower Middle 18% Lower Middle 2% Lower 8% Lower 4% Lower 0% Upper 16% Upper 27% Upper 72% Autumn Winter 2006/07 Upper Middle Middle 17% 30% Upper Middle Middle 21% 31% Upper Middle Middle 3% 22% Lower Middle 19% Lower Middle 14% Lower Middle 3% Lower 18% Lower 6% Lower 1% 29
31 Impact On Margin Dynamics Intake Margin Product Mix Markdown Concession Mix 2006/07 Impact 2007/08 Assumptions Improve price points Investment in quality and design Currency gains Direct sourcing Stronger clothing sales Improvement in menswear Lower prices Faster rate of sale Less promotions RF price change management Higher participation from own bought Roches stores Shorter supply chain 30

32 Investment In Retail Technology 6 million investment in RF technology Leading edge suite Infrastructure now in all stores Improving the customer experience Price change management Greater clarity of pricing Less promotional signage Faster sell through on markdown products More hours to invest in customer service Other developments Mobile office Work planner Stock availability management 31
33 Marketing New premium campaign launched New Club creative Conveys range, choice, quality & value Review of media strategy Increased mix of premium advertising Targeted coverage in press and online Increased frequency of advertising Improved the Store Card Rewarding loyal customers for higher spend Enhanced benefits Better communication to customers 32

34 33

35 34

36 35

37 36

38 37

39 38

40 39

41 40

42 41

43 42

44 43

45 44

46 45

47 46
48 Department Stores Accelerating Refurbishments Elements of the Desire shop fit Store Portfolio Improved fixtures, branding and graphics 06/07 07/08 08/09 Focus on visual merchandising New stores* Distinguishing designers, fast fashion and core products Ex-Allders Capital expenditure focused on Sales Uplift and ROIC Ex-Roches Refurbished stores Customer perception Core stores Average cost of 15 per square foot driving strong financial returns Uxbridge cost 9 per square foot Desire Total % Sales Uplift * Opened in past 4 years, excludes future pipeline 47

49 Uxbridge Refurbishment 48


50 Uxbridge Refurbishment 49


51 Uxbridge Refurbishment 50


52 Uxbridge Refurbishment 51


53 Uxbridge Refurbishment 52
54 Strategic Growth Drivers New Department Stores Contracted New Store Pipeline 135 Department Stores Today 2007/08 Exeter * Derby * Llanelli Welwyn Glasgow Silverburn Bangor (Wales) * Ashford Blackpool Liverpool /09 White City Wrexham Dunfermline Livingston Bury St Edmunds Great Yarmouth /10 Newbury * Newport Carmarthen Bradford Wakefield Newcastle Darlington Lichfield Bury (Gtr Manchester) Wood Green /11 Lancaster Wolverhampton Crewe Barnsley Macclesfield Swindon * Bath 7 * Re-sites 53

55 Strategic Growth Drivers Desire A unique concept with capacity for c.100 stores Sales densities and gross margin higher than department stores High own bought mix EBITDA margin in line with department stores Successful childrenswear introduction Trial menswear Desire Roll Out Annual Openings /05 05/06 06/07 07/08 08/09 09/10 Trading Year Open Signed Planned/Negotiating 54
56 Strategic Growth Drivers International International Store Growth Now 36 stores in 16 countries trading over 1.5 million square foot Significant growth opportunity with a strong opening programme New markets entered in Russia, Romania, Jordan and India Total Number of Stores Significant opportunity to roll out different format stores internationally / / / /7 2007/8 2008/9 2009/ / /12 55

57 Strategic Growth Drivers Internet The online sector is expected to account for nearly 10% of retail spend in 2011 Clothing predicted to be one of the fastest growing categories New platform fully launched 30m sales 2006/07 Second half sales up 51% and visits up 44% vs last year Marketing potential Micro sites Advertising and product research New product launches Premium cosmetic houses Electricals Wine & champagne 56
58 Summary Product Focus on Product Design and Quality Price Realignment Marketing New premium campaign Increased frequency of advertising Department Stores Accelerated refurbishment programme Roches fully ranged with Debenhams merchandise New Stores Strong pipeline of new space across all formats Internet Improved performance following launch of new site 57
59 Current Trading 7 Weeks to 20 th October 2007 Total sales growth of +3.9% Like-for-like sales (1) +2.1% Gross margin up year on year Market share improving Note (1) Excluding the 9 Roches stores for both years 58