INVESTOR PRESENTATION. February 2019
|
|
|
- Jayson Perkins
- 5 years ago
- Views:
Transcription
1 INVESTOR PRESENTATION February 2019
2 Forward Looking Statements Disclaimer This press release contains forward-looking statements as that term is defined in the Private Securities Litigation Reform Act of In some cases, forward-looking statements may be identified by words such as believe, expect, seek, may, will, intend, should, project, anticipate, plan, and similar expressions. Forward-looking statements are based on the current beliefs, expectations and assumptions of the Company s management regarding the future of the Company s business, future plans and strategies, projections, anticipated events and trends, the economy and other future conditions. Examples of forwardlooking statements include guidance regarding the Company s revenue and earnings and the growth of our cloud, analytics and artificial intelligence business. Forward looking statements are inherently subject to significant economic, competitive and other uncertainties and contingencies, many of which are beyond the control of management. The Company cautions that these statements are not guarantees of future performance, and investors should not place undue reliance on them. There are or will be important known and unknown factors and uncertainties that could cause actual results to differ materially from those expressed or implied in the forward-looking statements. These factors, include, but are not limited to, risks associated with competition, success and growth of the Company s cloud Software-as-a-Service business, cyber security attacks or other security breaches against the Company, privacy concerns and legislation impacting the Company s business, the Company s dependency on third-party cloud computing platform providers, hosting facilities and service partners, changes in general economic and business conditions, rapidly changing technology, changes in currency exchange rates and interest rates, difficulties in making additional acquisitions or effectively integrating acquired operations, products, technologies and personnel, successful execution of the Company s growth strategy, the effects of tax reforms and of newly enacted or modified laws, regulation or standards on the Company and its products, and other factors and uncertainties discussed in our filings with the U.S. Securities and Exchange Commission (the SEC ). You are encouraged to carefully review the section entitled Risk Factors in our latest Annual Report on Form 20-F and our other filings with the SEC for additional information regarding these and other factors and uncertainties that could affect our future performance. The forward-looking statements contained in this presentation speak only as of the date hereof, and the Company undertakes no obligation to update or revise them, whether as a result of new information, future developments or otherwise, except as required by law. 2
3 NASDAQ: NICE >25,000 Customers >85% Fortune 100 Customers >150 Countries ~6,200 Professionals ~1,800 R&D Professionals >35 Local Offices 3


4 CUSTOMER ENGAGEMENT FINANCIAL CRIME & COMPLIANCE Making people s EXPERIENCES timely & seamless Enabling B2C enterprises to deliver an effortless, consistent and personalized customer experience PROTECTING people s money & assets Protecting and securing organizations and their clients in a digital world


5 Shift in strategic focus Shift in strategic focus WHERE TO PLAY? Where to play? HOW TO WIN?


6 Strategic Pillars CLOUD Omni Channel Analytics Artificial Intelligence
7 The Path to NICE2B CLOUD Analytics Omni Channel Artificial Intelligence Robotic Automation Essentials Nexidia Actimize Watch Platform NEVA Mattersight Platform NICE2B incontact Customer Journey

8 WINNING Strategy Cloud adoption acceleration Platforms are eating software AI shift from fantasy to must have Data is fueling innovation 8
9 WINNING Building Blocks Customer Engagement Platform X-Sight Financial Crime and Compliance Platform Cognitive RPA Platform Cloud Analytics AI 9
10 The NICE Advantage Customer Engagement Complete offering CXone platform Ecosystem Full market coverage Financial Crime Complete offering Innovative X-Sight platform Brand and domain expertise Robotics & Automation Unique offering Broadest installed base Enterprise ready 10

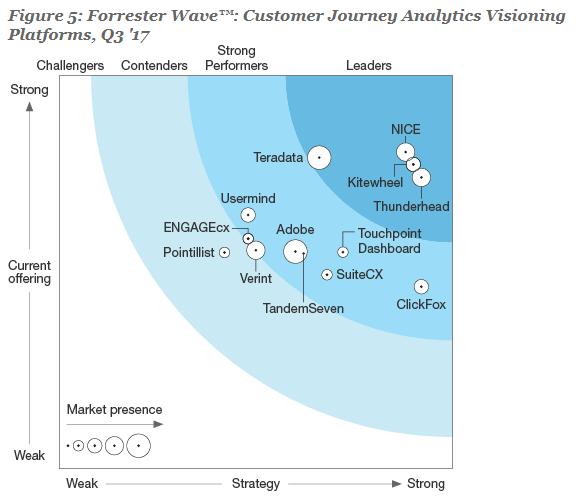
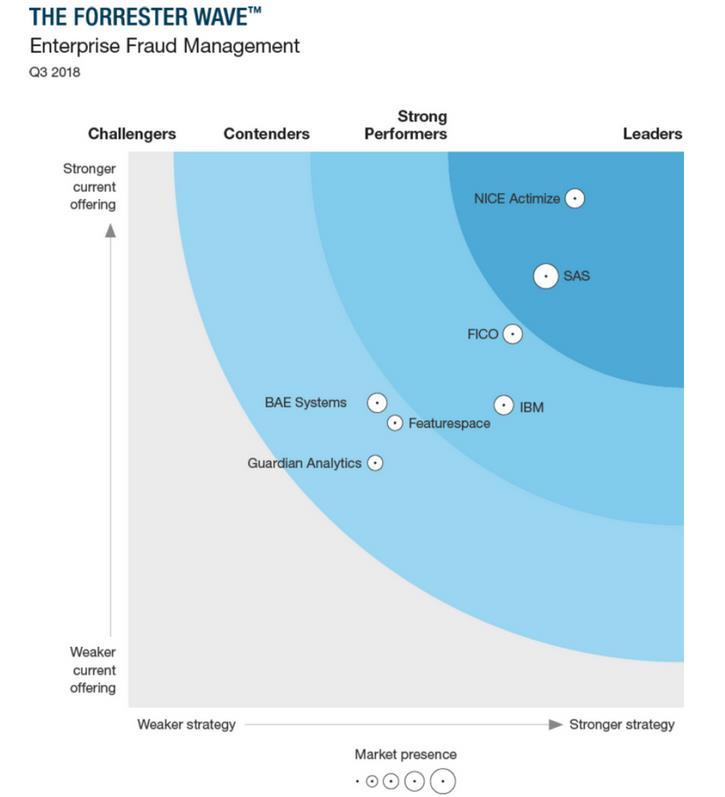
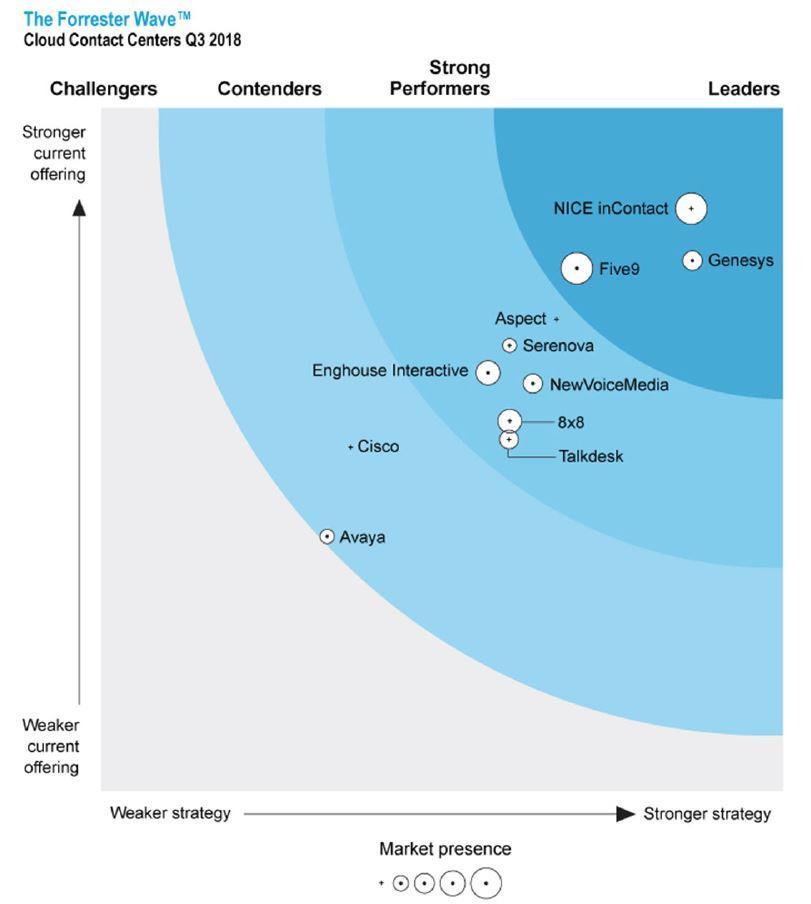
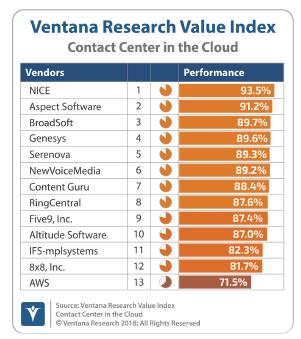
11 Market Analyst Reports
12 Q Highlights* Revenue record of $420 million, 6% growth year-over-year Cloud revenue increased 29% to $134 million year-over-year Cloud revenue represented 32% of total revenue vs. 26% last year Recurring revenue accounted for 65% of total revenue compared to 60% last year Operating income increased to $119 million compared to $112 million last year EPS record of $1.47, 9% increase year-over-year Cash flow from operations increased 26% year-over-year to $109 million * All numbers, except cash flow, are Non-GAAP * All financial numbers for 2018 and the comparable period are under ASC 605
13 Full Year 2018 Highlights* Revenue record of $1,463 million, 9% growth year-over-year Cloud revenue increased 27% to $470 million year-over-year Cloud revenue represented 32% of total revenue vs. 27% last year Recurring revenue accounted for 70% of total revenue compared to 65% last year Operating income increased to $379 million compared to $336 million last year EPS record of $4.69, 14% increase year-over-year Cash flow from operations record of $397 million * All numbers, except cash flow, are Non-GAAP * All financial numbers for 2018 and the comparable period are under ASC 605
14 Record Results Q4 2018* REVENUE ($M, Non-GAAP) $396 $420 GROSS PROFIT ($M, Non-GAAP) $293 $304 6% 4% OPERATING INCOME ($M, Non-GAAP) EARNINGS PER SHARE (Non-GAAP) $112 $119 $1.35 $1.47 6% 9% * All financial numbers for 2017 and 2018 periods are under ASC 605
15 Record Results Full Year 2018* REVENUE ($M, Non-GAAP) $1,346 $1,463 GROSS PROFIT ($M, Non-GAAP) $964 $1,041 9% 8% OPERATING INCOME ($M, Non-GAAP) $336 $379 EARNINGS PER SHARE (Non-GAAP) $4.10 $ % 14% * All financial numbers for 2017 and 2018 periods are under ASC 605
16 Business Model* (% Total Revenue) Q Q Non-recurring revenue 40% Non-recurring revenue 35% Recurring revenue 60% Recurring revenue 65% * All numbers are non-gaap * All financial numbers for 2017 and 2018 periods are under ASC
17 Business Model* (% Total Revenue) Full Year 2017 Full Year 2018 Non-recurring revenue 35% Non-recurring revenue 30% Recurring revenue 65% Recurring revenue 70% * All numbers are non-gaap * All financial numbers for 2017 and 2018 periods are under ASC
18 Business Model* (% Total Revenue) Continued increase in cloud revenue in Q Q Q Cloud 26% Products 29% Cloud 32% Products 26% Services 45% Services 42% * All numbers are non-gaap * All financial numbers for 2017 and 2018 periods are under ASC
19 Business Model* (% Total Revenue) Continued increase in cloud revenue in 2018 Full Year 2017 Full Year 2018 Cloud 27% Products 24% Cloud 32% Products 20% Services 49% Services 48% * All numbers are non-gaap * All financial numbers for 2017 and 2018 periods are under ASC


20 Business Unit Breakdown* (% of Revenue) Q Full year 2018 Financial Crime and Compliance 23% Financial Crime and Compliance 20% 77% 80% Customer Engagement Customer Engagement * All numbers are non-gaap * All financial numbers for 2017 and 2018 periods are under ASC 605

21 Global Presence* (% of Revenue) Q Full year 2018 APAC APAC EMEA 8% 13% EMEA 8% 14% 79% Americas 78% Americas * All numbers are non-gaap * All financial numbers for 2017 and 2018 periods are under ASC 605
22 22