National Capital Region Transportation Planning Board
|
|
|
- Gwenda Hunt
- 6 years ago
- Views:
Transcription
1 National Capital Region Transportation Planning Board Evaluating Alternative Scenarios for a Network of Variably Priced Highway Lanes in the Metropolitan Washington Region Final Report February, 2008 FUNDED UNDER A GRANT FROM THE FEDERAL HIGHWAY ADMINISTRATION'S VALUE PRICING PILOT PROGRAM
2 Acknowledgements Director, Department of Transportation Planning Ronald F. Kirby Report Authors Michael D. Eichler Gerald K. Miller Jinchul Park This study was funded under a grant from the Federal Highway Administration s Value Pricing Program through the Virginia Department of Transportation, and was overseen by the National Capital Regional Transportation Planning Board s Task Force on Value Pricing for Transportation. i
3 Preface...iv 1 Executive Summary Study Background Scenario Development Scenario Analysis Impacts of the Scenarios on Land Use and Population Groups Topics for Further Consideration Introduction & Background About the Transportation Planning Board Value Pricing Policy and Planning Activities Value Pricing Projects Current and Projected System Performance Study Methodology Scenario Development Roadmap for the Scenarios First Round Scenarios Prioritized Scenarios Scenarios with Enhanced Transit Scenario Development Summary Scenario Analysis Potential Demand and Revenue Scenario Cost Estimates Scenario Financial Feasibility Impact of Transit on Performance of the Scenarios Transit Cost Analysis Evaluation of Potential Land Use Impacts Connectivity to the Regional Core and Activity Centers Impacts of Pricing Scenarios on Different Populations Methodology Analysis Summary Assessing the Impact of Tolling Existing Lanes Topics for Further Consideration What Scenarios Could be Assessed in Future Studies? What Considerations Affect the Inclusion of VPLs in a Regional Network? Coordination with Current Corridor Studies in the Region Public Education and Outreach Should be Conducted References Supplementary Maps and Figures Scenario Development Scenario Analysis Land Use Impact Assessment Regional Core and Activity Centers Analysis Equity Analysis Appendix ii
4 iii
5 Preface In this study of the potential for pricing highway use in the Washington region, several different scenarios for adding new priced highway lanes, pricing existing highways, and enhancing bus services are analyzed and discussed. Prior to reviewing this work, it is appropriate to recognize that the idea of variably priced road facilities with enhanced bus services for the Washington region is not new: in 1959, Professor William Vickrey of Columbia University presented a statement to the Joint Committee on Washington Metropolitan Problems of the US Congress which advocated just such a set of policies. Professor Vickrey s presentation was subsequently published in 1994 in two articles (one in the Journal of Urban Economics, and one in Logistics and Transportation Review) in order to rescue it from obscurity and recognize it to be of considerable historical interest in the context of urban economic transport theory and policy. In 1996, Professor Vickrey received the Nobel Price in Economics for this and other pioneering work on pricing. Some selected quotations from Professor Vickrey s 1959 presentation to Congress provide an excellent starting point and context for the work reported in this study: Under urban conditions we cannot have both free flowing rush hour traffic and the absence of user charges or other constraints on highway use. One or the other of these desiderata must yield. 1 Recent technological developments in electronics have placed within reach and within reasonable cost the possibility of assessing against the users of metropolitan streets and highways a set of charges that can be tailored about as closely to the costs occasioned by the actual usage as these costs themselves can be estimated. This can be done without interrupting or even slowing the flow of traffic, and at a cost that will be minute compared to the savings produced in inducing a more economical and less congested pattern of traffic flow and a more economical apportionment of traffic between the various available modes of transportation. It would, moreover, go far toward solving the financial problems associated with the provision of the expensive facilities required to provide adequate transportation in a modern metropolis. 2 Pricing of highway use will thus make it possible to provide at reasonable cost uncongested and speedy transportation anytime, anywhere, and for anyone for whom the occasion is sufficiently urgent to warrant the payment of the corresponding charge. Without pricing, it is 1 Vickrey, William, Reaching an Economic Balance Between Mass Transit and Provision for Individual Automobile Traffic (1959), Logistics and Transportation Review, Vickrey, William, Statement to the Joint Committee on Washington, DC Metropolitan Problems (1959), Journal of Urban Economics 36, 42-65, 1994 iv
6 very likely that during the rush hours this degree of freedom of movement would not be available to anyone at any price. 3 It is accordingly of the utmost importance, in evaluating plans for traffic facilities, to consider the various ways by which their use may be suitably controlled. 4 Almost fifty years later, we now take up again the basic principles enunciated by Professor Vickrey and many other distinguished economists, planners and engineers, and present them for public consideration in a new context. 3 Vickrey, William, Statement to the Joint Committee on Washington, DC Metropolitan Problems (1959), Journal of Urban Economics 36, 42-65, Ibid v
7 1 Executive Summary The National Capital Region Transportation Planning Board (TPB), the Metropolitan Planning Organization (MPO) for the Metropolitan Washington Region, has undertaken an eighteen-month study to evaluate alternative scenarios for a network of variably priced highway lanes for the Metropolitan Washington Region. The study was conducted under a grant from the Federal Highway Administration s Value Pricing Pilot Program, and overseen by the TPB s Task Force on Value Pricing. 1.1 Study Background The TPB has had an active interest in variably priced highway lanes since June of 2003 when the TPB, in conjunction with the Federal Highway Administration and the Maryland, Virginia, and District Departments of Transportation, sponsored a successful one-day conference on value pricing for the Washington region. Following the conference, the TPB created a Task Force on Value Pricing to examine how value pricing could benefit the region. The Task Force developed a set of regional goals for a system of variably priced lanes which were adopted by the TPB in April of The goals were designed to help guide the regional development of variably-priced lanes that work together as a multi-modal system, while addressing the special policy and operational issues raised by the multi-jurisdictional nature of this region. As the framing of the regional goals proceeded at the TPB, three major variably-priced highway facilities were being developed through project planning studies for inclusion in the region s financially constrained Long Range Transportation Plan (CLRP): the Inter-County Connector in suburban Maryland, the Northern Virginia Capital Beltway HOT lanes project, and the I- 95/395 HOT lanes project. The Intercounty Connector is an 18-mile east-west highway in Montgomery and Prince George s counties in Maryland that will run between I-270 and I-95/US 1. The project will include six variably-priced lanes with express bus service connecting to Metrorail stations. This project was included in the CLRP in 2004, and construction is expected to begin in 2008 with an expected completion date of The Northern Virginia Capital Beltway HOT lane project will add four new HOT lanes to a 14-mile segment of the Capital Beltway (I-495). Vehicles with three or more occupants, as well as transit buses and emergency response vehicles, will be able to use the lanes for free; all other vehicles will pay a toll that varies according to levels of congestion and the time of day. This project was added to the CLRP in 2005, and completion is expected by The I-95/395 HOT lane project in Virginia was included in the CLRP in This project will reconfigure the existing HOV facility between Eads Street in Arlington County and just south of the Town of Dumfries from 2 to 3 lanes, and convert those lanes to HOT lanes. The project has an overall length of 36 miles, and includes a nine-mile taper lane near Dumfries to ease congestion as the HOT lane traffic merges back into the general purpose lanes. Completion of this project is expected by
8 1.2 Scenario Development In order to place these three new projects into a regional context and to assess the potential for a more extensive network of variably priced lanes, the TPB developed and analyzed several different scenarios of variably priced lane networks. Three basic highway networks were defined; A. A Maximum Capacity scenario in which two variably priced lanes (VPLs) were added to each direction of the region s freeways; one VPL was added to each direction of major arterials outside the Capital Beltway; existing High-Occupancy vehicle (HOV) lanes were converted to VPLs, and direct access/egress ramps were added at key interchanges in the VPL network. B. A DC Restrained scenario in which the new capacity from the Maximum Capacity scenario was removed from all of the bridges and other facilities in the District of Columbia, and replaced by variable pricing applied to existing freeway and selected arterial lanes. C. A DC and Parkways Restrained scenario in which the DC Restrained scenario was further restrained by applying variable pricing to the existing capacity on the region s parkways (Baltimore Washington, George Washington Memorial, Rock Creek, Clara Barton, and Suitland). The TPB s regional travel demand model was utilized to forecast the demand and performance characteristics of these scenarios for the year Starting with base toll rates of $0.20 per mile, a toll update algorithm was applied to gradually raise the tolls on those VPLs that were congested, until a free flowing volume to capacity ratio was achieved. The three networks were then prioritized by removing VPLs with low demand (as indicated by low toll rates). Finally, significantly enhanced bus transit services were added to each of the three prioritized VPL networks by shortening run times and headways of existing bus services, and adding new routes to sections of the VPL network that had neither current nor planned bus transit routes. In Virginia, vehicles with three or more occupants (HOV 3+) were allowed to use the VPLs free of charge; in the District and Maryland only buses were allowed to use the VPLs free of charge. 1.3 Scenario Analysis The results of the analysis demonstrated that toll rates on the VPL network would have to vary significantly by segment, direction and time-of-day in order to maintain free-flowing conditions. Toll rates ranged from a low of $0.20 per mile to over $2.00 per mile on the Maximum Capacity scenario, where all of the VPLs were either newly added lanes or conversions of existing HOV lanes. In the DC Restrained and DC and Parkways Restrained scenarios, where 43-percent and 56-percent respectively of the variably priced lane miles were existing as opposed to newly added lanes, toll rates were significantly higher on some segments. Where variable pricing was applied to existing capacity on DC bridges, for example, tolls of between $2.00 and $5.00 per one way crossing were required to maintain free-flowing conditions, corresponding to toll rates of between $3.00 and $10.00 per mile. 2
9 Compared to the Maximum Capacity scenario, the DC Restrained scenario had lower system-wide vehicle miles of travel (VMT) and some 37 percent higher system-wide toll revenue. Moving from the DC Restrained to the DC and Parkway Restrained scenario produced a further reduction in system-wide VMT, and a further 32 percent increase in system-wide revenue. In terms of financial feasibility, a comparison of the forecasted revenues versus costs for each of these scenarios found that because of the high costs of building new interchanges and new lane miles for newly added VPLs, only the DC and Parkways Restrained scenarios generated revenues close to covering costs. As would be expected, applying variable pricing to existing HOV or general purpose lanes generated revenues significantly in excess of costs. Where new VPLs are added to the network, revenues might equal or exceed costs on some segments with favorable demand, toll levels and construction costs. In many segments of the system, however, it appeared that revenues would not be sufficient to offset capital and operating costs. The addition of extensive transit service to the VPL networks resulted in system-wide increases in transit use of around 4 percent; decreases in HOV use of between 4 and 15 percent; small decreases in regional VMT; and decreases in total system revenue. In a few high transit demand corridors, high quality transit could have a significant impact on transit use, HOV use and total system revenue. 1.4 Impacts of the Scenarios on Land Use and Population Groups An effort was made in this study to assess the impacts of these VPL scenarios on land use patterns and different population groups in the region by looking at changes to accessibility to jobs and households effected by the scenarios. Very few zones experienced significant changes in accessibility to jobs by highways: some zones in Loudoun, Fairfax and Montgomery counties experienced increases, while some losses were experienced in the regional core in scenarios with high tolls on DC bridges. Accessibility to jobs by transit improved in all three scenarios, particularly in zones around the Beltway and in other major radial and circumferential corridors. Changes in accessibility to households by highways were minimal. Gains in accessibility to households by transit were found near major interchanges in the VPL network particularly around the Capital Beltway. These results suggest that a VPL network may encourage employers to locate at key VPL interchanges where they can enjoy significant increases in accessibility to the region s workforce, and that over time the VPL network could have measurable impacts on employer location decisions. The accessibility changes noted for different population groups were fairly evenly distributed across the various groups, based on their current and projected residential locations. Since the VPL networks were all quite comprehensive in their coverage of the region, this result was to be expected. Two of the three scenarios analyzed in this study include the application of variable pricing to a substantial number of segments of existing general purpose lanes. As might be expected, in addition to improved traffic management and travel reliability, these applications would generally have highly favorable financial results, generating revenues 3
10 well in excess of costs and providing opportunities for significant investments in expanded transit services. However, the benefits of improved traffic management on these general purpose lanes must be weighed against potential disbenefits for three distinct groups: the tolled (drivers using the newly tolled road who choose to pay the toll); the tolled-off (former users of the newly tolled road who have switched routes, modes or times for their trip, or are no longer making their trip altogether); and the untolled (drivers on other routes who are impacted by the drivers diverted by the tolls). A key factor with respect to addressing potential disbenefits will be the availability of highquality transit and other alternatives to all of those who are impacted by the new tolls. 1.5 Topics for Further Consideration The three variably priced lanes scenarios analyzed in this study have suggested some key topics for further consideration with respect to expanding the region s VPL network: Because in many locations it may not be financially feasible to add new VPLs, future work activities should assess the impacts of tolling more existing lanes. More detailed drilling down to specific segments is needed to assess the relative benefits and costs of adding new VPLs to the regional network.. More attention should be devoted to detailed specification of bus rapid transit (BRT) and other high quality transit services. More explicit consideration should be given to the impacts of VPL facilities on trucks, recognizing that new HOT lanes typically do not provide access to trucks. Geometrics of parkways and overpasses need to be examined in detail to assess the feasibility of applying variable pricing and increased bus transit to the region s parkways. The availability of right-of-way and other location-specific factors may effectively preclude the addition of new VPLs on certain portions of the regional network. Potential chokepoints within the VPL network and at access and egress points need in-depth analysis to ensure that delays and back-ups do not occur. The results of this study should be incorporated into several ongoing corridor studies that may be considering variably priced lanes, including the Southern and Western Mobility Studies, the 14 th Street Bridge EIS and the I-66 Corridor Study. Extensive public education and outreach about the potential benefits and impacts of variable pricing to manage highway congestion will be essential because of the limited experience with such strategies in the Washington region. Experience in cities like Stockholm and London could be very valuable in this regard. Ongoing work under the TPB s Scenario Study provides an excellent opportunity to pursue these considerations. During the next phase of the Scenario Study, specific segments of these three VPL networks could be identified as high priorities for expanding the VPL network beyond the three facilities currently included in the region s Constrained Long Range Plan (CLRP). 4
11 2 Introduction & Background Under a grant from the Federal Highway Administration's Value Pricing Pilot Program, the National Capital Region Transportation Planning Board (TPB) has undertaken a study to evaluate alternative scenarios for a network of variably priced highway lanes for the Metropolitan Washington Region. Since 2003, the TPB has made substantial progress in examining such scenarios through a variety of efforts including: hosting a value pricing conference; the establishment of a TPB value pricing task force; the adoption of goals for a regional system of variably priced lanes; and the inclusion of three major variably priced projects in the region s constrained long-range transportation plan (CLRP). The Virginia Department of Transportation (VDOT) has embraced the concept of High- Occupancy/Toll (HOT) lanes and, as described below, is actively working towards implementing two HOT lane projects. Virginia s HOT lanes will allow free use to transit vehicles and high-occupancy vehicles with three or more occupants (HOV-3). The Maryland and District Departments of Transportation (MDOT and DDOT) have adopted the concept of Express Toll Lanes (ETLs). Unlike HOT Lanes, ETLs require all those other than buses wishing to use the lane to pay the toll. This report uses the term variably priced lanes (VPLs) to refer to both HOT Lanes and ETLs. In 2003, the TPB s Task Force on Value Pricing for Transportation created a startingpoint value pricing scenario: an extensive network of new value priced lanes throughout the region. The Value Pricing Pilot Program grant has allowed extensive analysis of this large network, as well as the creation of other scenarios that pare back portions of the large network and apply variable pricing to some existing freeway and arterial lanes. This study has evaluated the potential benefits and performance of three alternative scenarios for a regional network of variably priced lanes. Tasks performed include: Scenario Development: development and refinement of three variably priced lanes scenarios. Scenario Analysis: assessment of potential demand and revenue; potential costs; viability of transit; measures of effectiveness; land use impacts; and connectivity to the regional core and activity clusters. Assessment of Impacts of Pricing Scenarios on Different Populations: Assessment of how the pricing scenarios may impact traditionally transportationdisadvantaged groups, including low-income populations, minorities and persons with disabilities. This is the final report of the study of these three scenarios for a regional network of variably priced lanes. In the following chapters, the study methodology and study results are described, as well as areas for future research. 2.1 About the Transportation Planning Board The National Capital Region Transportation Planning Board (TPB) is the Metropolitan Planning Organization (MPO) for the Washington metropolitan region. As an MPO, the TPB is responsible for coordinating transportation planning at the regional level and developing the long-range (20 to 25 year) financially constrained transportation plan for 5


12 the Washington region. A map of the TPB Planning Area is displayed in Figure 1.The TPB brings together key decision makers to coordinate planning and funding for the region s transportation system. Figure 1: Transportation Planning Board Planning Area and Member Jurisdictions Members of the TPB include representatives of local governments, the Maryland, Virginia, and District of Columbia departments of transportation, the Washington Metropolitan Area Transit Authority (WMATA), the Maryland and Virginia General Assemblies, and non-voting members from the Metropolitan Washington Airports Authority and federal agencies. 2.2 Value Pricing Policy and Planning Activities June 2003, Regional Value Pricing Conference In June 2003, the TPB in conjunction with the Federal Highway Administration, and the Maryland, Virginia, and District of Columbia departments of transportation jointly sponsored a successful one-day conference on value pricing for transportation in the Washington region. 200 people attended the conference, including numerous local 6
13 elected officials who spoke in support of value pricing. The conference was one of the region s first major public discussions regarding the need and opportunities for innovative transportation pricing strategies. News coverage of the event headlined on the front page of the Washington Post s Metro section: Toll Lanes Concept Catching On: Conference Looks at Pricing Fall 2003, Establishment of Value Pricing Task Force After the value pricing conference, the TPB created a task force on value pricing to examine how value pricing could benefit the Washington region. The goals of the task force included the development of recommendations for the TPB regarding parameters, principles, guidelines and lessons learned with regard to the regional implications of value pricing. The task force currently includes the following members: Chair: Christopher Zimmerman Arlington County Lyn Erickson Maryland Department of Transportation (MDOT) Tom Harrington Washington Metropolitan Area Transit Authority (WMATA) Catherine Hudgins Fairfax County Board of Supervisors Michael Knapp Montgomery County Council Timothy Lovain City of Alexandria Council Phil Mendelson District of Columbia Council Rick Rybeck District of Columbia Department of Transportation (DDOT) JoAnne Sorenson Virginia Department of Transportation (VDOT) The task force developed a set of regional goals for variably-priced projects in the region which were adopted by the TPB in April of These goals, shown in the Appendix, serve as a guide for the development and evaluation of regional variably priced lane scenarios Value Pricing Studies Fall 2005 to Fall 2006, Assisting VDOT in Analyzing Key Corridors The TPB has provided technical assistance in the studies of the two VDOT variably priced projects on the Capital Beltway and I-95/395. Through these analyses, performed under a technical assistance contract with VDOT, TPB staff estimated potential demand and toll revenue for the HOT Lane projects. Fall 2006, Sensitivity Analysis of Enhanced Transit Sensitivity tests were conducted using the network components created for the VDOT technical assistance studies. The goal of this analysis was to determine how enhanced transit service might impact the VPL network. The test involved transit services that use the Virginia HOT lane projects on I-95/395 and the Capital Beltway. The primary interest of the test was to determine the scale and direction of a collection of measures of effectiveness for increasing transit services on the VPL network. The 2006 CLRP contains many transit enhancements to be put in place by 2030 along the selected corridors. Those transit enhancements were moved forward in 7
14 time to a 2010 network and integrated with existing and planned transit services. The headways on this bundle of transit routes were decreased to a maximum of 15 minutes. Figure 2: HOT Lane network used for transit sensitivity analysis, Fall Figure 3: General impacts of increased transit service, from Fall 2006 sensitivity analysis. This sensitivity test resulted in the following changes in the travel demand model output: Transit use increased along the corridors. HOV use decreased along the corridors. o Presumably, many of these HOV users switched to the transit service. The toll rates on the tested segments decreased. The overall revenue from the toll lanes stayed generally the same. These results provide encouragement for the possibility of implementing increased transit service along additional corridors in the regional network of variably priced lanes. The Regional Accessibility and Mobility Scenario Study The TPB initiated the Regional Mobility and Accessibility Scenario Study ( the scenario study ) in 2001 to evaluate additional highway and transit options beyond those that are currently funded, and to examine the interaction of these transportation options with various land use alternatives. Federal law requires that the CLRP include only transportation projects that can be funded with revenues currently projected to be available over the time-frame of the plan. The scenario study provides the TPB with the opportunity to examine additional facilities that could improve the future performance of the region s transportation system and that have a realistic possibility of being funded with the identification of additional transportation revenues. Phase 1 of the scenario study, summarized in a final report dated November 17, 2006, included the development and analysis of five alternative land use and transportation scenarios. A sixth scenario, a network of variably priced lanes, was created in 2003 under the scenario study but not analyzed during Phase 1. Instead, the sixth scenario was used as a starting point for a much more extensive evaluation of a variety of pricing scenarios, conducted under the Federal Value Pricing Pilot Program grant and documented in this report. 8

15 This study of networks of variably priced lanes and associated transit and land use analyses will inform Phase 2 of the scenario study and may result in one or more second generation scenarios developed under the guidance of a new Scenario Study Task Force established by the TPB in the fall of Value Pricing Projects As of the completion of this document, the region s financially Constrained Long-Range Transportation Plan (CLRP) will include three variably priced toll facilities: the Intercounty Connector, the Northern Virginia Capital Beltway HOT Lanes project, and the I-95/395 HOT Lanes project. A map showing these variably priced facilities is presented in Figure 4. The Intercounty Connector is an 18-mile east-west highway in Montgomery and Prince George s counties in Maryland that will run between I-270 and I-95/US 1. The project will include six variably-priced lanes with express bus service connecting to Metrorail stations. This project was included in the CLRP in 2004, and construction is expected to begin in 2008 with an expected completion date of Figure 4: Value pricing projects in the 2007 CLRP. The Northern Virginia Capital Beltway HOT lane project will add four new HOT lanes to a 14-mile segment of the Capital Beltway (I-495). Vehicles with three or more occupants as well as transit buses and emergency response vehicles will be able to use the lanes for free; all other vehicles will pay a toll that varies according to demand and the time of day. This project was added to the CLRP in 2005 and completion is expected by The I-95/395 HOT lane project in Virginia was included in the CLRP in This project will reconfigure the existing HOV facility between Eads Street in Arlington County and just south of the Town of Dumfries from 2 to 3 lanes, and convert those lanes to HOT lanes. The project has an overall length of 36 miles, and includes the construction of a nine-mile taper lane to ease congestion as the HOT lane traffic merges back into the general purpose lanes. Completion of this project is expected by

16 2.4 Current and Projected System Performance Current highway congestion, 2005 Skycomp Report The TPB regularly commissions monitoring of regional freeway congestion. Skycomp, an aerial freeway monitoring company, has been performing traffic congestion surveys of the TPB planning area s 300-mile freeway network every 3 years since During this aerial survey program, overlapping photographic coverage is obtained for each designated highway, repeated once an hour over four morning and four evening commute periods. The morning times of coverage are 6:00-9:00 a.m. outside the Capital Beltway and 6:30-9:30 a.m. inside the Capital Beltway. The evening times are 4:00-7:00 p.m. inside the Capital Beltway and 4:30-7:30 p.m. outside the Capital Beltway. Survey flights are conducted on weekdays, excluding Monday mornings, Friday evenings and mornings after holidays. Data are extracted from the aerial photographs to measure average recurring daily traffic conditions by link and by time period. The most recent freeway monitoring was conducted in the Spring of Top Ten list of congested facilities Based on the 2005 Skycomp report data, a list of the top ten most congested facilities in the TPB planning area was generated. A map of these facilities is displayed in Figure 5. Figure 5: Top Ten Congested Segments on the Regional Freeway System, based on data from the 2005 SKYCOMP Report. The map in Figure 6, generated from the 2005 Skycomp data, illustrates the average recurring evening peak period congestion throughout the region. According to this slice 5 Traffic Quality on the Metropolitan Washington Area Freeway System Spring 2005 Report, February 15, 2006, National Capital Region Transportation Planning Board. 10

17 of the congestion data, the most congested corridors during the afternoon peak period are the following: the northwestern half of the Capital Beltway, I-270 from the Beltway to north of Gaithersburg, I-395 from the District s Southeast-Southwest Freeway to Dumfries, Virginia, and I-66 from the Beltway through the City of Fairfax, Virginia. Figure 6: Map of average recurring afternoon peak congestion, based on data from the 2005 Skycomp Regional Traffic Report. Figure 7: TPB Projection of traffic conditions in 2030 for the 2006 CLRP. It should be noted that the top ten congested segments have been selected from both the morning and afternoon peak periods, whereas the map in Figure 6 displays afternoon peak period congestion only. For example, Number 7 on the top-ten list (The George Washington Memorial Parkway, northern section, inbound) does not appear in the 2005 afternoon peak congestion map because this facility is only severely congested in the morning peak period Projected highway congestion of the 2006 CLRP A similar map to that displayed in Figure 6 was created to illustrate forecasted conditions in 2030, incorporating currently existing facilities plus those listed in the 2006 CLRP. This map of forecasted congestion is displayed in Figure 7. It should be noted that the 2006 CLRP as pictured in this congestion map includes both the Intercounty Connector (ICC) and Beltway HOT Lane project as described above, but does not contain the Shirley Highway (I-95/395) HOT Lane project, as it was only listed as a study in the 2006 CLRP. While the 2030 map does illustrate an increase of congestion from 2005, there are some areas where congestion has decreased. One such area is the Virginia portion of the Capital Beltway between the Shirley Highway (I-95/395) and the American Legion Bridge. The majority of this section shows an improvement over 2005 congestion levels, 11
18 most likely attributable to the addition of the HOT lanes (two in each direction) along this segment. It should be noted, however, that despite the additional capacity included in the 2006 CLRP, the segment of the Capital Beltway between I-66 and the Dulles Toll Road is still listed as stop and go conditions. Another facility that shows reduced congestion is I-270, where severe congestion along the corridor between the Capital Beltway and Gaithersburg is projected to decline in severity. This decrease in congestion coincides with the addition of new capacity planned to be added to the I-270 corridor. The 2006 CLRP contains three projects along this corridor: the widening of I-270 through Gaithersburg and Rockville (planned for 2025); the addition of HOV lanes between Gaithersburg and Frederick (planned for 2020); and the Corridor Cities Transitway, which will extend transit service from the end of the Metrorail Red Line at Shady Grove along the I-270 Corridor (planned in two phases, 2012 and 2020). However, the performance of many facilities is projected to worsen. These worsening facilities include the Dulles Toll Road from the Loudoun County line to the Capital Beltway, I-66 from the Beltway to the Roosevelt Bridge, I-95 in Maryland and the Baltimore-Washington Parkway. It should also be noted that the projections for 2030 show the entire Capital Beltway experiencing some level of congestion during the evening rush hours. 2.5 Study Methodology This study is based upon previous pricing analysis performed by TPB staff under the purview of the TPB Task Force on Value Pricing. The key assumptions which were used for the study include the following: Study Assumptions All scenarios are for the year 2030, and all toll values, revenue calculations, and cost estimates are in 2010-dollars. Variable tolls will be set on the lanes to prevent congestion and maintain reasonably flowing traffic. Occupancy requirements for all HOV lanes will be increased to at least three people or more, based on planning assumptions in the region s long-range plan. The variably priced facilities will be physically separated from the other lanes, where possible. Access and egress points will be primarily focused around the regional activity clusters 6. At least one variably priced lane will be provided in the peak direction. All tolled infrastructure will be priced 24/7/ COG and TPB have defined and adopted regional activity centers and clusters to help guide regional transportation planning decision-making, The 58 Centers are based on local government growth forecasts and categorized according to similar employment, residential, and growth pattern characteristics. The 24 Clusters tend to be groupings of Centers and are a more conceptual, stylized depiction of development than the Centers. The activity clusters are shown in many of the maps below, beginning with the map of Scenario A in Figure

19 2.5.2 Technical Methods Travel Demand Model This study utilizes the TPB regional travel demand model to forecast the demand and performance characteristics of a network of variably priced lanes for a series of scenarios. The model follows four steps: trip generation, trip distribution, mode choice, and traffic assignment, with repeated iterations to ensure consistency between travel demand and network service levels. The region s jobs and households are represented in over 2000 transportation analysis zones (TAZs), with tens of thousands of links in highway and transit networks. Each full model run takes approximately 16 hours of computer processor time. Analysis of a scenario involves two full model runs, with one run of an external toll search routine in between. This process is illustrated in Figure 8. Figure 8: An external toll update algorithm is used to determine the tolls on the value priced network. This algorithm operates on the output of an initial travel demand model run, and the new tolls are fed back into a second model run. First, the base tolls are set ($0.20 per mile) and a pump prime model run is performed to pre-load the network and determine traffic volume levels with the base toll. Next, an external toll update algorithm evaluates the demand on the toll lanes. For those toll lanes that show congestion with the base tolls, the tolls are raised and the demand on the toll lanes is again assessed. This process continues until the toll lanes are relatively free flowing. Free flow is determined by using volume-to-capacity (V/C) ratios. All types of facilities in the TPB model exhibit low speeds when demand is close to or in excess of maximum capacity. Therefore, it is important to find a balance between high speeds and high flows. Different roads have different characteristics, design speeds, and vehicles-per-hour capacities. The V/C ratio, which compares a facility s operating volume to its design capacity, provides a good measure of how well any road is performing regardless of the type of facility. A V/C ratio range of from 0.6 to 0.8 was selected as the one which strikes the best balance between high speeds and high flows. 13
20 Finally the toll rates in the model are updated to the toll rates determined by the toll update algorithm, and the four-step model is rerun, reflecting impacts of the tolls on trip distribution, route selection and mode choice. Traditional analyses that estimate the potential demand for a new toll road use a diversion curve method for predicting the demand for the value priced lanes throughout the region. However, the TPB analysis has employed a technique which converts the toll penalties to equivalent time penalties based on a traveler s value of time. These additional time penalties are then added to the individual links during the four-step travel demand modeling process. The TPB travel demand model used for this analysis (Version 2.1 D #50) 7 incorporates four different income categories, each with unique values of time for peak and off-peak periods. These income categories and values-of-time impact how the VPL tolls are to be translated to time-penalties for the different income groups. 8 7 Documentation for this model is available for purchase or download on the MWCOG/TPB website: 8 Recent analyses of variably priced lanes operating in California have indicated that travelers are willing to pay a premium over and above travel time savings due to the reliability benefits of VPLs. To the extent that this is the case, the toll values estimated in this study may be lower than will be experienced in actual operations. It is strongly recommended that before and after studies be conducted as new variably priced lanes are introduced in the Washington region. Such studies would provide valuable empirical information on how travelers respond to these lanes under the conditions prevailing in this region. 14

21 Figure 9 displays the different values of time used for the four household income group quartiles. The income groups and the equivalent value of time for peak and off-peak travel are documented in the COG/TPB Travel Forecasting Model User s Guide of Version 2.1D#50 model, pages 2-3 to 2-9. It should be noted that the cooperative forecasting process used to specify the future numbers and locations of jobs and households does not produce Figure 9: Income groups and corresponding values of time used in the TPB models and analyses. future distributions of household income. Income data, as well as other demographic data, is from the 2000 Census. Incorporation of Tolls in the Travel Demand Model Tolls are incorporated into the travel demand model in three of the four steps: trip distribution, mode choice, and trip assignment. Trip Distribution: During trip distribution, the average travel time by mode is calculated between each pair of transportation analysis zones (TAZs). These travel times are used to determine the number of trips distributed to each pairing of zones. Each of the 2200 TAZs has an average income associated with it. This average income falls into one of the four income categories described above, each of which has a different value of time for travel during peak and off-peak periods. A value of time is associated with each TAZ based on its average income. This value of time is used during the calculation of the time-penalty for using tolled facilities from each TAZ to every other TAZ. This time penalty is added to the travel time calculations during trip distribution, when the travel times between TAZs are calculated. Example: The travel time from TAZ a to TAZ b is 55 minutes using the general purpose lanes and 35 minutes using the value priced lanes. Based on the average income of TAZ a, the tolls incurred on the value priced lanes translate to an additional 10 minutes of travel time, resulting in a 45 minute effective travel time from a to b using the value priced network. The lowest effective travel time from a to b, in this case 45 minutes, is then used as the auto travel time for the trip distribution process. Mode Choice: Effective travel times between zones change due to new tolled lanes (new capacity decreasing auto travel times) or new tolls on existing roads (new tolls increasing effective auto travel times). These changes in travel times then impact the mode choice, making transit more or less favorable. It should be noted that both scenarios described above should decrease travel time for bus transit, and therefore transit travel times would 15
22 change as well. The new travel times per mode are then evaluated during the mode choice step of the four-step model. Example: The effective travel times from TAZ a to TAZ b was 70 minutes before the VPLs were put in place. Bus travel time between the zones was 80 minutes. After the VPLs were opened, the travel times between TAZ a and TAZ b are 55 minutes and 45 minutes by general purpose lanes and value priced lanes, respectively. Additionally, because the bus can use the VPLs from TAZ a to TAZ b, the new transit travel time between these zones is 50 minutes. In this example, the VPLs have made transit more favorable relative to driving in the general purpose lanes, and would increase transit s mode share. Trip Assignment: During assignment, auto trips are assigned to routes based on travel times. This assignment process takes tolls into account, also using a time-toll penalty. Unlike during trip distribution, where the time-toll penalty is based on average TAZ income, the assignment stage assigns different values of time to different users/modes: SOV, HOV2, HOV3, truck, and airport travel. This can result in different user types choosing different routes between any two TAZs. Example: Route m from TAZ z to TAZ w has a base travel time of 35 minutes and uses priced lanes which have a toll of $1.50 for single-occupant vehicles and no toll for HOV3+. Because the different users/modes have different values of time, the effective travel time for route m could be 45 minutes for SOVs and 35 minutes for HOV3+. If another route n has a lower effective travel time, say 42 minutes, for SOVs from z to w, those trips will be assigned to route n instead of route m. Note that at this stage, the average income of TAZ z is not directly factored in, but is carried over from trip distribution by the number of trips that wish to go from z to w. Sensitivity Testing Sensitivity tests are conducted by comparing final model results with the original baseline model results. For example, the transit sensitivity tests are performed by adding enhanced transit service to the initial model before the pump prime model run and then the process continues as specified above. The model outputs are then compared between the baseline model run and the model run with enhanced transit service. These sensitivity tests are conducted to better understand how a change in the modeled system (transit service, land use, highway capacity) might influence the system outputs. For example, an increase in transit service might greatly increase transit use and personmiles traveled, slightly decrease toll levels and leave toll revenue unchanged. Measures of Effectiveness (MOEs) The travel demand model used for this analysis forecasts many outputs describing the utilization and performance characteristics of the system. Regional vehicle-miles traveled (VMT), High-Occupancy Vehicle (HOV) use and transit ridership provide good yard sticks for the performance of the regional system. 16
23 Inspection of the performance of individual highway links (such as speeds, volumes and rates of variable tolls) of the transportation network can also be accessed and can portray the performance of particular facilities, such as bridges. Finally, total system revenue is an important measure for the study of a toll lane network. System revenue is estimated in order to determine the financial feasibility of the variably priced network and the possibility of funding transit services operating on the tolled facilities. Estimates of annual system revenue are calculated using the following technique: o Multiply the average hourly per-link demand for the toll lanes by the average perlink toll rate for each of the three periods (AM peak, PM peak and off peak) o Calculate the average daily revenue for a workday assuming a 3-hour AM peak, 3-hour PM peak and 18 off peak hours. o Calculate average daily revenue for a non-workday (weekends and federal holidays), assume 24 off peak hours. o Multiply the average daily workday revenue by the number of work days (250), and add to the average daily non-workday revenue multiplied by the number of non-work days per year (115). 17


24 3 Scenario Development As described above, a pricing scenario was developed under the TPB s scenario study but not analyzed. This scenario, now referred to as Scenario A, was based on the 2006 CLRP for 2030 and included an extensive set of new variably priced lanes throughout the region. This scenario was used as the starting point for further development and analysis of additional pricing scenarios under the Federal Value Pricing Pilot Program grant. The additional scenarios studied under the grant include variations of Scenario A, including pared-back networks, the pricing of existing facilities and the addition of enhanced transit. 3.1 Roadmap for the Scenarios The work performed under the FHWA grant involved creating a series of variably priced network scenarios. A schematic illustrating this scenario development is displayed in Figure 10. Figure 10: Scenario development flow chart. In general, the following describes how the scenarios were developed: 18
25 1. Scenario A: Add two new toll lanes to each direction of every freeway in the region. Add one toll lane in each direction to major arterials outside the beltway. This scenario only tolls new capacity. 2. Scenario B: Starting from Scenario A, toll all existing DC river crossings, remove added VPLs from the District and instead toll all lanes of the freeways. Link tolled freeways with additional tolled facilities. Relieve bottlenecks in the variably priced network outside the beltway by adding additional tolled lanes. 3. Scenario C: In addition to Scenario B, toll the existing parkways in the region. 4. Scenarios AP, BP and CP are prioritized versions of Scenarios A, B and C, where priced lanes are removed based on lack of demand. 5. The enhanced transit scenarios APT, BPT and CPT include enhancements to the transit networks that use the variably priced lanes. APT and BPT include reduced run times and headways on existing (2030) bus routes that can operate on the value priced lanes. CPT includes enhanced and new bus routes that operate on the region s parkways. These scenarios are described in greater detail in the following sections. (Full-page versions of the maps in this section are available in Chapter 8, Supplemental Maps and Figures.) 3.2 First Round Scenarios Scenario A Scenario A was created using the following rules: 1. All planned or studied variably priced facilities are added to the network. 2. All HOV lanes are converted to VPLs. a. This includes HOV lanes that are currently only HOV-restricted in the peak period and direction. These HOV lanes are converted to VPLs with 24/7 operation. 3. All freeways in the region have two VPLs added to them in each direction. a. In the case where the freeway had one HOV lane, another VPL is added. b. In the case where the Figure 11: Scenario A, new capacity added to freeways and major arterials outside of the Capital Beltway. facility was entirely HOV during the peak period, no additional lanes were added and the entire facility is variably priced. 19

26 20 4. All arterials outside of the beltway have one VPL added in each direction. 5. Tolled facilities that have tolls which can be set by time of day and direction are added to variably priced facilities. These rules create a regional network of value priced lanes that consists only of new capacity and converted HOV lanes: No existing capacity is tolled in this base scenario. A map of the resulting network is displayed in Figure Scenario B: Toll District of Columbia River Crossings and Major Facilities Relative to Scenario A, Scenario B tolls river crossings in the District of Columbia and removes all new priced capacity from the District and instead tolls existing freeway lanes and other facilities. The development of Scenario B is discussed below. Scenario B includes the remainder of the District river crossings which were not included in the previous scenario because they are not part of the Interstate Highway system: Chain Bridge Key Bridge Memorial Bridge South Capitol Street (Frederick Douglas) Bridge Pennsylvania Avenue (John Phillip Sousa) Bridge East Capitol Street (Whitney Young Memorial) Bridge Benning Road Bridge The addition of the bridges to the analysis came at the request of the District Department of Transportation (DDOT). As part of Figure 12: Scenario B includes tolling District of Columbia river crossings and other DC facilities added to Scenario A. this study, these bridges are added to the regional network without the addition of any new capacity, but instead the existing lanes are tolled. Additionally, at the request of DDOT, Scenario B removes all new VPL capacity added to the District s roadways in Scenario A and instead tolls the existing capacity on those facilities. This includes I-395 and I-66 through the District, the 14 th Street Bridge and the Theodore Roosevelt Bridge. This request reflects the fact that there is very little right-ofway for adding new lanes within the heavily urbanized District. Scenario B also tolls other existing facilities in the District in an effort to add connectivity between the disconnected ends of freeways that terminate in the District. I- 395 in the District is connected to US-50 by tolling New York Avenue from the District line to its intersection with I-395 at 4 th St NW. The Arlington Memorial Bridge is
27 connected to the Southeast/Southwest freeway (I-395) by tolling portions of the Rock Creek and Potomac Parkway, Independence Ave. SW and Maine Ave. SW Finally, Scenario B attempts to alleviate chokepoints where freeway VPLs intersect with arterial VPLs outside the District. At these interchanges, VPL traffic from each direction of the freeway attempts to exit to the arterial in the same direction, causing congestion and extremely high tolls in Scenario A. In Scenario B, these locations have additional VPLs added to the arterial to provide relief from this congestion. The chokepoints addressed using this technique are as follows: Fairfax County Parkway northbound and southbound at the Dulles Toll Road (VA-267) Braddock Road westbound at the Capital Beltway (I-495) Indian Head Parkway (MD-210) southbound at the Capital Beltway (I-495) The changes to the value priced network in Scenario B are illustrated in red in Figure Scenario C: Add Parkways Scenario C adds the parkways throughout the region to the network defined for Scenario B. The parkways are under the jurisdiction of the National Park Service. The parkways listed below were added to the value priced regional network without the addition of new capacity, with tolls added to the existing lanes: The Baltimore Washington Parkway (MD-295) The George Washington Memorial Parkway The Rock Creek and Potomac Parkway The Clara Barton Parkway The Suitland Parkway The additional facilities added in Scenario C are illustrated in green in Figure 13. Figure 13: Scenario C: Regional parkways added to Scenario B. It should be noted that the pricing of the region s parkways is not a proposal of the National Park Service. Instead, the tolling of the parkways was added to the study at the request of representatives of the Federal Highway Administration. 21
 Segments with low toll rates in both directions were removed from the network.")
28 3.3 Prioritized Scenarios The prioritized scenarios were developed by paring back the firstround scenarios based on demand: Segments with high toll rates in the peak direction but low or base tolls in the opposite direction were changed to directional toll lanes. (For example, US-50 from Annapolis to US-301) Segments with low toll rates in both directions were removed from the network. (US- 301) When the demand was analyzed in order to evaluate which segments were to be removed, none of the newly tolled existing capacity in Scenarios B and C showed lack of demand. Therefore, what was removed from each of the scenarios was the same as for Scenario A. Figure 14: Scenario CP removes links with low demand (shown as dashed lines) from the value priced networks. This resulted in the removal of many links from the variably priced network, as illustrated by the green dashed lines in Figure Scenarios with Enhanced Transit This section describes the development of the enhanced transit scenarios. Analysis of the transit scenarios is covered in the next section APT & BPT The enhanced transit network for scenarios AP & BP was created out of the 2006 CLRP (for 2030) bus transit network. All 2030 bus transit routes that run more than 1/3 of their route on the VPL network were recoded to use the VPLs instead of the general use lanes. Both MDOT and VDOT have employed TPB staff in technical aspects of studies of bus transit on the Capital Beltway. These studied Beltway transit routes were also added to the enhanced transit network. Finally, new bus transit routes were added to sections of the VPL network that have neither current nor planned bus transit routes: VA 28 and the Fairfax County Parkway. Bus transit routes were added to the VPLs on these roads between I-66 and VA-7, and include stops at major activity centers. Next, the planned transit service was enhanced to reflect the benefits of running buses on value priced lanes: increased speeds and increased frequency. All bus routes running on the VPL network had their run times reduced by half to reflect potential increases in speeds when operating on the congestion-free VPL network. Also, the headways of all routes using the VPL network were reduced by 50%, reflecting the possibility of using toll revenues to increase the bus transit level of service. 22
29 This new transit network was added to the AP and BP scenarios described above, resulting in two new scenarios: APT and BPT CPT Scenario CPT further adds to the transit operating on the VPL network by enhancing existing bus service operating on the parkways and adding new transit routes to the parkways. Existing commuter bus routes were modified to capture the potential benefits of operating on the VPL network. As with APT & BPT, the headways of existing bus service on the parkways were reduced by 50%, and their running times were cut in half. The following parkway bus routes were created or enhanced in scenario CPT. Bold route numbers are newly proposed bus routes for this transit scenario. Cabin John/Clara Barton Parkways o Route 14 CBP Lakeforest Mall/Montgomery Mall Transit Center to Farragut Square. Baltimore-Washington Parkway o Route B30 Greenbelt Metro Station to BWI o Route 87 Greenbelt Metro Station to Laurel o Route 88 New Carrollton Metro Station to Laurel o Route BWPI I-95/495 Park and Ride to Metro Center Suitland Parkway o Route MTA 02A St. Leonard to State Department o Route MTA 02B Calvert County Fairgrounds to State Department o Route MTA 03A Charlotte Hall, St. Mary s County to North Capitol and H Sts. o Route MTA 04A North Beach to State Department o Route C11SPI Clinton Park and Ride to Farragut Square o Route H11SPI Heather Hill Apartments to Farragut Square o Route K12SPI Branch Avenue Metro Station to Farragut Square o Route J15SPI Melwood Park and Ride (proposed) to Federal Triangle George Washington Memorial Parkway Northern Section o Route 15K#20 Rosslyn Metro Station to George Mason University o Route 15KX Rosslyn Station to Tysons Central 123 Metro Station (proposed) George Washington Memorial Parkway Southern Section o Route 11YXI Mt. Vernon (VA) to Farragut Square Metro Station 3.5 Scenario Development Summary Scenarios A, B and C were developed as starting point scenarios, where all possible lanes were included for analysis. Subsequent analysis of these scenarios resulted in segments with demand low enough to warrant their exclusion from the variably priced lane networks. Those lanes segments were removed or made reversible, resulting in three refined Scenarios: AP, BP and CP. Finally, transit was added to each of the scenarios. The addition of transit did not change the roadway networks modeled in the scenarios. 23
30 These scenarios are a mixture of general purpose lanes and priced lanes. The priced lanes are either converted general purpose lanes, converted HOV lanes, or newly constructed lanes. The priced lanes are either HOT lanes (allowing HOVs, in Virginia) or express toll lanes (ETLs, in Maryland and the District) which do not provide free access to HOVs. Table 1 presents a summary of the numbers and types of lane miles in 2030 for the 2006 CLRP and the prioritized scenarios under study. Priced lanes are broken out by HOT versus ETL, and HOV lanes that are always HOV-only are separated from peak-only HOV lanes. Figure 15 presents a graphical representation of the same data. It is notable that the size of the general purpose network decreases across the scenarios, as the number of HOT/ETL lane miles increases. In Scenario CP, 40% of the regional network as defined in the footnote is priced. Also to be noted is the large increase in the number of lanes that will provide high quality service to high-occupancy vehicles (in Virginia only). Finally, the variably priced lanes scenarios increase the size of the CLRP regional network by 18% (Scenarios BP and CP) and 20% (Scenario AP). Table 1: Summary of the number of priced and general purpose lane miles in 2030 for the 2006 CLRP and prioritized scenarios. CLRP AP BP CP GPLs VPLs ETLs HOT Lanes /7 HOV Peak-Only HOV Regional Network 3,383 4,099 4,029 4,029 Percent Priced Lanes 5% 29% 32% 40% Percent Increase from CLRP n/a 20% 18% 18% CLRP GPLs include all freeways, major arterials outside the beltway, parkways and selected arterials in the District as specified in Scenario B. 10 Peak-only HOV includes lane miles that are restricted to HOVs in the peak direction during peak period only. 24
31 Roadway Network Specifications Across Scenarios Lane Miles Peak-Only HOV 24/7 HOV HOT Lanes ETLs GPLs CLRP AP BP CP Scenario Figure 15: A graphical representation of the summary of the number of priced and general purpose lanes in 2030 for the 2006 CLRP and prioritized scenarios. 25
32 4 Scenario Analysis 4.1 Potential Demand and Revenue The scenarios developed as described in Chapter 3 were analyzed for potential demand and revenue of the value priced lanes. All of the scenarios showed high demand for use of the variably priced lanes across the region. Segments with the highest demand for the tolled infrastructure include the District river crossings, the Baltimore-Washington Parkway, I-66 inside the Beltway, and major intersections of the VPL network. The prioritized scenarios are analyzed here for demand and revenue Demand and Revenue Assessment A map showing the predicted PM tolls on the network links in the prioritized Scenario AP is displayed in Figure 16. These results confirmed that tolls would have to vary by segment and direction in order to maintain a free flow on the toll lanes. Scenario AP includes three toll facilities that have been studied independently by the TPB as well as local jurisdictions and consultants: the Intercounty Connector, the Beltway HOT Lanes and the Shirley Highway I-95/395 corridor HOT Lanes. When studied as part of this larger network, the tolls on these facilities are projected to be much higher than when these facilities were studied in isolation. This is an indication of the network effect: each facility has higher connectivity and provides greater accessibility as part of a network than it would individually. Figure 16: PM peak period tolls from Network AP. Compared to the 2006 CLRP, Scenario AP increased regional HOV use by 20% and increased transit use by 3.4%. These gains were accompanied by a 2.7% increase in regional VMT. Analysis of this initial network also raised awareness of the need to further address access and egress to the priced lanes. The travel demand model assumes that traffic on variably priced lanes can freely enter and leave the toll network. This assumption may not hold true for many parts of the modeled VPL network, as many of the modeled exit ramps connect into areas of heavy local congestion. In fact, many access and egress points of the current regional freeway network experience congestion that at times impacts traffic 26
33 on the freeways. Microsimulation tools may be used in the future to examine access and egress issues and identify ways to remedy them. Scenario BP, which added the District river crossings, showed high toll rates on these bridges. The toll rate for the bridges was calculated to be generally between $3 and $10 per mile. Each of these bridges is shorter than a mile, so the resulting bridge tolls were estimated generally between $2 and $5 per oneway crossing. The toll levels resulting from the analysis of Scenario BP are displayed in the map in Figure 17. High toll rates result on the District river crossings and existing facilities added to the priced roadway network in this Scenario. The total revenue of the system increased by 37% compared to Scenario Figure 17: Projected toll rates from Scenario BP. AP. This result is expected, as new tolled facilities were added to the network and all of the DC facilities included in the network are toll-only. From Scenario AP: System-wide VMT decreased by 0.6% HOV decreased by 7.5% Transit trips increased by 1.8% The toll rates resulting from the analysis of Scenario CP are displayed in the map in Figure 18. The most compelling result from Scenario CP is the high tolls on the Baltimore- Washington Parkway, which has significant tolls on nearly every segment of its tolled length from its origin at US-50 to the Howard/Baltimore county line. Compared to Scenario BP, Scenario CP resulted in higher bridge tolls: the average bridge toll increased by about $0.60 per mile. The system-wide revenue of Scenario C was 32% higher Figure 18: Projected toll rates from Scenario CP. than that of Scenario BP. Other changes between Scenarios BP and CP include: A small system-wide reduction in VMT (0.6%) 13% decrease in HOV use 27
34 A small increase in transit use (about 1%) Comparison Across Scenarios It is also instructive to look at general trends in the measures of effectiveness (MOEs) across scenarios. In the above sections, the primary measures of effectiveness of the different scenarios were the following: regional vehicle miles traveled (VMT); highoccupancy vehicle (HOV) usage; transit use; total system-wide toll revenue; and bridge tolls. Table 2 displays these MOEs as percentage changes from the 2006 CLRP. Table 2: Summary of changes in measures of effectiveness across first-round scenarios, as a percentage change from the base 2006 CLRP. Scenario AP Scenario BP Scenario CP New PM Priced Lane Miles 11 1,054 1,136 1,474 % Converted Lane Miles 32% 43% 56% Regional VMT 2.7% 2.0% 1.2% HOV Use 20.4% 11.4% 3.6% Transit Use 3.4% 5.3% 5.9% Annual System Toll Revenue (millions) $1,520 $2,080 $2,750 Average Bridge Toll n/a $2.41 $2.80 Summary of Scenario Development As described above and displayed previously in Figure 10, the scenarios (AP, BP and CP) were based on the 2006 CLRP, each one increasing the size of the variably priced network. Scenario AP added new capacity; Scenario BP removed some of that added capacity and then tolled much existing capacity in the District; Scenario CP then added more lanes to the tolled network by tolling the existing parkways. In each of these scenarios, the size of the variably priced network increased. It should be noted that, while increasing the size of the variably priced network, Scenarios B and C decrease the size of the regional non-tolled highway network because existing general purpose lanes are being converted to variably priced lanes. This trend was illustrated previously in Table 1. VMT, HOV Use and Transit Ridership As would be expected, the addition of new capacity in Scenario A increased regional VMT. However, because this new capacity is tolled, it is likely that this VMT increase is less than it would have been if the new capacity was added as toll-free facilities. Throughout the rest of the scenarios, as un-tolled facilities are converted to tolled facilities and added to the variably priced network, regional VMT continues to decrease from the original 2.7% increase seen in Scenario AP, to smaller increases of 2.0% in Scenario BP and 1.2% in Scenario C. 11 The 2006 CLRP for 2030 contains the Beltway HOT Lanes project and the ICC, resulting in 155 existing priced lane miles in the base case not included here. 28
35 HOV use for all three scenarios (AP, BP and CP) is greater than in the 2006 CLRP, with increases of 20% in Scenario A, 11% in Scenario B, and 4% in Scenario C. The change in transit use across scenarios is what might be expected: With a large increase of capacity in Scenario AP, transit vehicles (regardless of whether they use the new capacity or not) should experience reduced runtimes which would make bus transit a more viable alternative to driving alone. From Scenario AP to Scenarios BP and CP, as the variably priced network grows and the general-use network shrinks, it is expected that more commuters would choose transit, since the number of transit lines using the variably priced network increases. Comparison of System Revenue Table 2 displays the change in total system revenue across scenarios. Both Scenarios BP and CP add capacity to the variably priced network and toll existing infrastructure, reducing the size of the general-use network. As would be expected, these scenarios both increase the total system revenue. Comparison of Bridge Tolls As displayed above in Table 2, the average bridge toll increased $0.40 from Scenario BP to Scenario CP. This is a reasonable expectation, as a larger variably priced network would make these priced river crossings more valuable to individual drivers. This is another example of the network effect, as previously mentioned in the description of Scenario AP above. 4.2 Scenario Cost Estimates Methodology The cost of a variably priced facility is a function of the number of its lane miles and interchanges. Throughout the scenarios described above, many facilities have new lanes added while others have existing lanes converted. Additionally, new barrier-separated lanes require dedicated ramps at each access point, whereas the conversion of existing facilities generally does not. Therefore, the estimated cost of constructing the variably priced network is calculated as a function of the following four factors: New Variably priced Lane Miles ($ per lane mile) Converted Variably priced Lane Miles ( $ per lane mile) New Interchanges ($ per interchange) Modified Interchanges ($ per interchange) MDOT and VDOT were asked for unit cost estimates to attach to the above factors. MDOT responded with cost estimates from preliminary studies on the Capital Beltway (from their West Side and South Side Mobility Studies). VDOT responded with cost estimates based on the Capital Beltway HOT Lanes project described above. Because the costing factors presented by the different DOTs were not the same, these values were essentially averaged to determine the unit cost estimates. In order to compare costs to revenues, the dollar figures must be in the same constant dollar year. The costs supplied by the DOTs were year 2007 dollars, while the revenue values from the analysis were year 2010 dollars. The averaged unit costs were adjusted upwards by 10% to reflect 29
36 inflation between 2007 and The responses from the DOTs, reconciled (averaged) costs, and the inflation-adjusted unit cost values used in this analysis are displayed below in Table 3. Table 3: Unit costs for factors of the value priced networks, in millions. Summary MDOT VDOT Reconciled Costs 2007$ Reconciled Costs 2010$ Cost Per New/Major Interchange $230 $175 $200 $220 Cost Per Modified/Intermediate Interchange $130 $100 $120 $132 Cost Per New Separated VPL Lane Mile $45 $11 $30 $33 Cost Per Converted Lane Mile $4 $3 $4 $4 Each of the value priced network scenarios was assessed to calculate the values for the costing factors described above: the number of new and converted lane miles, and new and modified interchanges. The lane miles calculations were performed using geographical information systems data of the value priced networks to determine the lengths of the individual coded network segments. These lengths were then linked to the lane-profiles of the segments. The lane profile specifies the number of VPLs per each segment, and which of these are converted from HOV lanes or newly constructed. The segment lengths were multiplied by the number of new or converted lane miles in each segment and then summed, resulting in the total number of new and converted lane miles per scenario. The number of interchanges was determined by performing additional GIS analysis. First, interchanges were divided up into two categories: interchanges between lanes within the VPL network (VPL to VPL), and interchanges from the VPL network to the general purpose lanes (VPL to GPL). These two categories were further broken down into a typology of interchanges so that the number of interchange ramps could better be estimated. The interchanges in the network fall into the following categories: o VPL to VPL o X: Full four-way interchange o T: Three-way or trumpet interchange o Y: Three-way merge/diverge interchange o VPL to GPL o H: Diamond-style interchange o W: Other interchange, mostly consisting of a series of slip ramps The interchanges were categorized and counted for each scenario. A map of the interchanges and types is presented in Figure 19. The numbers of lane miles (new and converted) and interchanges for each scenario are presented in Table 4. 30


37 Figure 19: Map of interchanges within or connecting to the VPL networks. This map shows the maximum extent of the VPL network across scenarios, to show all possible interchanges involved Analysis This analysis also looks at the costs of converting existing lanes versus the cost of constructing new facilities. However, the definition of existing lanes is not straightforward. If an entire facility is converted to a tolled facility, the cost of that conversion is lower than converting one existing lane of existing facility that also has parallel general-purpose lanes. This study has assumed direct access ramps from all of the priced lanes in the network. According to the data in Table 3, these fly-over ramps are costly. However, an entire facility that is converted requires no new ramps, as there are no general purpose lanes that need to be crossed, or flown-over. Therefore, for this costing exercise, existing lanes miles converted to priced lanes that have parallel GPLs are counted separately from lane miles on facilities that are converted in their entirety. These are differentiated using the following terminology: 31
38 o Upgraded Existing Lane Mile: A lane mile converted to a priced lane mile (most likely from HOV in this study) along a facility with parallel general purpose lanes. o Converted Facility Lane Mile: A lane mile of a facility that is converted to a priced facility in its entirety. Both Upgraded Existing Lane Miles and Converted Facility Lane Miles carry the same cost of conversion. However, they are broken out so that an assessment of the cost of converting entire facilities can be compared with the cost of adding/converting individual lanes along existing facilities with parallel general-purpose, toll-free lanes. The summary of the attributes of the variably priced scenarios is presented in Table 4. These figures were multiplied by the cost factors shown above in Table 3, with the results displayed in Table 5. Table 4: Cost-related attributes for the variably priced scenarios. AP BP CP New VPL to VPL Interchange New VPL to GPL Interchange New VPL Lane Mile Upgraded Existing Lane Mile Converted Facility Lane Mile Table 5: Breakdown of costs for the variably priced scenarios, in millions. AP BP CP New VPL to VPL Interchange $7,000 $6,400 $6,400 New VPL to GPL Interchange $20,100 $20,100 $20,100 New VPL Lane Mile $23,600 $21,300 $21,300 Upgraded Existing Lane Mile $900 $900 $900 Converted Facility Lane Mile $600 $1,300 $2,800 Total $52,200 $49,900 $51,400 It is of interest to summarize these data by whether the cost is incurred in converting an entire facility, or creating priced lanes (new or converted) in the median of a parallel general purpose road. The former will be referred to as a Converted Facility and the later as an Upgraded/New Facility. Converted Facilities, by the above definition, are as follows: o Scenario AP: I-66 inside the beltway, I-95/395 HOT Lanes (from the 14 th Street Bridge to Dumfries, VA) 12 o Scenario BP: Tolled existing DC facilities and bridges, as specified above. o Scenario CP: Tolled existing National Parkways, as specified above. 12 While the I-95/395 HOT Lanes project is planned to add one additional lane from what is currently on the ground, the baseline for this analysis (the 2006 CLRP) contains the widening of this HOV-only facility from 2 to 3 lanes. As such, the 3-lane HOT facility is strictly a conversion of a 3-lane reversible HOV facility to a HOT facility in this study. 32
39 All other lanes fall into the Upgraded/New Facilities category. The capital costs for the scenarios, broken out by the upgraded/new versus converted are presented in Table 6. Table 6: Capital costs for the variably priced scenarios, broken out by new or upgraded facilities versus converted facilities. AP BP CP Regional $52,234 $49,927 $51,414 Upgraded/New Facilities $51,606 $48,627 $48,627 Converted Facilities $628 $1,300 $2,787 As would be expected, Scenario AP has the highest costs. Scenario AP adds new lanes throughout the region in all three jurisdictions. The cost of Scenario BP is reduced due to the removal of the new infrastructure in the District, but then increased by additional costs of tolling existing DC facilities and bridges. This carries through into Scenario CP, which has some added costs due to tolling the existing lanes of the parkways. 4.3 Scenario Financial Feasibility Background It is frequently assumed that new toll infrastructure should be self-financing. That is, the revenue raised over a given period of time should pay the costs of construction, maintenance, and operation over the same timeframe. This assumption is especially relevant when a facility is to be operated by a private corporation, under a public-private partnership, as that private corporation will be earning profit after covering costs. Analysis of the three variably priced projects in the TPB s long range plan shows a variety of capital funding plans, resulting in a range of net-revenue results. The Intercounty Connector is not expected to be self-financing, while the VDOT I-95/395 HOT Lanes project is expected to generate revenue in excess of capital and maintenance costs. The Capital Beltway HOT Lanes project falls in between, with forecast revenues generally in line with planned capital and maintenance costs for the HOT lane facility Methodology This financial feasibility analysis uses the Capital Beltway project as a template, as it generally satisfies the self-financing assumption. After close analysis of the cost and revenue figures presented as part of the long range plan financial analysis 13, it was determined that the annual revenues were expected to be approximately 5% of the project s capital costs. This analysis uses this same ratio as an indicator of financial feasibility: 20 years of revenue divided by the capital costs. When this ratio is greater than one, revenues more than cover costs. All revenue projections are based on demand in 2030, which is used as a representative average demand across the analysis timeframe. It can reasonably be assumed that financing (public or private) must be arranged to fund the construction, and these financing arrangements will require regular payments. 13 Table A.7. Cambridge Systematics Report Analysis of Resources for the 2006 Financially Constrained Long-Range Transportation Plan for the Washington Region, Appendix A, Page 9, September
40 Institutions financing highway construction will require a competitive return on investment. For the Capital Beltway project, where 5% of the project s capital costs are expected to be earned annually as toll revenue, 4% is dedicated to debt service and the remaining one percent is dedicated to administration, operations and maintenance, and return on investment. Actual financial viability for individual projects will depend on a variety of factors, such as project financing, implementation timeframe, construction efficiency and actual versus projected demand Analysis Annual revenues from the value priced scenarios, rounded to the nearest 100-million, are presented in Table 7, which also presents the figures broken out by upgraded/new facilities versus converted facilities. Table 7: Annual revenues, in millions, 2010$ based on 2030 demand. AP BP CP Regional $1,500 $2,100 $2,800 Upgraded/New Facilities $1,100 $1,200 $1,100 Converted Facilities $400 $900 $1,700 As discussed above, 20-year revenues greater than or equal to scenario costs is the criterion for financial feasibility. Table 8 displays the 20-year revenues. Dividing the scenario capital costs presented in Table 6 by these values results in the percentages displayed in Table 9. Scenarios where 20-year revenues are at least 100% of capital costs are considered feasible in this analysis. Table 8: 20-year revenues, in millions, 2010$ based on 2030 demand. AP BP CP Regional $30,300 $41,700 $56,300 Upgraded/New Facilities $22,200 $23,100 $23,000 Converted Facilities $8,100 $18,500 $33,400 Table 9: Percentage of scenario capital costs covered by 20-year revenues. AP BP CP Regional 58% 83% 110% Upgraded/New Facilities 43% 48% 47% Converted Facilities 1300% 1430% 1200% According to this assessment, only the CP network will earn enough revenues to cover its capital costs. As discussed earlier, CP is the prioritized network which tolls the parkways and many existing lanes in the District. This tolling of existing lanes is what makes this scenario financially feasible: these low-cost money-earning facilities can subsidize other more expensive corridors with miles of newly constructed lanes. It is not surprising that the converted facilities greatly exceed our feasibility criterion, whereas upgraded/new facilities fall short by about 50%. 34

41 4.4 Impact of Transit on Performance of the Scenarios Managed lanes such as the variably priced lanes under study here can provide benefit to transit vehicles as well as private vehicles. Because the tolls will, in theory, keep the priced lanes free of congestion, the VPLs can act as dedicated running ways for transit vehicles, decreasing travel times and increasing reliability. This study added enhanced transit services which run on the priced lanes in each of the three scenarios, and then analyzed the performance of the enhanced transit systems and the impacts of enhanced transit on the performance of the network of priced lanes Methodology The viability of transit on the variably priced lanes was assessed by creating enhanced transit routes and services that operate on the priced lanes. Once these enhanced transit networks were coded, the travel demand model was rerun on the new transit-enhanced scenarios, and the model outputs were evaluated. Measures of effectiveness, similar to those used with the previous scenarios, were applied to the scenarios to determine the demand for transit and its impact on the value priced lanes Increased Transit Availability Enhanced transit services were applied to the three prioritized scenarios, as described in section 3.4 above. The increases in transit service are displayed here as increases in transit availability, a new technique employed by TPB staff for visualizing changes in transit service. This technique may be described as follows: There are over 1000 bus routes coded in the TPB travel demand model for It is impossible to create an understandable regional bus transit visualization using standard bus transit mapping techniques. TPB staff has been working to develop new methods of visualizing bus transit service on a regional level: a new technique to map regional transit service. This measure, currently referred to as transit availability, uses a 2- dimensional density function to Figure 20: Increases in Bus Transit Availability due to the Enhanced Transit Services included in the Regional Value Pricing Scenario evaluation of Scenario BPT. calculate the amount of transit service (based on headways at bus stops) available within a radius of a given location. Figure 20 displays a map of the increases in transit availability between the BP and BPT scenarios. The darker blue areas on the map indicate where large of increases in transit 35
42 service would be expected from the implementation of the enhanced transit network. The green areas show moderate increases in transit service, and the transit availability of the grey areas is unaffected by the enhanced transit network. The figure illustrates that much of the increased transit service availability is located in areas near the proposed Value Priced Network. However, it is interesting to note that there are many areas of increased transit service that are quite distant from the new variably priced lanes upon which the transit buses are expected to run. For example, transit service availability is expected to increase in areas of Charles and Calvert counties in Southern Maryland though the variably priced network does not extend into those jurisdictions. This is due to the fact that buses which serve areas far from the variably priced network can benefit from the variably priced lanes for a portion of their routes Assessing the Impact of Enhanced Transit To assess the impact of the enhanced bus transit network on the variably priced lanes, the proposed enhanced transit networks were coded into the scenarios APT, BPT and CPT, as described in section 3.4 above. The model was then run and the summary statistics and MOEs used to evaluate the earlier VPL network scenarios were evaluated and compared. All three transit scenarios showed similar impacts of adding enhanced transit, as shown in Table 10: increasing available transit services resulted in increases in transit use, and decreases in VMT, HOV use and total system revenue. Table 10: Change in measures of effectiveness between prioritized scenarios (AP, BP, and CP) and enhanced transit scenarios (APT, BPT, and CPT). APT BPT CPT Regional VMT -1.5% -1.6% -1.4% HOV Use -15% -6% -4% Transit Use 4.2% 4.4% 3.6% System Toll Revenue -14% -10% -7% These results reflect the fact that for commuter travel, transit and HOV are close substitutes. Additionally, improved transit service for the same travel corridor generally reduces both HOV and SOV use in that corridor. 4.5 Transit Cost Analysis As mentioned above, each of the scenarios has a transit component, with buses operating on the congestion-free variably priced lanes. The addition of this enhanced transit results in three new scenarios, APT, BPT and CPT. This section assesses the costs of providing the enhanced transit Methodology In the transit scenarios, some bus lines were enhanced and some new lines were added. The cost analysis assessed the cost all the transit in the base case (2006 CLRP) as well as 36
43 in the transit scenarios. Then the cost of the 2006 CLRP transit was subtracted from the transit costs of the scenarios, resulting in the additional cost of enhanced transit for each scenario. The calculation of the estimated costs was based on the bus transit inputs to the travel demand model: tables containing one row for each transit line, including its mode identification number, headway (frequency) and trip travel time. The ratio of trip travel time to headway provides an approximation of both the number of vehicles required and the number of revenue hours per hour of bus service for a given line. In order to calculate estimated transit costs, several assumptions were used: o The PM peak mirrors the AM peak (no unique schedule information for the PM peak periods) o Number of hours in a peak period (AM or PM): 4 o Number of work-days per year: 250 o Bus operating cost per hour: $ o Capital cost for one bus: $500,000 o Farebox Recovery Ratio: 40% o Deadhead time penalty, 80% of trip travel time For each bus line, the numbers of bus hours and needed buses were calculated. The first step in calculating these quantities was to determine the effective travel time. Many buses run only in the peak direction, while other buses run in both directions. For peakonly bus routes, extra time must be added to the trip time to account for the empty return (deadhead) trip. For this analysis, an 80% deadhead penalty is added to the run time to calculate the effective trip time. For bi-directional routes, no such penalty is needed as the buses return trips are accounted for by the schedules specified in the CLRP Analysis The number of bus hours for a route was calculated by dividing the effective trip time by the headway. This calculation results in the number of hours that buses serving that route/line will be operating during a given hour. This number (bus operating hours per hour) is then multiplied by the number of hours in the given period (AM peak versus offpeak) to determine the number of hours that buses will be operating per line. The number of buses needed to service a line is directly correlated with the number of bus operating hours per hour: the number of bus operating hours per hour provides a minimum for the number of buses required. Rounding this number up to the nearest whole number provides a good approximation for the number of buses required to service a given line. Once the number of bus operating hours and number of buses per line were calculated, these values were summed for the peak and non-peak periods and multiplied by the 14 Operating cost per hour, bus capital cost and farebox recovery ratio were based on recommendations from VDRPT s I-95/I-395 Transit/TDM Study Transit Cost and Funding Assumptions, 12/11/
44 number of hours in a day the schedules apply. The values of these attributes for the CLRP were then subtracted from those of the three transit scenarios to determine the cost factors for the new transit service for each of the scenarios. These values are presented in Table 11. Table 11: Cost factors for transit scenarios and current similar bus transit services. Figures for the variably priced scenarios are in addition to the base case 2006 CLRP. APT BPT CPT PRTC LC Transit Operating Hours 1,487,000 1,487,000 1,595, ,000 44,000 Fleet Size Annual Operating Hours Per Bus 1,941 1,941 1,933 2,034 1,833 Table 11 also displays data for two current transit services in the Washington region that operate a similar type of service to that proposed for the transit scenarios: Potomac and Rappahannock Transportation Commission (PRTC) and Loudoun County (LC Transit). The values of operating hours and fleet size were taken from the 2006 National Transit Database. The purpose of including these other services is to verify assumptions about the number of buses needed to service the new routes on the new variably priced lanes. As displayed in the table, each of the transit scenarios include approximately 1900 new annual operating hours per new bus. These ratios are in line with the actual figures from the PRTC and LC Transit, which have 2,034 and 1,833 annual operating hours per bus respectively. The annual operating costs were determined by multiplying the scenario operating hours by the cost per revenue hour. The capital cost was calculated by multiplying the fleet sizes in Table 11 above by the cost per bus. Finally, the revenues were calculated simply by applying a 40% farebox recovery ratio. The following tables display the summarized costs and revenues. Table 12 presents the annual transit operating costs and revenues. Table 13 presents those values over the 20- year analysis period. Table 12: Annual transit operating costs and revenues, in millions, 2010$ APT BPT CPT Annual Transit Operating Cost $ 149 $ 149 $ 160 Annualized Transit Capital Cost $ 32 $ 32 $ 34 Annual Farebox Revenue $ 41 $ 41 $ 44 Table 13: 20-year costs and revenues for the transit scenarios, in millions, 2010$ APT BPT CPT 20-year Transit Costs $ 3,600 $ 3,600 $ 3, year Transit Revenue $ 820 $ 820 $ 880 In Table 14, the transit costs above are added to the costs of the transportation infrastructure for the given scenarios. As the table shows, even the excess revenue generated in Scenario CPT is not enough to fully cover facility capital costs and transit capital and operating costs. 38

45 Table 14: Comparison of costs and revenues of transit scenarios, in millions, 2010$ APT BPT CPT Total Capital Costs $ 55,800 $ 53,500 $ 55, Year Revenues $ 26,900 $ 38,200 $ 53,300 Cost Recovery Rate 48% 71% 96% 4.6 Evaluation of Potential Land Use Impacts The link between transportation and land use has been well documented. Generally, transportation improvements impact land use by changing accessibility: these improvements open up land for development either by creating access to previously inaccessible land, or by increasing the number of people who can access a given area within a reasonable amount of time. One measure of accessibility, for example, is the number of jobs which can be reached within a certain time from any given location. Accessibility analysis provides a good starting point for assessing the land-use impacts of the variably priced network under study. Locations that experience an increase in accessibility to jobs are likely to also experience an increase in the number of households, as it is assumed that households will tend to locate where access to jobs is high. Conversely, locations that experience an increase in accessibility to households are likely to experience an increase in the number of jobs, as employers relocate to where their employees can access them. TPB staff has developed an accessibility analysis tool which uses transportation demand model outputs to determine the number of jobs and households which are accessible within 45 minutes for each transportation analysis zone (TAZ). This accessibility analysis tool is Figure 21: Sample map from the accessibility analysis of the 2006 CLRP. This map shows the change in accessibility to jobs by auto between 2006 and used regularly to assess the impacts of the TPB s Constrained Long-Range Transportation Plan (CLRP). Maps illustrate the change in accessibility between a base year and the plan year; an example map from the accessibility analysis of the 2006 CLRP is presented in Figure
46 The accessibility analysis is also used to determine the impacts of the CLRP on traditionally transportation-disadvantaged populations. Changes in accessibility are divided up between the different populations to determine whether any particular group is disproportionately benefited or burdened by the changes in accessibility resulting from the CLRP. Accessibility is surely not the only factor that influences job and housing location choices. In this study, however, accessibility is the significant factor that is changing between scenarios. Therefore, it is reasonable to consider that the locations of jobs and houses may shift based on the changes in the relative accessibility of locations around the region. The accessibility resulting from the analysis is influenced by the existence of tolls on the variably priced network. The average income of each TAZ is incorporated into the accessibility analysis through the travel demand modeling process. This is described in section Methodology The accessibility analysis technique described above was use to evaluate the potential land use impacts of the priced scenarios. This assessment can provide some insight as to where new development could take place under the scenarios under study. 1. The TPB accessibility analysis tool is run on the transportation demand model outputs for the 2006 CLRP and the Regional Value Priced Network scenarios, APT, BPT and CPT, assessing accessibility to jobs and households by highways and transit. 2. The accessibility outputs from each scenario are compared to the base 2006 CLRP outputs. a. Summary statistics of the average change in accessibility due to the regional value priced network were calculated. 3. Changes in accessibility are mapped using the symbology and break-points used in past CLRP analyses. a. Shades of green represent increased accessibility, shades of red represent decreased accessibility. b. Regional activity centers were superimposed on these maps for comparison. c. These maps indicate areas with increased accessibility to jobs and households by highway and transit due to the introduction of the regional variably priced network. d. The areas where accessibility has changed will be the areas most likely to experience land-use changes Change in Accessibility to Jobs Very few zones experienced significant changes in accessibility to jobs by highways. Zones that experienced increases in the three scenarios were located mostly in Loudoun, Fairfax and Montgomery counties. Zones with losses in accessibility to jobs were found in the regional core: the District east of the Anacostia River, Alexandria and Arlington. 40
47 It is likely that the high bridge tolls result in losses of accessibility to jobs in the District s central business district. The change in accessibility to jobs by transit was positive in all three scenarios: each of the scenarios added to the existing transit network, so no decreases in accessibility by transit would be expected. Zones showing increases in accessibility to jobs by transit were located in and around the Beltway, with additional zones located near other major radial and circumferential corridors. These results suggest that a value priced network will have a moderate impact on the location of households in the region, and that those impacts are spread relatively evenly across the region. Maps illustrating the changes in accessibility to jobs by highways and transit for Scenario CPT are presented in Figure 22 and Figure 23 respectively. Maps of APT and BPT are presented in Chapter 8, Supplementary Maps and Figures. Figure 22: Change in accessibility to jobs by highway, 2006 CLRP versus Scenario CPT for Figure 23: Change in accessibility to jobs by transit, 2006 CLRP versus Scenario CPT for Change in Accessibility to Households The change in accessibility to households by highways, which is believed to influence where employers site jobs, was minimally impacted by the pricing scenarios. Scenario APT showed increases in accessibility to households by highways, which were reduced across Scenarios BPT and CPT: as more existing lanes were tolled in the subsequent scenarios, fewer households were accessible within 45 minutes. The only loss in accessibility to households by highways was seen near Mount Vernon, Virginia, near the southern terminus of the George Washington Memorial Parkway. As with access to jobs via transit, the accessibility to households by transit showed no decreases. The increases in accessibility to households were distributed fairly evenly 41
48 across the region, with larger concentrations near the major intersections of the VPL network, particularly around the Capital Beltway. These results suggest that the locations of jobs in the region would not likely be significantly influenced by the impacts of the toll network. Maps illustrating the changes in accessibility to households by highways and transit for Scenario CPT are presented in Figure 24 and Figure 25 respectively. Maps of APT and BPT are presented in Chapter 8, Supplementary Maps and Figures. Figure 24: Change in accessibility to households by highway, 2006 CLRP versus Scenario CPT for Figure 25: Change in accessibility to households by transit, 2006 CLRP versus Scenario CPT for Next Steps in Development of Land Use for the Value Pricing Scenarios The TPB s Regional Mobility and Accessibility Scenario Study includes five scenarios which are comprised of packages of transportation and land-use changes. If the regional variable pricing scenarios are to be considered as part of the scenario study, the land-use portion of the scenario should be further developed. A new land use forecast could be based on the results of the accessibility analysis above: the 2030 forecasts would be adjusted so that jobs are shifted to zones more accessible to households, and households are shifted to zones more accessible to jobs. This would be performed using a documented and justifiable rationale for shifting existing and projected jobs and households to areas of greater accessibility. This exercise may be performed with the assistance of the region s planning directors and the TPB Scenario Study Task Force Summary of Accessibility Changes In summary, the priced lanes scenarios evaluated in this study would appear to have limited impact on the location of households and jobs. Tolling of existing lanes in the 42
49 District and the DC river crossings appears to have a negative impact on accessibility to jobs by highways in Alexandria, Arlington and Anacostia. A new set of land use forecasts based on these changes in accessibility could be developed. This scenario would incorporate the changes in accessibility reported above, and shift some households and jobs to areas with increased accessibility. 4.7 Connectivity to the Regional Core and Activity Centers Methodology The connectivity to the regional core and activity centers can also be assessed through changes in accessibility: greater accessibility translates to greater connectivity. The accessibility analysis performed to evaluate potential land use impacts can be used to determine changes in connectivity to the regional core and activity centers. The changes in accessibility are assigned to individual traffic analysis zones (TAZs). These zones can be categorized as falling within one of three categories: Core Clusters: activity clusters within the regional core Non-Core Clusters: activity clusters outside of the regional core Non-Cluster: areas outside of activity clusters The accessibility of the categorized TAZs can be grouped and summarized based on the above categories, resulting in a measurement of the impact of the variably priced lanes scenarios on connectivity to the regional core and activity centers Accessibility to Jobs The change in accessibility to jobs by highway categorized by activity cluster across the three scenarios is displayed in Figure 26. In all scenarios, the core activity clusters have the smallest gain in accessibility to jobs, and in Scenario CPT, they lose accessibility. In Scenario APT, the non-core activity clusters and the non-cluster zones both experience the same percentage gain, while in Scenarios BPT and CPT the non-core clusters have a greater percentage increase than the non-cluster areas. The chart in Figure 27 shows the absolute change in accessibility to jobs by highways for the region s activity clusters for scenario CPT as well as the percentage change. It can be seen that the core clusters maintain the highest accessibility to jobs despite the small decrease, while the non-core activity clusters have the largest percentage increase Accessibility to Households The change in accessibility to households by highway categorized by activity cluster across the three scenarios is displayed in Figure 28. Unlike access to jobs, access to households has its greatest percentage increase in Scenario APT for the core clusters. Otherwise, access to households shows a similar pattern as access to jobs: non-core activity clusters show the greatest percentage increase in accessibility to households. 43
50 It can be seen in the chart in Figure 29 that for Scenario CPT the core clusters experience a small decrease but remain areas of the greatest accessibility to households Assessment The value priced lanes scenarios increase accessibility to jobs and households by highway in both the activity clusters and non-cluster zones. However, the core clusters lose access to jobs in Scenario CPT and access to households in Scenarios BP and CP. The scenarios appear to have a more significant impact on the accessibility to households than the accessibility to jobs. Accessibility to both households and jobs remains the highest in the core clusters. A complete set of charts for this analysis is presented in Chapter 8, Supplemental Maps and Figures. 14% 12% 12% 12% 10% 10% 8% 7.6% 7.6% 6% 4% 4.7% 4.6% 4.0% 3.9% 2.5% APT BPT CPT 2% 0% 0.7% Core Clusters Non-core Clusters Non-cluster Areas Regional Average -2% -4% -2.7% Figure 26: Percentage changes in accessibility to jobs by highway between the 2006 CLRP and the scenarios categorized by activity cluster or non-cluster zones. 44
51 2,500,000 2,000,000 1,500,000 1,000,000 CPT CLRP 500,000 8% 4% 3% - (500,000) -3% Core Clusters Non-Core Clusters Non-cluster Regional Average Figure 27: Scenario CPT absolute and percentage changes in accessibility to jobs by highways for activity clusters. 14% 12% 12% 10% 8.6% 8.7% 9.3% 8% 6% 4% 5.5% 4.5% 3.8% 3.5% 2.6% 2.5% APT BPT CPT 2% 0% -2% -0.1%-0.3% Core Clusters Non-core Clusters Non-cluster Areas Regional Average -4% Figure 28: Percentage changes in accessibility to households by highway between the 2006 CLRP and the VPL scenarios categorized by activity cluster or non-cluster zones. 45
52 1,200,000 1,000, , , ,000 4% 3% 3% CPT CLRP 200,000 0% - (200,000) Core Clusters Non-Core Clusters Non-cluster Regional Average Figure 29: Scenario CPT absolute and percentage changes in accessibility to households by highways for activity clusters. 46
53 5 Impacts of Pricing Scenarios on Different Populations TPB staff includes in its regular analysis of the CLRP an assessment on the impacts of the plan on different population groups. This analysis also makes use of the accessibility analysis used for the land use and activity cluster analyses of this study. 5.1 Methodology As described above, the accessibility analysis technique evaluates how many jobs and/or households are accessible from any given traffic analysis zone (TAZ). The Census Transportation Planning Package (CTPP) also provides demographic data at the TAZ level. Combining these two data sets, the change in accessibility in each TAZ can be linked to the number of residents in each zone of the population groups of interest. From this, the average impact across the region on the different population groups can be estimated. It should be noted that the latest version of the CTPP is based on the results of the 2000 Census. No attempt is made to forecast demographic shifts around the region for In addition to the accessibility changes for the general population, analyses of the CLRP evaluate the impacts on the following census demographic categories: African American Asian Hispanic/Latino Low-income Disabled The analysis results in the number and percentage of people from each population group who experience changes in accessibility, broken down into three categories: moderate to significant loss, minimal impact, and moderate to significant gain. 5.2 Analysis Summary The analysis was performed for all three scenarios: APT, BPT and CPT. With regards to highways, Scenario APT had no losses in accessibility, so no population group experienced losses. The pattern of losses and gains for Scenarios BPT and CPT were very similar, with no one population group receiving a large share of the benefit and no one population group shouldering a disproportionate share of the losses. A chart illustrating the gains and losses in accessibility to jobs by highways across population groups in Scenario CPT is presented in Figure 30. With respect to transit, since transit service was added between the base case and the scenarios, only gains in accessibility were noted. A chart illustrating the distribution of gains in accessibility to jobs by transit for Scenario CPT is presented in Figure 31. Charts illustrating the analysis for Scenarios APT and BPT are presented in Chapter 8, Supplemental Maps and Figures. 47
54 Change in Accessibility to Jobs by Highw ays Scenario CPT General Population 7.6% 80.3% 12.1% African American Asian Hispanic/Latino Low -Income 7.5% 6.9% 13.0% 11.6% 83.6% 77.9% 70.8% 76.8% 8.9% 15.2% 16.2% 11.6% Moderate Loss Minimal Impact Moderate Gain Disabled 8.9% 80.0% 11.2% 0% 20% 40% 60% 80% 100% Figure 30: Demographic assessment of the change in accessibility to jobs by highways of Scenario CPT. Change in Accessibility to Jobs by Transit Scenario CPT General Population 80.8% 19.2% African American 74.5% 25.5% Asian 77.0% 23.0% Minimal Impact Hispanic/Latino Low -Income 82.4% 77.0% 17.6% 23.0% Moderate Gain Disabled 79.5% 20.5% 0% 20% 40% 60% 80% 100% Figure 31: Demographc assessment of the change in accessibility to jobs by transit of Scenario CPT. 48
55 5.3 Assessing the Impact of Tolling Existing Lanes The analysis above provides one way to examine the impact of the variably priced lanes scenarios on minority, low-income and disabled population groups. Evaluating the impacts on low-income and minority populations of the scenarios provides an initial look at the impact of tolling existing lanes. However, a more focused discussion of the potential impacts of tolling existing highway lanes is required. This study has been evaluating a network of variably priced lanes. The cost of travel on these lanes adjusts according to demand: the tolls increase in order to prevent congestion on the lanes, providing free flow traffic conditions for those willing to pay the toll. The economic rationale for value pricing is that roads operate most efficiently when the volume of traffic on a road stays below its design capacity. In economics, the concept of value-pricing is referred to as efficiency tolls. The economic rationale of efficiency tolls is not under dispute. The community-wide impacts of such tolls can be complex, however, as described in a classic paper, The Basic Theory of Efficiency Tolls: The Tolled, The Tolled-Off and the Un-Tolled, published in 1964, by Richard M. Zettel and Richard R. Carll. 15 Zettel and Carll frame the assessment of pricing strategies as follows: The economic question concerning the wisdom of this course can be phrased in the same way as for highway expansion: Would the benefits of traffic restriction be greater than the costs created? The benefits at issue are similar to those occurring from highway expansion: by reducing traffic flow, savings in travel time, accidents, operating costs, etc., are provided for those who continue to use the highway. However, the costs to be compared with the benefits are altogether different. Instead of prices of land and other resources needed to provide highways, the cost arising from traffic restriction is the loss to users who must be prevented or induced not to use a congested road. The amount of the loss depends on what alternatives are available to those who are diverted. They note that the tolling of existing lanes creates three types of travelers: The Tolled, drivers using the newly tolled road who are willing to pay the toll: What would be the attitude of the tolled? Does one know that these users, as individuals, are actually better off than they were before the toll? Would they rather have suffered the congestion (and time losses), and saved the toll? The fact that they are willing to pay the toll gives no answer. 15 Zettel, R., and R. Carll The Basic Theory of Efficiency Tolls: The Tolled, the Tolled Off, and the Un-Tolled. In Highway Research Record 47, HRB, National Research Council, Washington, D.C. 49
56 50 The Tolled-Off, Former users of the newly tolled road, who have switched routes, modes or times for their trip, or are no longer making their trip altogether: It must be noted that the tolled-off user prefers the facility with congestion to any alternative he selects. The toll has motivated him to use a less desirable alternative and to incur a loss. Although it might be concluded that the loss cannot be larger than the amount of the toll payment (otherwise the user would pay and not be diverted), the main question is whether the loss is less than, or exceeds, the benefits of decongestion. The Un-Tolled, Drivers who do not use the road in question but are impacted by the drivers diverted by the tolls: Consideration might be given to the impact on still another group those who are already using the alternatives to which some of the former users of the toll facility shift Tracking the impacts of tolling existing lanes on these three types of travelers, and ensuring that the general welfare is promoted, is according to Zettel and Carll, challenging from an intellectual as well as a practical viewpoint: At this point, one suffers mental indigestion trying to picture the tolled, the tolled-off, and the untolled, the users and the nonusers, bouncing around among the alternatives, all the while a blinking giant of a computer is fixing and refixing tolls, shadowing users, and redistributing income to promote the general welfare through the optimal arrangement, not only of travel but also of nontravel. Zettel and Carll argue that one must consider the possibility that imposing tolls on existing roadways may have a net social cost: the benefits to the tolled and society in general could be outweighed by potential social disbenefit caused by tolls prompting a broad restructuring of travel, work and living patterns: On the basis of social cost theory, there is no conviction that the results of vehicle rationing through tolls would be beneficial on balance. Benefit redistribution may be a possible way to reach a Pareto improvement (an improvement where some gain benefit and no one is worse off than before). However, the many groups of users who have the potential of being negatively impacted would be diverse, spread-out and potentially unidentifiable. It is likely impossible to ensure that each impacted individual is compensated for negative impacts of the efficiency tolling scheme. To summarize, the tolling of existing lanes produces a very complicated chain reaction of effects. Understandably, such tolling schemes provide the opportunity for very challenging and complex problems to arise, problems that can impact the quality of life
57 of many or even a majority of a region s individuals. This is not to suggest that efficiency tolling should be avoided. Instead, its benefits and burdens should be analyzed and understood. And innovative ways to redistribute benefits should be investigated before such tolling schemes are put in place. Zettel and Carll summarize their extensive analysis of the benefits and costs of tolling existing roadway lanes as follows: It is not denied that worthy reasons may be found to support attempts at restriction or redirection of motor vehicle use in some urban areas. Pricing might be one of the better tools to accomplish this. But the rationale of a rationing policy should be drawn up in broad planning terms, involving community amenities and esthetics, rather than in the narrow context of social costs which users impose on each other. This requires a balancing of the total consequences of rationing, the adverse as well as the beneficial, not only as they affect users but also as they affect the community-at-large. 51
58 6 Topics for Further Consideration 6.1 What Scenarios Could be Assessed in Future Studies? CAC Recommendation of evaluating a scenario that focuses mainly on converting existing lanes to VPLs In February, 2007, the TPB Citizens Advisory Committee presented to the TPB a list of recommendations on the scenario study, including this recommendation on the variably priced lanes scenario: Currently, the extensive toll lane scenario under analysis mainly looks at new roads or widening existing roads. The committee would be interested in a scenario that focuses mainly on converting existing lanes to variably priced lanes to boost their productivity during peak hours and support high efficiency express bus, rapid bus transit, and other transit services. One approach could emphasize enhanced transit utilizing the variably priced lanes. Another could integrate variably priced lanes into an existing scenario that emphasizes transit, including increased rail transit. The scenarios could be refined by including limited additional road capacity increases in the segments of the system where tolls would have to be set very high to keep traffic operating efficiently even with improved transit services. Scenario A in this study tolls existing HOV facilities in the regional network, including the single-lane HOV segments as well as the entirety of I-66 from the Capital Beltway to the Roosevelt Bridge. All other VPLs in Scenario A are newly added lane miles. Scenario B includes removing VPLs in the District from Scenario A and tolls the following existing facilities: All District river crossings I-395 in the District I-295/Anacostia Freeway I-66 from the Beltway to its terminus in DC New York Avenue from the District line to I-395 at 4 th St NW Portions of the Rock Creek and Potomac Parkway, Independence Ave. SW and Maine Ave. SW Some 43 percent of the VPLs in Scenario B are existing as opposed to newly added lane miles. Scenario C takes Scenario B and adds tolls on all of the parkways in the region: The Baltimore Washington Parkway (MD-295) The George Washington Memorial Parkway The Rock Creek and Potomac Parkway The Clara Barton Parkway The Suitland Parkway Some 56 percent of the VPLs in Scenario C are existing as opposed to newly added lane miles. 52
59 As demonstrated in Section 4.3 on the feasibility assessment of the scenarios in this study, tolling existing lanes can generate significant revenues that could cover the costs to construct and operate VPLs and provide new funding for transit service enhancements. However, the high cost of building new interchanges and new lane miles for newly added VPLs mean that revenues are likely to exceed costs only on segments with favorable demand, toll levels and construction costs. Future work activities should build on this study s findings and assess the impacts of tolling more existing lanes. This potential new work activity could be presented to the new TPB Scenario Study Task Force and performed in the next phase of the TPB scenario study Evaluating Bus Rapid Transit (BRT) in the Scenarios This study evaluates the impact of adding enhanced transit to the VPL networks in the Scenarios. Transit was enhanced by increasing levels of service of existing or planned bus lines that could make use of the VPLs. Existing and planned routes were enhanced by increasing the frequency of service and reducing the route running time. Additionally, some new express bus routes were created to operate on segments of the VPL network without current transit service. This approach allowed for an assessment of improved transit without the extensive network coding and analysis required to model new transit routes. However, these enhanced services do not necessarily represent the higher service levels that might be obtained with bus rapid transit (BRT). And since the studied transit network is mostly comprised of existing or planned bus lines, no new radial (suburban to suburban) transit network links were included in the scenarios. Designing and coding an expanded network of high-quality BRT service could be performed under new work activities in the TPB Scenario Study Trucks Should Be Considered In Future Studies Freight movement is very important for the region, and the impacts of trucks should be addressed in future studies that evaluate adding new capacity to the region s roadway network. This study assumes that no trucks are permitted on any of the newly-added VPLs. The ICC, as defined in the 2006 CLRP, will accommodate trucks and other freight vehicles. Under Scenarios B and C, the tolled existing capacity within the District will permit freight vehicles on any facilities where they are currently permitted. Because trucks would not be permitted on newly added lanes of the VPL networks, however, these VPL networks will not provide a basis for the two-tiered system of roadways envisioned by some pricing advocates: What would eventually emerge over the next two to three decades is a two-tiered system of metropolitan and intercity roadways. Supplementing existing toll-free highways would be networks of premium service facilities offering congestion-free travel for a fee. As toll-free highways become saturated with traffic, individual motorists, shippers and truckfleet operators would switch to the free-flowing priced facilities in 53
60 sufficient numbers to ensure their political legitimacy and financial viability What Considerations Affect the Inclusion of VPLs in a Regional Network? Inclusion of the Parkways in the Regional Network There are several issues related to inclusion of parkways in the regional network of priced facilities. First, the National Park Service is concerned about visual obstructions caused by gantries or other hardware required to implement and enforce tolling on parkways. Second, the geometries of the parkways and overpasses need to be examined in detail to identify potential safety issues and determine potential problems for buses since the roadways and bridges were not designed to accommodate heavy vehicles. The current barrier walls are already a problem for larger vehicles such as SUVs and may be inadequate, if there is an accident, to prevent buses from leaving the roadway Right-of-way Availability for the New VPLs This study assumed that right-of-way to construct the new variably priced lanes in each of the scenarios is available. However, it is known that right-of-way (ROW) is not available on some segments, including US-50 in Maryland between the Capital Beltway and the District border, and portions of the Capital Beltway in Maryland between US-50 and the American Legion Bridge. The availability of ROW and the cost for obtaining additional ROW will influence where new VPLs in a regional network can be considered. There are construction methods for entrenched or elevated roadways that could be considered to implement the VPLs for some of the segments in future scenarios. However, these engineering solutions, while technically feasible, will be more costly and could raise appearance and aesthetic issues How will Chokepoints Affect VPL Network Performance? This analysis has identified two types of chokepoints in the variably priced network.. First, the convergence of many different toll lanes can result in a merge bottleneck. For example, in the studied network, traffic from 7 VPLs can converge at the Springfield intersection, all attempting to head south on the three I-95 VPLs, possibly requiring significantly higher tolls to prevent backups on the toll lanes on the Beltway and I-395. Second, high-demand access and egress points may result in bottlenecks getting in and out of the value priced network. For example, the street network in Tysons Corner will need to handle all of the vehicles wishing to exit the toll lanes so that congested traffic does not back up onto the VPL network. Three potential solutions could be investigated in future work: Increase capacity through chokepoints Toll chokepoints, including previously toll-free ramps 16 Orski, Kenneth, Addressing the Transportation Challenges of the 21 st Century, Innovation Briefs, November/December
61 Transit-only lanes through chokepoints How Could the VPL Facilities be Phased for a Regional Network? One method to determine which facilities in the scenarios could be implemented first would be to drill-down into the three regional scenarios that have been analyzed to identify segments that appear to have the most favorable benefit/cost ratios. The results of this study suggest that segments which do not require expensive new construction might be the most promising in this regard. Existing HOV facilities that could be converted at relatively low cost to high-occupancy toll (HOT) lanes might offer near-term opportunities to improve roadway management and enforcement as well as to use some toll revenues to expand transit services. In some locations, the benefits of VPLs might be large enough to justify the construction of new capacity, particularly where right-of-way is available and where few expensive new interchanges need to be constructed. The most congested locations identified in the TPB s freeway monitoring program as well as the toll levels estimated by segment and time of day in this study should suggest some promising locations for potential new capacity. Two of the three scenarios analyzed in this study include the application of variable pricing to a substantial number of segments of existing general purpose lanes. As might be expected, in addition to improved traffic management and travel reliability, these applications would generally have highly favorable financial results, generating revenues well in excess of costs and providing opportunities for significant investments in expanded transit services. However, these applications call into play all of the considerations related to tolling existing lanes that are discussed in section 5.3 of this report. As pointed out by Zettel and Carll in their classic 1964 paper, the benefits of improved traffic management must be weighed against potential disbenefits for three distinct groups: the tolled (drivers using the newly tolled road who are willing to pay the toll); the tolled-off (former users of the newly tolled road who have switched routes, modes or times for their trip, or are no longer making their trip altogether); and the untolled (drivers on other routes who are impacted by the drivers diverted by the tolls). Pursuing these applications of variable pricing to existing general purpose lanes will require, in the words of Zettel and Carll, a balancing of the total consequences of rationing, the adverse as well as the beneficial, not only as they affect users but also as they affect the community at large. A critical observation made by Zettel and Carll with regard to potential disbenefits is that the amount of loss depends on what alternatives are available to those who are diverted. The next phase of the TPB Scenario Study will provide an opportunity to identify a set of segments of these three VPL networks which could be advanced as high priorities for expanding the VPL network beyond the three facilities currently included in the region s Constrained Long Range Plan (CLRP). 6.3 Coordination with Current Corridor Studies in the Region There are currently several corridor studies underway or pending in the region, including the Southern Mobility Study, the Western Mobility Study, the 14th Street Bridge EIS, and the I-66 Corridor Study. The Regional Value Pricing Study includes ideas and 55
62 analysis that could be relevant to these and other corridor studies that may be considering the inclusion of variably priced lanes. The results of this study should be considered in these on-going studies. 6.4 Public Education and Outreach Should be Conducted Extensive public outreach and education about the potential benefits and impacts of charging users to manage congestion will be necessary because there is limited experience with such charges in the Washington region. While there is some US experience with providing drivers the choice of paying a toll for a congestion-free trip, at this time there is no experience with tolling existing general purpose lanes. The experiences in Stockholm and London with tolling existing general purpose lanes, including specifically the impacts on those previously using the lanes, should be very valuable in public education efforts. 56
63 7 References Orski, Kenneth, Addressing the Transportation Challenges of the 21 st Century, Innovation Briefs, November/December 2007 Vickrey, William, Reaching an Economic Balance Between Mass Transit and Provision for Individual Automobile Traffic (1959), Logistics and Transportation Review, 1994 Vickrey, William, Statement to the Joint Committee on Washington, DC Metropolitan Problems (1959), Journal of Urban Economics 36, 42-65, 1994 Zettel, Richard M. and Carll, Richard R., The Basic Theory of Efficiency Tolls: The Tolled, the Tolled Off, and the Un-Tolled, Highway Research Record 47, National Research Council, Washington, DC,


64 8 Supplementary Maps and Figures 8.1 Scenario Development 58
65 59
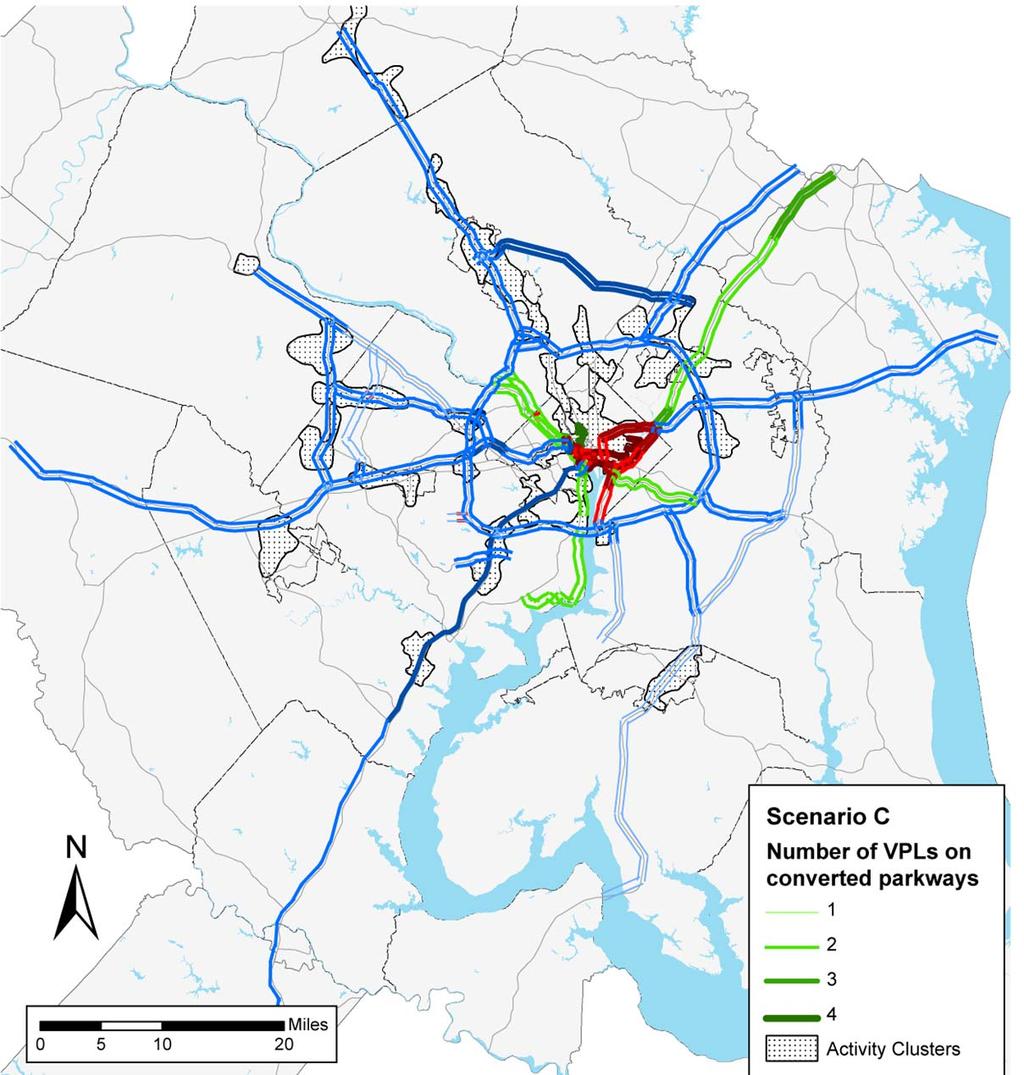
66 60
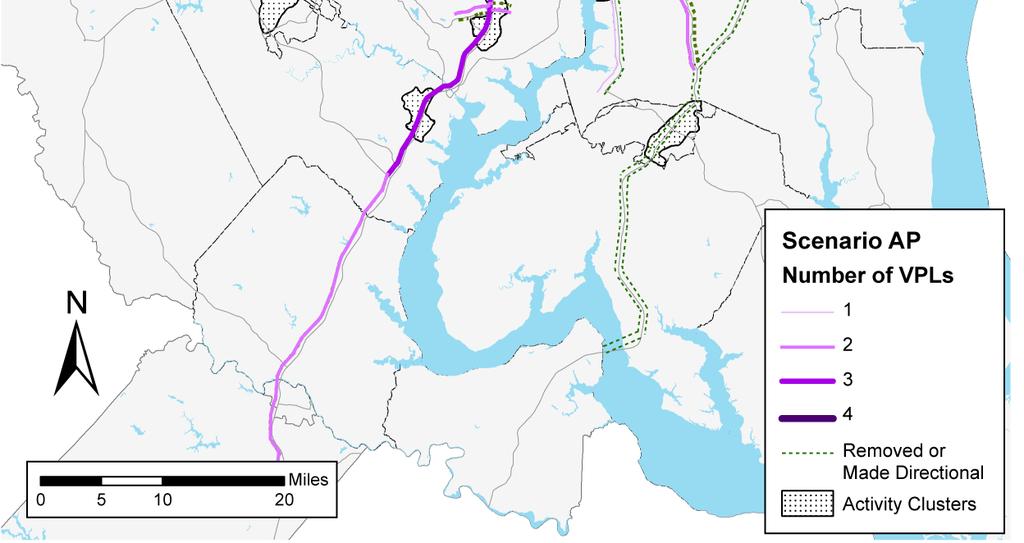
67 61
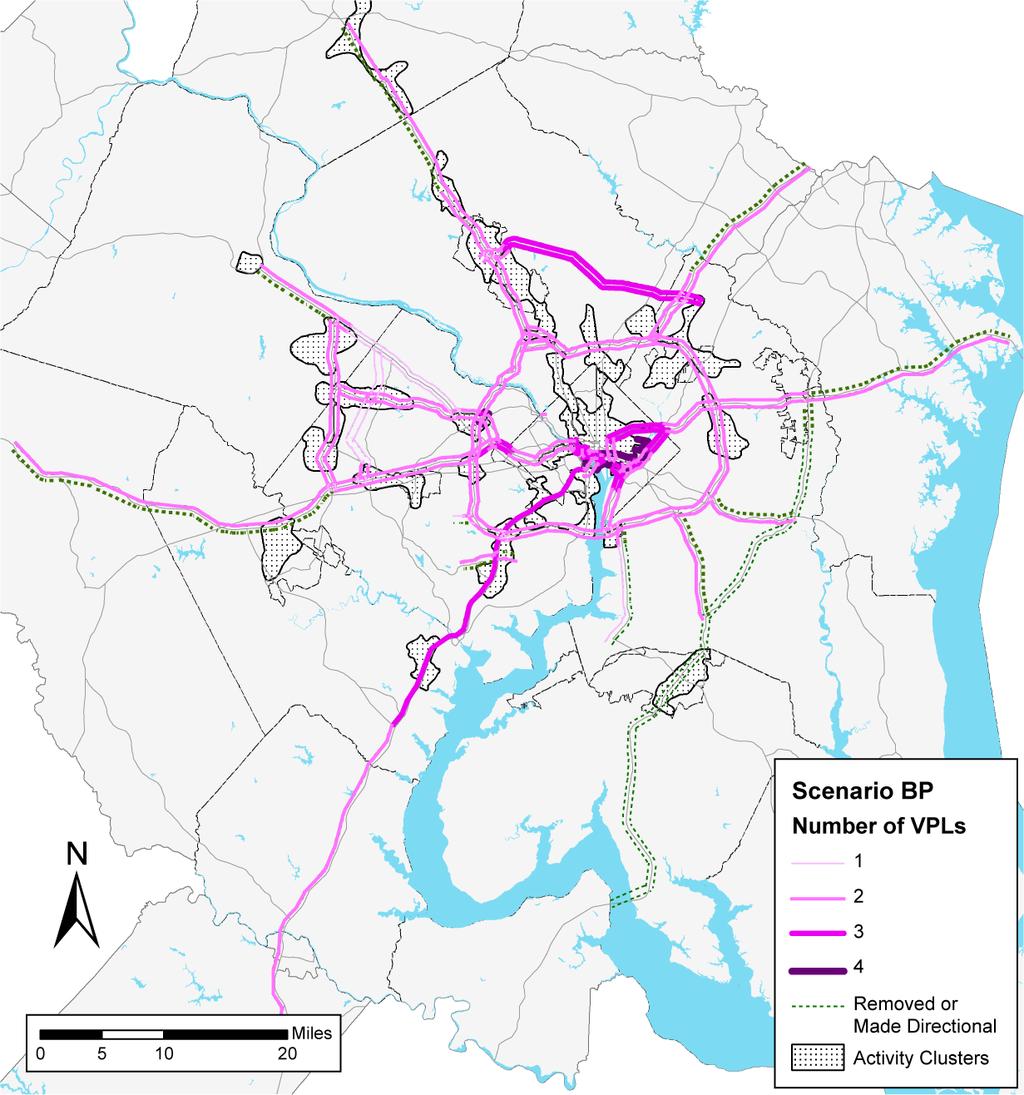
68 62
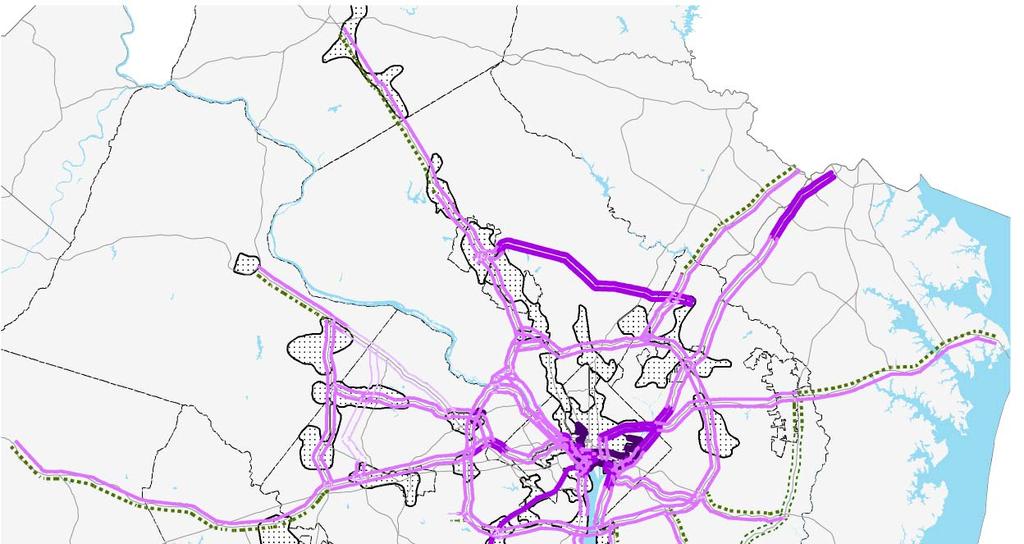
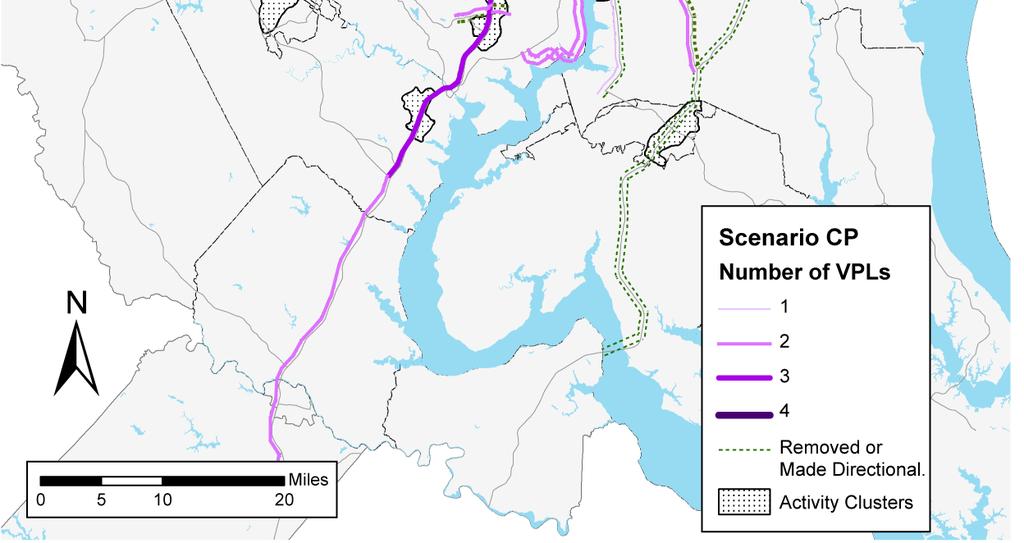
69 63
70 Scenario Analysis
71 65
72 66
73 67
74 68
75 69
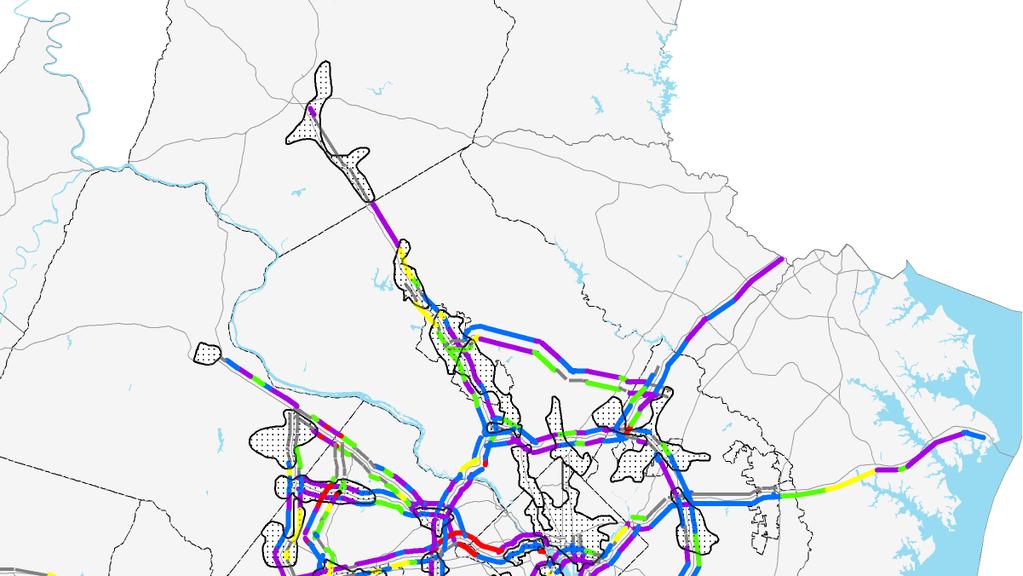
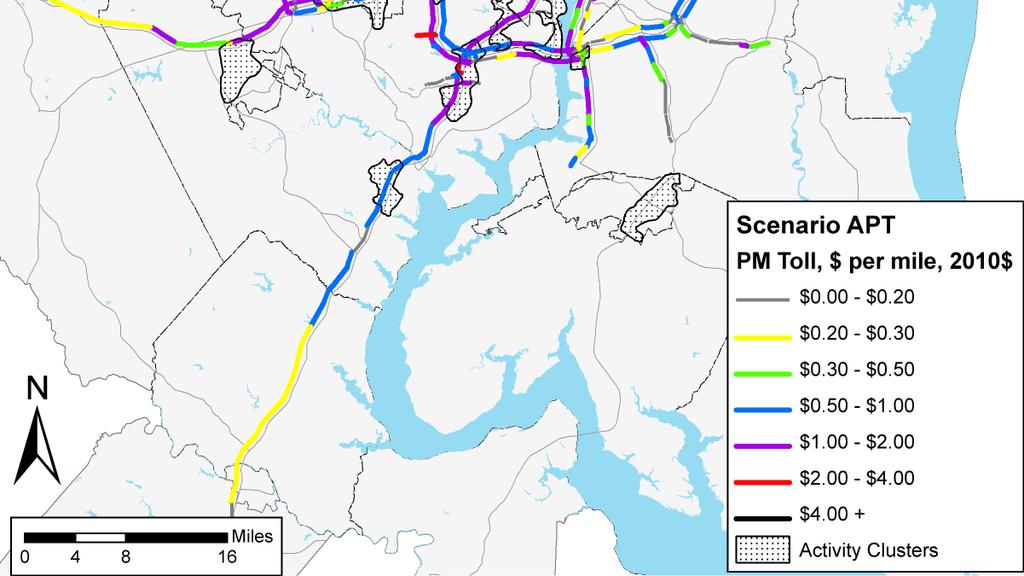
76 70
77 71
78 72

79 8.3 Land Use Impact Assessment 73
80 74
81 75
82 76
83 77
84 78
85 79
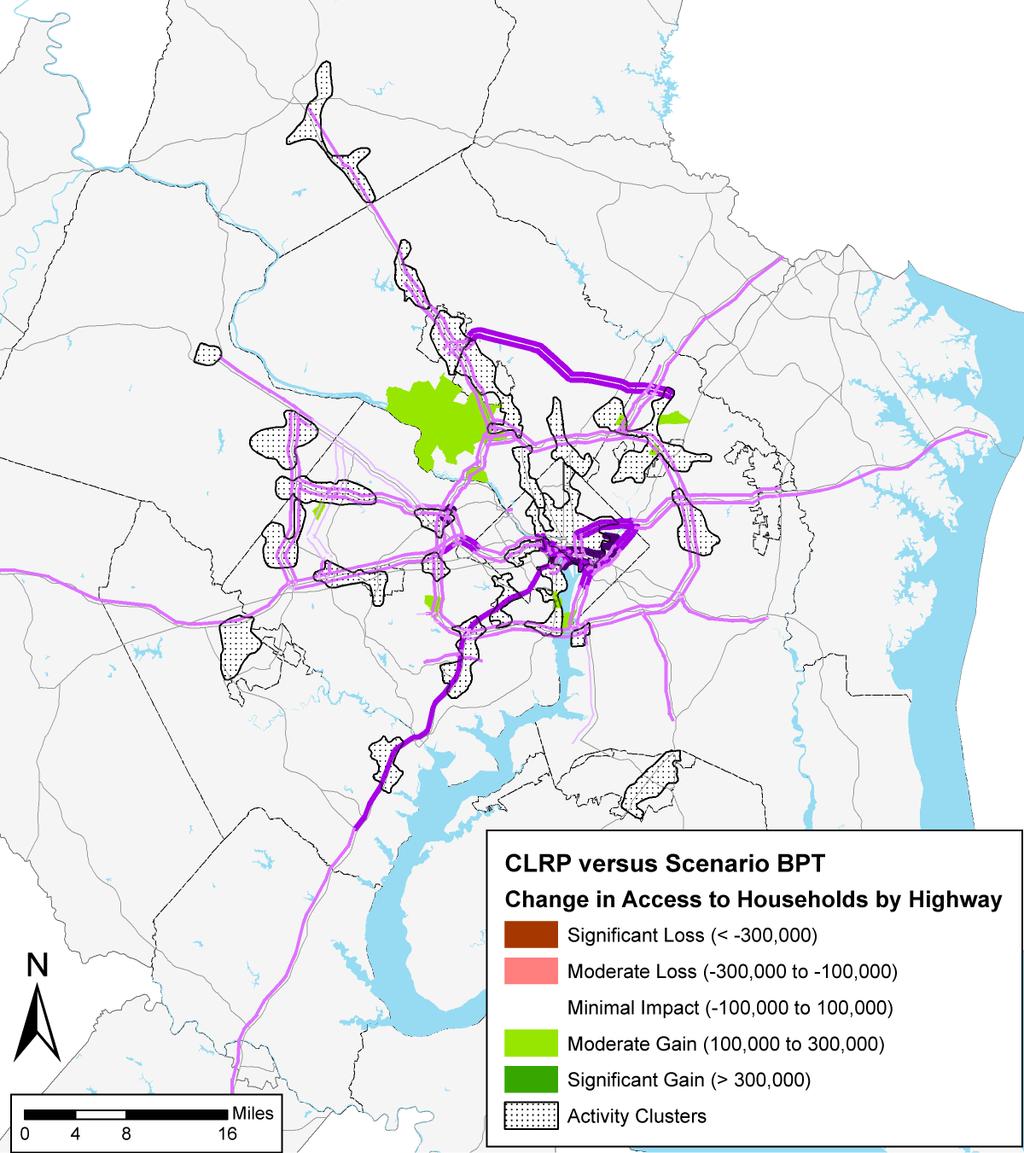
86 80
87 81
88 82
89 83
90 84
91 8.4 Regional Core and Activity Centers Analysis Scenario APT, Change in Accessibility to Jobs by Highways for Activity Clusters 2,500,000 2,000,000 5% 1,500,000 APT 1,000, ,000 12% 12% 10% CLRP - Core Clusters Non-Core Clusters Non-cluster Regional Average Scenario BPT, Change in Accessibility to Jobs by Highways for Activity Clusters 2,500,000 2,000,000 1% 1,500,000 1,000,000 BPT CLRP 500,000 8% 5% 4% - Core Clusters Non-Core Clusters Non-cluster Regional Average 85
92 Scenario CPT, Change in Accessibility to Jobs by Highways for Activity Clusters 2,500,000 2,000,000 1,500,000 1,000,000 CPT CLRP 500,000 8% 4% 3% - (500,000) -3% Core Clusters Non-Core Clusters Non-cluster Regional Average Change in Access to Jobs By Highways Across Scenarios 14% 12% 10% 8% 12% 12% 7.6% 7.6% 10% 6% 4% 4.7% 4.6% 4.0% 3.9% 2.5% APT BPT CPT 2% 0.7% 0% -2% -4% Core Clusters Non-core Clusters Non-cluster Areas Regional Average -2.7% 86
93 Scenario APT, Change in Accessibility to Households by Highways for Activity Clusters 1,200,000 1,000, , ,000 12% 9% 9% 9% APT CLRP 400, ,000 - Core Clusters Non-Core Clusters Non-cluster Regional Average Scenario BPT, Change in Accessibility to Households by Highways For Activity Clusters 1,200,000 1,000, , , ,000 5% 4% 4% BPT CLRP 200,000 - (200,000) 0% Core Clusters Non-Core Clusters Non-cluster Regional Average 87
94 Scenario CPT, Change in Accessibility to Households by Highways for Activity Clusters 1,200,000 1,000, , , ,000 4% 3% 3% CPT CLRP 200,000 - (200,000) 0% Core Clusters Non-Core Clusters Non-cluster Regional Average Change in Access to Households By Highways Across Scenarios 14% 12% 12% 10% 8% 8.6% 8.7% 9.3% 6% 4% 2% 0% -2% 5.5% 4.5% 3.8% 3.5% 2.6% 2.5% -0.1%-0.3% Core Clusters Non-core Clusters Non-cluster Areas Regional Average APT BPT CPT -4% 88
95 Scenario APT, Change in Accessibility to Jobs by Transit for Activity Clusters 2,500,000 2,000,000 1,500,000 1,000,000 3% APT CLRP 500,000 11% 9% 13% - Core Clusters Non-Core Clusters Non-cluster Regional Average Scenario BPT, Change in Accessibility to Jobs by Transit for Activity Clusters 2,500,000 2,000,000 1,500,000 1,000,000 BPT CLRP 500,000 - (500,000) 0% Core Clusters 7% Non-Core Clusters 6% Non-cluster 4% Regional Average 89
96 Scenario CPT, Change in Accessibility to Jobs by Transit for Activity Clusters 2,500,000 2,000,000 1,500,000 1,000,000 3% CPT CLRP 500,000 10% 10% 8% - Core Clusters Non-Core Clusters Non-cluster Regional Average Change in Access to Jobs By Transit Across Scenarios 14% 13% 12% 10% 11% 9.6% 9.7% 9% 8% 6% 4% 3.5% 3.4% 6.8% 6.3% 4.4% 7.7% APT BPT CPT 2% 0% 0.0% Core Clusters Non-core Clusters Non-cluster Areas Regional Average 90
97 Scenario APT, Change in Accessibility to Households by Transit for Activity Clusters 1,200,000 1,000, , , ,000 7% APT CLRP 200,000 - Core Clusters 13% Non-Core Clusters 14% Non-cluster 11% Regional Average Scenario BPT, Change in Accessibility to Households by Transit For Activity Clusters 1,200,000 1,000, , , ,000 7% BPT CLRP 200,000 - Core Clusters 14% Non-Core Clusters 14% Non-cluster 11% Regional Average 91
98 Scenario CPT, Change in Accessibility to Households by Transit for Activity Clusters 1,200,000 1,000, , , ,000 8% CPT CLRP 200,000 - Core Clusters 13% Non-Core Clusters 13% Non-cluster 11% Regional Average Change in Access to Households By Transit Across Scenarios 16% 14% 13.7% 13.1% 13.3% 14.4% 13.6% 12.7% 12% 11.2% 10.7% 10.9% 10% 8% 6% 4% 2% 0% -2% -4% 7% 7.3% 8.0% Core Clusters Non-core Clusters Non-cluster Areas Regional Average APT BPT CPT 92
99 8.5 Equity Analysis Change in Accessibility to Jobs by Highw ays Scenario APT General Population 71.2% 28.8% African American Asian 52.8% 77.5% 47.2% 22.5% Minimal Impact Hispanic/Latino 68.8% 31.2% Moderate Gain Low -Income 59.2% 40.8% Disabled 66.2% 33.8% 0% 20% 40% 60% 80% 100% Change in Accessibility to Jobs by Highw ays Scenario BPT General Population 7.3% 78.3% 14.4% African American 7.2% Asian 6.7% Hispanic/Latino 12.4% Low -Income 10.0% 80.5% 76.4% 70.0% 74.2% 12.3% 17.0% 17.6% 15.7% Moderate Loss Minimal Impact Moderate Gain Disabled 8.3% 77.2% 14.5% 0% 20% 40% 60% 80% 100% 93
100 Change in Accessibility to Jobs by Highw ays Scenario CPT General Population 7.6% 80.3% 12.1% African American 7.5% Asian 6.9% Hispanic/Latino 13.0% Low -Income 11.6% 83.6% 77.9% 70.8% 76.8% 8.9% 15.2% 16.2% 11.6% Moderate Loss Minimal Impact Moderate Gain Disabled 8.9% 80.0% 11.2% 0% 20% 40% 60% 80% 100% Number of Jobs Accessible Within 45 Minutes by Highways General Population African American Hispanic Asian CLRP APT BPT CPT Low-Income Disabled Number of Jobs, in Thousands 94
101 Change in Accessibility to Jobs by Transit Scenario APT General Population 81.4% 18.6% African American Asian 74.4% 78.1% 25.6% 21.9% Minimal Impact Hispanic/Latino 82.4% 17.6% Moderate Gain Low -Income 78.7% 21.3% Disabled 80.2% 19.8% 0% 20% 40% 60% 80% 100% Change in Accessibility to Jobs by Transit Scenario BPT General Population 81.7% 18.3% African American Asian 75.2% 77.7% 24.8% 22.3% Minimal Impact Hispanic/Latino Low -Income 82.3% 77.7% 17.7% 22.3% Moderate Gain Disabled 80.4% 19.6% 0% 20% 40% 60% 80% 100% 95
102 Change in Accessibility to Jobs by Transit Scenario CPT General Population 80.8% 19.2% African American Asian 74.5% 77.0% 25.5% 23.0% Minimal Impact Hispanic/Latino Low -Income 82.4% 77.0% 17.6% 23.0% Moderate Gain Disabled 79.5% 20.5% 0% 20% 40% 60% 80% 100% Number of Jobs Accessible by Transit Within 45 Minutes General Population African American Hispanic Asian CLRP APT BPT CPT Low-Income Disabled Number of Jobs, in Thousands 96
103 9 Appendix o Excerpts from the Regional Value Pricing Study Work Plan, November 8, 2006 o Goals for a Regional System of Variably Priced Lanes o FHWA Office of Operations: Fact Sheets: Tolling Programs 97
104 98
105 99
Linking Transportation and Land Use Goals through Scenario Planning: A Case Study of the Metropolitan Washington Region
 Linking Transportation and Land Use Goals through Scenario Planning: A Case Study of the Metropolitan Washington Region Erin M. Morrow (Corresponding Author) Transportation Engineer Department of Transportation
TPB Scenario Study Task Force: Proposal for Development and Analysis of Two New Scenarios
 ITEM 15 TPB Scenario Study Task Force: Proposal for Development and Analysis of Two New Scenarios February 20, 2008 Proposal for Two New Scenarios o At its January 16, 2008 meeting, the Scenario Study
Regional Bus Rapid Transit
 Regional Bus Rapid Transit Efforts Board Transportation Committee October 20, 2009 There are a Variety of Regional Bus Rapid Transit Study Efforts They include: NVTA s TransAction 2030 Plan Transportation
WELCOME. Schedule. Contact Information. Please Provide Written Comments
 WELCOME Schedule April 18, 2012 Open House: 6:30 p.m. to 8:30 p.m. Project Presentation: 7:00 p.m. Mary Ellen Henderson Middle School 7130 Leesburg Pike Falls Church, VA 2203 Contact Information Kala Leggett
Appendix D. Tier 2 Final Environmental Assessment I-66 Transportation Technical Report
 Tier 2 Final Environmental Assessment I-66 Transportation Technical Report Appendix D Travel Demand Model & Post Processing Methodology & Assumptions Technical Memorandum FINAL AUGUST 2016 TECHNICAL MEMORANDUM
ATTACHMENT A. Detailed Study Scope. I-66 (Inside) Multi-modal Study Scope
 Multi-modal Study Scope") ATTACHMENT A Detailed Study Scope I-66 (Inside) Multi-modal Study Scope EXECUTIVE SUMMARY The Virginia Department of Transportation (VDOT) seeks consultant assistance in identifying and evaluating a range
ATTACHMENT A Detailed Study Scope I-66 (Inside) Multi-modal Study Scope EXECUTIVE SUMMARY The Virginia Department of Transportation (VDOT) seeks consultant assistance in identifying and evaluating a range
NORTHERN VIRGINIA TRANSPORTATION PLAN
 NORTHERN VIRGINIA TRANSPORTATION PLAN November 2012 Table of Contents TransAction 2040 Plan Area...1 Communities and Facilities Covered in TransAction 2040... 1 TransAction 2040 Plan Methodology...2 Individual
POPULATION AND EMPLOYMENT FORECASTS
 POPULATION AND EMPLOYMENT FORECASTS Paul DesJardin COG Community Planning and Services Item # 11 National Capital Region Transportation Planning Board Overview of Forecasts (Round 9.1) First update to
A New Northern Potomac River Crossing Documented Need and Benefits
 A New Northern Potomac River Crossing Documented Need and Benefits Loudoun County Board of Supervisors June 29, 2017 Comprehensive Plan for the Nation's Capital and Its Environs - 1950 National Capital
6.0 CONGESTION HOT SPOT PROBLEM AND IMPROVEMENT TRAVEL DEMAND MODEL ANALYSIS
 6.0 CONGESTION HOT SPOT PROBLEM AND IMPROVEMENT TRAVEL DEMAND MODEL ANALYSIS 6.1 MODEL RUN SUMMARY NOTEBOOK The Model Run Summary Notebook (under separate cover) provides documentation of the multiple
ITEM 11 - Information September 15, 2010
 ITEM 11 - Information September 15, 2010 Briefing on the "CLRP Aspirations" Scenario, Major Corridor Studies Considering Managed/Priced Lanes in the Washington region, and a new Federal Highway Administration
SUMMARY REPORT September 11, 2012 DRAFT
 SUMMARY REPORT Table of Contents TransAction 2040 Study Area... 1 Study Area Corridors and Map... 1 Communities and Facilities Covered in TransAction 2040... 1 TransAction 2040 Study Methodology... 2 Individual
Long-Range Plan Task Force: Draft Analysis Results
 Long-Range Plan Task Force: Draft Analysis Results November 15, 2017 Prepared for: National Capital Region Transportation Planning Board Transportation Planning Board Item #9 Presentation Components Analysis
MARC Brunswick/Frederick Line Improvement Proposal
 MD State Highway Administration Project No. M00695172 IS 270 Innovative Congestion Management Project MARC Brunswick/Frederick Line Improvement Proposal Action Committee for Transit November 2016 MARC
The Alliance Vision/Purpose
 April 18, 2018 The Alliance Vision/Purpose The Alliance is the acknowledged leader in advancing a visionary, regional, multi-modal transportation network to create a better quality of life and greater
TransAction Plan October 2017
 Transportation Action Plan for Northern Virginia TransAction Plan October 2017 TransAction is the multimodal transportation master plan for Northern Virginia. It is a long range plan addressing regional
Fairfax County Comments on the 1-66 Inside the Beltway Multimodal Improvement Project
 COMMONWEALTH OF VIRGINIA County of Fairfax 12000 GOVERNMENT CENTER PKWY SUITE 530 FAIRFAX, VIRGINIA 22035-0071 BOARD OF SUPERVISORS TELEPHONE: 703/324-2321 FAX: 703/324-3955 TTY: 711 SHARON BULOVA CHAIRMAN
Fairfax County Countywide Transit Network Study
 Fairfax County Countywide Transit Network Study Proposed High Quality Transit Network Concept Metropolitan Washington Council of Governments Travel Forecasting Subcommittee September 20, 2013 1 Presentation
9. TRAVEL FORECAST MODEL DEVELOPMENT
 9. TRAVEL FORECAST MODEL DEVELOPMENT To examine the existing transportation system and accurately predict impacts of future growth, a travel demand model is necessary. A travel demand model is a computer
Purpose of the Public Hearing
 www.virginiadot.org Public Hearings Interstate 66 - Outside the Beltway Tier 1 Draft Environmental Impact Statement From U.S. Route 15 To I-495 Prince William and Fairfax Counties Wednesday, March 13,
Charlotte Region HOV/HOT/Managed Lanes Analysis. Technical Memorandum Task 1.3 EVALUATION CRITERIA
 Charlotte Region HOV/HOT/Managed Lanes Analysis Technical Memorandum Task 1.3 EVALUATION CRITERIA October 23, 2007 TABLE OF CONTENTS 1.0 EVALUATION PROCESS -------------------------------------------------------------------------------------------
This document has been developed to provide context to the Board as part of the strategic planning process. Regional development and travel trends
 1 This document has been developed to provide context to the Board as part of the strategic planning process. Regional development and travel trends and forecasts are provided, including population, employment,
April 12, Dear Chairman Wojahn and Members of the Transportation Planning Board:
 April 12, 2014 The Honorable Patrick Wojahn National Capital Region Transportation Planning Board c/o Metropolitan Washington Council of Governments 777 North Capital Street, NW, Suite 300 Washington,
NEPA and Design Public Hearings
 NEPA and Design Public Hearings Monday, December 5, 2016 Washington-Lee High School 1301 N. Stafford Street Arlington, VA 22201 Thursday, December 8, 2016 Mary Ellen Henderson Middle School 7130 Leesburg
ITEM 9 Action October 18, 2017
 ITEM 9 Action October 18, 2017 Approval of the Air Quality Conformity Analysis of the VDOT and MDOT Off-Cycle Amendment to the 2016 CLRP and Approval of the 2016 Off-Cycle Amendment Staff Recommendation:
ITEM 11 - Information January 21, Briefing on Project Submissions for the 2015 CLRP
 ITEM 11 - Information January 21, 2015 Briefing on Project Submissions for the 2015 CLRP Staff Recommendation: Issues: Background: Receive briefing on the major projects submitted for the 2015 CLRP by
Chapter #9 TRAVEL DEMAND MODEL
 Chapter #9 TRAVEL DEMAND MODEL TABLE OF CONTENTS 9.0 Travel Demand Model...9-1 9.1 Introduction...9-1 9.2 Overview...9-1 9.2.1 Study Area...9-1 9.2.2 Travel Demand Modeling Process...9-3 9.3 The Memphis
Fairfax Transportation Committee I-66 Multimodal Improvements Inside the Beltway. January 20, 2015
 Fairfax Transportation Committee I-66 Multimodal Improvements Inside the Beltway January 20, 2015 I-66 Multimodal Improvements I-66 Multimodal Study (2012 / 2013) Tolling element Multimodal solutions Future
2004 FEASIBILITY STUDY UPDATE
 Austin-San Antonio Intermunicipal Commuter Rail District 2004 FEASIBILITY STUDY UPDATE December 2004 EXECUTIVE SUMMARY INTRODUCTION Almost 3 million people in Central Texas, living and working between
FAMPO RESOLUTION ADOPTING REGIONAL CONGESTION MITIGATION AND AIR QUALITY IMPROVEMENT PROGRAM PERFORMANCE MEASURE TARGETS
 Timothy McLaughlin Chair Paul Agnello FAMPO Administrator FAMPO RESOLUTION 19-02 ADOPTING REGIONAL CONGESTION MITIGATION AND AIR QUALITY IMPROVEMENT PROGRAM PERFORMANCE MEASURE TARGETS WHEREAS, the National
MOBILITY AND ALTERNATIVES ANALYSIS
 6 MOBILITY AND ALTERNATIVES ANALYSIS BACK OF SECTION DIVIDER 6.0 Mobility and Alternatives Analysis Travel demand analysis provides a framework for the identification of transportation facilities and services
Congestion Management Process (CMP)
") Congestion Management Process (CMP) Introduction The Congestion Management Process (CMP) is a systematic, data-driven, and regionally accepted approach that aims to improve the performance of the transportation
Congestion Management Process (CMP) Introduction The Congestion Management Process (CMP) is a systematic, data-driven, and regionally accepted approach that aims to improve the performance of the transportation
TRIP s Top 40 Transportation Projects to Support Economic Growth and Quality of Life in Maryland
 TRIP s Top 40 Transportation Projects to Support Economic Growth and Quality of Life in Maryland APRIL 2012 Washington, DC 202-466-6706 Founded in 1971, TRIP of Washington, DC, is a nonprofit organization
USING A SIMULATION ENVIRONMENT FOR DYNAMIC TOLL ANALYSIS
 USING A SIMULATION ENVIRONMENT FOR DYNAMIC TOLL ANALYSIS ABSTRACT Robert Kerns and Darryn Paterson Transurban, USA 1421 Prince Street, Suite 200 Alexandria, Virginia 22314 571-527-2050; rkerns@transurban.com;
Evaluation of Alternatives
 Chapter 9.0 Evaluation of Alternatives Chapter 9.0 provides a summary evaluation of the No Build Alternative and the Preferred Alternative. The evaluation contained within this chapter is an assessment
Highway and Transit Networks for the Version Travel Model, based on the 2014 CLRP and FY TIP
 Metropolitan Washington Council of Governments National Capital Region Transportation Planning Board Highway and Transit Networks for the Version 2.3.57 Travel Model, based on the 2014 CLRP and FY 2015-2020
I-66 Corridor Improvements Outside the Capital Beltway in Northern Virginia, USA
 15th International Conference on Managed Lanes I-66 Corridor Improvements Outside the Capital Beltway in Northern Virginia, USA Case Study for Funding of Transit Service and Transportation Demand Management
Northern Virginia Region Draft Needs Summary
 Needs Map: Need A A DEMAND The ability of communities around transit stations (particularly the areas within 1-2 miles of the stations and other travel hubs) to attract skilled workers and grow businesses
Route 7 Connector Ramp MODIF IE D I N T ER C H A N G E M OD IFICATIO N R E PO RT TRA N S F O R M I : I N S ID E THE BE LTWAY
 STATE PROJECT NUMBER: 0066-96A-493,P101, C501, B686; UPC: 110629 FEDERAL PROJECT NUMBER: NHPP-066-1(356) FAIRFAX COUNTY, VIRGINIA TRA N S F O R M I - 6 6 : I N S ID E THE BE LTWAY Route 7 Connector Ramp
2040 Transportation Policy Plan Conversion to Performance Based Planning Basis. 25 th Annual CTS Transportation Research Conference May 21, 2014
 2040 Transportation Policy Plan Conversion to Performance Based Planning Basis 25 th Annual CTS Transportation Research Conference May 21, 2014 1 About the plan Long-range transportation plan for the Twin
For the first time ever, regional leaders have
 JULY-A UGUST 2003 VOLUME XII ISSUE 1 Value Pricing Conference Gathers Enthusiastic Crowd For the first time ever, regional leaders have met in a major public event to discuss the use of pricing policies
Demand Reduction Assumptions Used For Travel Demand Analysis of EIS Alternatives
 M E M O R A N D U M Demand Reduction Assumptions Used For Travel Demand Analysis of EIS Alternatives TO: FROM: Project Management Team Steve Perone/PTV America DATE: Revised: February 6, 2009 Background
NEED ECONOMIC TRANSPORTATION LOCATIONS EXAMPLE
 A. Enhance multimodal networks and facilities around transit access points such as existing and emerging rail stations, high capacity bus stops, and intermodal transfer centers There is a need for improved
TransAction Plan Draft for Public Comment Spring/Summer 2017
 Transportation Action Plan for Northern Virginia TransAction Plan Draft for Public Comment Spring/Summer 2017 Comments are invited on this TransAction Plan, and associated TransAction Plan Project List.
Travel Demand Forecasting User Guide
 Travel Demand Forecasting User Guide A Supplement to the Regional Transitway Guidelines Metropolitan Council February 2012 This document supplements the Project Development, Leadership, and Oversight discussion
CHAPTER 9 TRAVEL DEMAND MODEL SUMMARY
 CHAPTER 9 TRAVEL DEMAND MODEL SUMMARY This chapter describes the OKI / MVRPC regional travel demand model, used to support traffic and transit forecasts for the NSTI study. This model is based on version
APPENDIX H: TRAVEL DEMAND MODEL VALIDATION AND ANALYSIS
 APPENDIX H: TRAVEL DEMAND MODEL VALIDATION AND ANALYSIS Travel demand models (TDM) simulate current travel conditions and forecast future travel patterns and conditions based on planned system improvements
Regional Transit System Plan
 Policy, Program Development & Intergovernmental Relations Committee Item III-A October 14, 2010 Regional Transit System Plan Washington Metropolitan Area Transit Authority Board Action/Information Summary
Los Angeles County Congestion Reduction Demonstration Project
 Los Angeles County Congestion Reduction Demonstration Project frequently asked questions update #1 /august 2008 Los Angeles County Metropolitan Transportation Authority (Metro), California Department of
Commonwealth Transportation Board I-66 Corridor Briefing Outside the Beltway Route 15 to I-495
 Commonwealth Transportation Board I-66 Corridor Briefing Outside the Beltway Route 15 to I-495 January 13, 2015 1 Project Status Update Transit P3 Procurement I-66 Corridor Briefing Overview Major Project
Transform 66 Multimodal Project: Prioritization Process and Evaluation Criteria Approved March 3, 2016
 Transform 66 Multimodal Project: Prioritization Process and Evaluation Criteria Approved March 3, 2016 The Memorandum of Agreement (MOA) for the Transform 66: Inside the Beltway Project directs NVTC to
Transportation and Utilities
 4 Section 4 Transportation and Utilities 4.0 Introduction Transportation and utility systems are essential to accommodate and support development proposed in the Future Land Use Map. The following pages
CHAPTER 2: MODELING METHODOLOGY
 CHAPTER 2: MODELING METHODOLOGY 2.1 PROCESS OVERVIEW The methodology used to forecast future conditions consisted of traditional traffic engineering practices and tools with enhancements to more accurately
: value pricing. application of the 10 criteria for the long-term consideration of 5.1 THE UNIVERSE OF FACILITIES IN THE DALLAS- FORT WORTH REGION
 Re g i o n a l Va l u e P r i c i n g C o r r i d o r E v a l u at i o n a n d Fe a s i b i l i t y S t u d y N o r t h C e n t r a l T e x a s C o u n c i l o f G o v e r n m e n t s 5 application of
ACTIVE TRANSPORTATION ADVISORY COMMITTEE. Memphis MPO March 30, 2015
 ACTIVE TRANSPORTATION ADVISORY COMMITTEE Memphis MPO March 30, 2015 Agenda Welcome & Introductions Announcements and Briefings Livability 2040: Regional Transportation Plan Congestion Management Process
Sunrise Project South I-205 Corridor Improvement Project
 Sunrise Project South I-205 Corridor Improvement Project January 24, 2007 Sunrise and I-205 Project Summary Conclusions Sunrise Scoping Study Key Results South I-205 Scoping Study Key Results South I-205
Whatif. the Washington region grew differently? The Regional Mobility and Accessibility Scenario Study
 The Regional Mobility and Accessibility Scenario Study Whatif the Washington region grew differently? National Capital Region Transportation Planning Board Metropolitan Washington Council of Governments
EVALUATION OF ALTERNATIVES CARRIED FORWARD
 1 EVALUATION OF ALTERNATIVES CARRIED FORWARD This chapter presents a comparative evaluation of the alternatives carried forward in this Final Environmental Impact Statement (EIS). The intent of this evaluation
NATIONAL CAPITAL REGION TRANSPORTATION PLANNING BOARD 777 NORTH CAPITOL STREET, N.E., WASHINGTON, D.C
 TPB R34-2009 June 17, 2009 NATIONAL CAPITAL REGION TRANSPORTATION PLANNING BOARD 777 NORTH CAPITOL STREET, N.E., WASHINGTON, D.C. 20002-4239 RESOLUTION ON INCLUSION OF THE PURPLE LINE LIGHT RAIL PROJECT
Regional Evaluation Decision tool for Smart Growth
 Regional Evaluation Decision tool for Smart Growth Maren Outwater, Robert Cervero, Jerry Walters, Colin Smith, Christopher Gray, Rich Kuzmyak Objectives This project is one of the SHRP 2 Capacity projects
9.0 Meeting the Challenges
 9.0 Meeting the Challenges 9.1 SLRTP Goals The SLRTP is built around the six TxDOT Strategic Plan goals. 1. Develop an organizational structure and strategies designed to address the future multimodal
December 16, 2011 To: Gerrit Knaap, Fred Ducca From: Graham Petto Subject: Transit Friendly Scenario Development
 Preinkert Field House College Park, Maryland 20742 P: 301.405.6283 F: 301.314.5639 http://www.smartgrowth.umd.edu NATIONAL CENTER FOR SMART GROWTH RESEARCH AND EDUCATION December 16, 2011 To: Gerrit Knaap,
PROJECT SUBMISSION FORM
 PROJECT SUBMISSION FORM Basic Project Information CEID 1182 1. Submitting Agency: MDOT/State Highway Administration 2. Secondary Agency: 3. Agency Project ID: 4. Project Type: Interstate Primary Secondary
The Transportation dividend
 Prepared by AECOM Technical Appendices report February 2018 The Transportation dividend Transit investments and the Massachusetts economy Technical Appendix A economic Benefits Methodology and Results
Commonwealth Transportation Board Sean T. Connaughton 1401 East Broad Street (804) Chairman Richmond, Virginia Fax: (804)
 Chairman Richmond, Virginia Fax: (804)") Commonwealth Transportation Board Sean T. Connaughton 1401 East Broad Street (804) 786-1830 Chairman Richmond, Virginia 23219 Fax: (804) 786-2940 RESOLUTION OF THE COMMONWEALTH TRANSPORTATION BOARD Made
Commonwealth Transportation Board Sean T. Connaughton 1401 East Broad Street (804) 786-1830 Chairman Richmond, Virginia 23219 Fax: (804) 786-2940 RESOLUTION OF THE COMMONWEALTH TRANSPORTATION BOARD Made
CHAPTER 7. TRAVEL PATTERNS AND TRAVEL FORECASTING
 CHAPTER 7. TRAVEL PATTERNS AND TRAVEL FORECASTING TRAVEL PATTERNS Northwest Arkansas has experienced unprecedented growth in population and employment in the past 25 years. The economic vitality and diversity
VTrans2040 Multimodal Transportation Plan Corridors of Statewide Significance Needs Assessment Western Mountain Corridor (L)
") VTrans2040 Multimodal Transportation Plan Corridors of Statewide Significance Needs Assessment Western Mountain Corridor (L) 77 Table of Contents I. Corridor Overview Land Use and Demographics Corridor
VTrans2040 Multimodal Transportation Plan Corridors of Statewide Significance Needs Assessment Western Mountain Corridor (L) 77 Table of Contents I. Corridor Overview Land Use and Demographics Corridor
CHAPTER 6 PERFORMANCE PLANNING. Performance-Based Planning and Programming
 (Geoff Livingston/Flickr) CHAPTER 6 PERFORMANCE PLANNING The TPB has championed improvements in the ways the region s transportation system is managed and operated. This chapter describes the purpose of
2030 Transportation Policy Plan SUMMARY PRESENTATION. Land Use Advisory Committee November 15, 2012
 2030 Transportation Policy Plan SUMMARY PRESENTATION Land Use Advisory Committee November 15, 2012 Today s Topics Transportation Policy Plan (TPP) Requirements and Background Current TPP Policies, Issues
Appendix E Technical Description of the Modeling Framework
 Appendix E Technical Description of the Modeling Framework Appendix E Technical Description of Modeling Framework Appendix E Technical Description of Modeling Framework 1 In general terms, what analysis
CTA Blue Line Forest Park Branch Feasibility/Vision Study: Transit Ridership Forecasting Analysis Technical Memorandum Submitted By
 Feasibility/Vision Study: Technical Memorandum Submitted By WSP Parsons Brinckerhoff 30 N. LaSalle Street, Suite 4200 Chicago, IL 60602 December 2016 TABLE OF CONTENTS 1.0 INTRODUCTION... 1 1.1 Organization
SOUTHWEST LRT (METRO GREEN LINE EXTENSION)
") 8 Evaluation of Alternatives This chapter evaluates the effectiveness of the No Build Alternative and the Southwest Light Rail Transit (LRT) Project (the Project) based on the information contained in
8 Evaluation of Alternatives This chapter evaluates the effectiveness of the No Build Alternative and the Southwest Light Rail Transit (LRT) Project (the Project) based on the information contained in
VTrans2040 Multimodal Transportation Plan Corridors of Statewide Significance Needs Assessment North-South Corridor
 VTrans2040 Multimodal Transportation Plan Corridors of Statewide Significance Needs Assessment North-South Corridor Table of Contents I. Corridor Overview Demographics and Economic Trends Corridor Travel
HB 599 Study Overview A detailed evaluation framework and methodology to evaluate regionally significant projects and their impact on congestion
 HB 599 Study Overview A detailed evaluation framework and methodology to evaluate regionally significant projects and their impact on congestion Kanathur Srikanth VDOT NoVA District VASITE June 26, 2014
Database and Travel Demand Model
 Database and Travel Demand Model 7 The CMP legislation requires every CMA, in consultation with the regional transportation planning agency (the Metropolitan Transportation Commission (MTC) in the Bay
Appendix B2: Factors Affecting Transit Choice
 Appendix B2: Factors Affecting Transit Choice 1 TRANSIT MARKET The transit market comprises those trips which have the option of taking transit, that is, those trips for which the trip origin and trip
Recommended Roadway Plan Section 3 Existing Facilities & System Performance
 Recommended Roadway Plan Section 3 Existing Facilities & System Performance RECOMMENDED ROADWAY PLAN SECTION 3 Existing Facilities and System Performance 3.1 Introduction An important prerequisite to transportation
Alternatives Evaluation Report. Appendix C. Alternatives Evaluation Report
 s Evaluation Report Appendix C s Evaluation Report I-35W North Corridor Project EA Minnesota Department of Transportation Final Project s Report I-35W North Corridor Preliminary Design Project Report Version
Association for Commuter Transportation Recommendations to USDOT on MAP-21 Performance Measures
 Association for Commuter Transportation 1341 G Street, NW, 10th Floor Washington, DC 20005 Tel: 202.719.5331 www.actweb.org Association for Commuter Transportation Recommendations to USDOT on MAP-21 Performance
Future Build Alternative Traffic Forecasts and Level of Service Analysis
 4.2.10 Future Build Alternative Traffic Forecasts and Level of Service Analysis For the five Build Alternatives, study intersections within one mile of potential station locations were analyzed, as it
Appendix D: Functional Classification Criteria and Characteristics, and MnDOT Access Guidance
 APPENDICES Appendix D: Functional Classification Criteria and Characteristics, and MnDOT Access Guidance D.1 Functional classification identifies the role a highway or street plays in the transportation
National Capital Region Congestion Report
 NATIONAL CAPITAL REGION TRANSPORTATION PLANNING BOARD National Capital Region Congestion Report 2nd Quarter 2014 Metropolitan Washington Council of Governments 777 North Capitol Street, N.E., Suite 300,
Appendix D Functional Classification Criteria and Characteristics, and MnDOT Access Guidance
 Appendix D Functional Classification Criteria and Characteristics, and MnDOT Access Guidance Functional classification identifies the role a highway or street plays in the transportation system. Some highways
I-95 / I-395 Integrated Corridor Management. Hari Sripathi, P.E. Regional Operations Director
 I-95 / I-395 Integrated Corridor Management Hari Sripathi, P.E. Regional Operations Director Purpose of ICM Initiative Address real time demand management in I-95/I- 395 corridor Identify tools to provide
CONNECT GREATER WASHINGTON. Together, the DC region can grow Efficiently Responsibly Sustainably Equitably Affordably Competitively
 CONNECT GREATER WASHINGTON Together, the DC region can grow Efficiently Responsibly Sustainably Equitably Affordably Competitively CONNECTGREATERWASHINGTON Do you want a future for the Washington region
Refined Statewide California Transportation Model. Progress Report November 2009
 Refined Statewide California Transportation Model Progress Report November 2009 Study area - the State of California. Forecast trips made on a typical fall / spring weekday i.e. when schools are in session.
City of Brantford Chapter 3 TABLE OF CONTENTS
 Chapter 3 The Land Use & Transportation Connection TABLE OF CONTENTS 3.1 THE LAND USE & TRANSPORTATION LINK... 1 3.2 POPULATION & EMPLOYMENT GROWTH FORECASTS... 3 3.2.1 Proposed Places to Grow Plan Forecasts
ARLINGTON COUNTY TRANSIT DEVELOPMENT PLAN
 p EXECUTIVE SUMMARY Report Prepared by: ARLINGTON COUNTY TRANSIT DEVELOPMENT PLAN The Arlington County Transit Development Plan (TDP) is an effort to evaluate and assess the performance, connectivity,
Appendix L Greenhouse Gas 4-part Strategy
 Appendix L Greenhouse Gas 4-part Strategy Supplementary information regarding options for further reducing greenhouse gas emissions in the Puget Sound region State and Federal Greenhouse Gas Emissions
SABRA, WANG & ASSOCIATES, INC. Engineers Planners Analysts
 SABRA, WANG & ASSOCIATES, INC. Engineers Planners Analysts TECHNICAL MEMORANDUM TO: FROM: Mr. Eric Graye, Planning Supervisor, Functional Planning and Policy Division, Montgomery County Planning Department
I 95 EXPRESS LANES SOUTHERN TERMINUS EXTENSION TRAFFIC OPERATIONS AND SAFETY ANALYSIS REPORT
 I 95 EXPRESS LANES SOUTHERN TERMINUS EXTENSION TRAFFIC OPERATIONS AND SAFETY ANALYSIS REPORT February 2016 INTERSTATE 95 EXPRESS LANES SOUTHERN TERMINUS EXTENSION PROJECT Commonwealth of Virginia Virginia
Chapter 1: Overview. page 1. Figure 2-1: Road congestion is expected to continue to grow
 Chapter 1: Overview Figure 2-1: Road congestion is expected to continue to grow The region s mobility so fundamental to its economic vitality and quality of life is challenged by mounting congestion, rising
APPENDIX B. Summary of Projects in the Financially Constrained Element. October 2018
 APPENDIX B Summary of Projects in the Financially Constrained Element October 2018 SUMMARY OF PROJECTS IN THE FINANCIALLY- CONSTRAINED ELEMENT OF THE VISUALIZE 2045 LONG-RANGE TRANSPORTATION PLAN FOR THE
MEMORANDUM. Date: July 14, 2006 Project #: To: US 97 & US 20 Refinement Plan Steering Committee
 MEMORANDUM Date: July 14, 2006 Project #: 6389 To: US 97 & US 20 Refinement Plan Steering Committee From: Sonia Hennum, P.E., Andrew Cibor, E.I.T., & Julia Kuhn, P.E. Project: US 97 & US 20 Refinement
MEMORANDUM EXAMPLES FOR ILLUSTRATIVE PURPOSES NEXT STEPS. Item 3 Long-Range Plan Task Force May 17, 2017
 Item 3 Long-Range Plan Task Force May 17, 2017 MEMORANDUM TO: TPB Long-Range Plan Task Force FROM: Kanti Srikanth, TPB Staff Director SUBJECT: Sample list of improvement initiatives for illustrative purposes
ITEM 10 Action November 16, Approval of the 2011 CLRP. the 2011 CLRP.
 ITEM 10 Action November 16, 2011 Approval of the 2011 CLRP Staff Recommendation: Issues: Background: Adopt Resolution R6-2012 approving the 2011 CLRP. None At the October 19 meeting, the Board was briefed
TRANSFORM66: OUTSIDE THE BELTWAY
 TRANSFORM66: OUTSIDE THE BELTWAY Concession Fee Project Eligibility *Required Entry PARTI GENERAL INFORMATION 1.1 Applicant Information Please indicate the jurisdiction or agency that is submitting this
VTrans2040 Multimodal Transportation Plan Corridors of Statewide Significance Needs Assessment North-South Corridor (G)
") VTrans2040 Multimodal Transportation Plan Corridors of Statewide Significance Needs Assessment North-South Corridor (G) UV 234 Table of Contents I. Corridor Overview Demographics and Economic Trends Corridor
VTrans2040 Multimodal Transportation Plan Corridors of Statewide Significance Needs Assessment North-South Corridor (G) UV 234 Table of Contents I. Corridor Overview Demographics and Economic Trends Corridor
APPENDIX H- ALTERNATIVES PREVIOUSLY CONSIDERED
 APPENDIX H- ALTERNATIVES PREVIOUSLY CONSIDERED APPENDIX H: ALTERNATIVES PREVIOUSLY CONSIDERED This appendix provides an overview of the process that led to the selection of the Locally Preferred Alternative
ITEM 8 Action May 17, 2017
 ITEM 8 Action May 17, 2017 Approval of Maryland Department of Transportation (MDOT) Additional Project Submission for the Out-Of-Cycle Air Quality Conformity Analysis for the Amendment to the 2016 CLRP