Q Financial Results
|
|
|
- Lizbeth Lambert
- 6 years ago
- Views:
Transcription

1 Q Financial Results
2 Safe Harbor The information presented herein may contain forward-looking statements. Such forward-looking statements include all statements other than statements of historical fact, including forecasts of trends. These forward-looking statements are inherently difficult to predict. Actual results could differ materially for a variety of reasons, including the amount and timing of our capital expenditures, the mix of products we sell, adverse tax, regulatory or legal developments, consumer or regulatory claims regarding the products we offer or sell, the extent to which we owe taxes or are required to collect sales or similar taxes in jurisdictions in which we do not do so, competition, fluctuations in our operating results, any inability to raise capital or borrow funds on acceptable terms, difficulties we may have with our efforts to expand both domestically and internationally, and risks of inventory management and seasonality. Other risks and uncertainties include, among others, risks related to the business our subsidiary Medici Ventures, Inc. is pursuing, our continually evolving business model, and difficulties we may have with our infrastructure, our fulfillment partners or our payment processors, including cyber-attacks or data breaches affecting us or any of them. More information about factors that could potentially affect our financial results is included in our Form 10-K for the year ended December 31, 2016 which was filed with the Securities and Exchange Commission on March 3, The Form 10-K and our subsequent filings with the Securities and Exchange Commission identify important factors that could cause our actual results to differ materially from those contained in or contemplated by our projections, estimates and other forward-looking statements.. 2
3 Q Results - OSTK Total Revenue Gross Profit Dollars Gross Margin $432.4 Million (5% increase vs. Q1 2016) $86.9 Million (12% increase vs. Q1 2016) 20.1% (vs. 18.7% in Q1 2016) Contribution Dollars * Contribution Margin * Tech and G&A Expense $50.0 Million (0% decrease vs. Q1 2016) 11.6% (vs. 12.1% in Q1 2016) $51.6 Million (9% increase vs. Q1 2016) Pre-Tax Income (Loss)*** ($6.6) Million $1.4M Retail** ($8.0M) Medici** (vs. $22.1 million in Q1 2016) $25.1M Retail** ($3.0M) Medici** Net Income (Loss) **** ($5.9) Million (vs. $13.4M in Q1 2016) TTM Operating Cash Flow $51.0 Million (vs. $63.1 million in Q1 2016) * Non-GAAP see discussion and reconciliation in our earnings press release ** Excluding intercompany transactions eliminated in consolidation *** Q pre-tax results include an impairment charge of $4.5M related to a cost method investment **** Net Income refers to Net income attributable to stockholders of Overstock.com, Inc. 3
4 Q Results - Retail Only (Direct and Partner) Revenue Gross Profit Dollars Gross Margin $428.1 Million (4% increase vs. Q1 2016) $85.8 Million (13% increase vs. Q1 2016) 20.0% (vs. 18.5% in Q1 2016) Contribution Dollars * Contribution Margin * Pre-Tax Income $49.2 Million 11.5% $1.4M (0% increase vs. Q1 2016) (vs. 11.9% in Q1 2016) (vs. $25.1M in Q1 2016)** * Non-GAAP see discussion and reconciliation in our earnings press release ** Q results include a litigation settlement received of $19.5M 4
5 Marketing Spend as a % of sales (per Internet Retailer) How digital marketing spend relates to sales for top e-retailers Internet Retailer, Stefany Zaroban, April 5, 2017 How Marketing Spend Relates to Sales for Top Web-Only Merchants Retailer Amazon.com Inc. 4.7% 4.9% 5.1% Etsy Inc. 19.2% 23.7% 20.4% Wayfair Inc. 23.7% 14.5% 17.7% Groupon Inc. 8.4% 7.8% 12.2% Overstock Inc. 7.0% 7.3% 7.8% Cimpress 19.6% 32.9% 30.3% Shutteryfly Inc. 29.4% 27.0% 23.6% Flowers.com Inc. 28.0% 31.6% 31.7% U.S. Auto Parts Network 14.7% 14.4% 14.2% PetMed Express Inc. 12.4% 9.7% 7.7% CafePress.com 26.4% 21.5% 22.8% Source: Internet Retailer analysis of retailer s public filings. 5
6 Wayfair Comparison Total Visits Visit data source: Hitwise, a division of Connexity 6
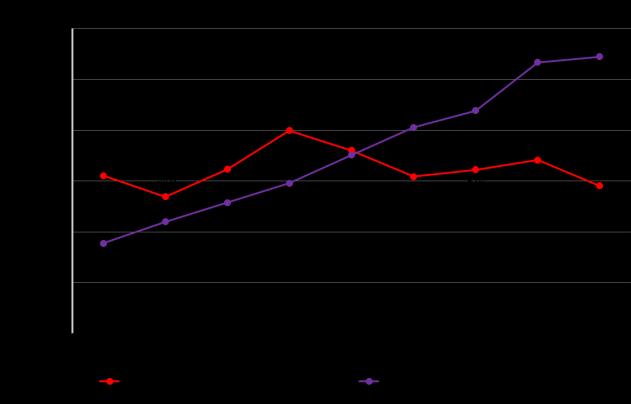
7 Wayfair Comparison - Visits and Ad Spend Ad Spend data source: Overstock and Wayfair 10-Ks and 10-Qs Visit data source: Hitwise, a division of Connexity 7
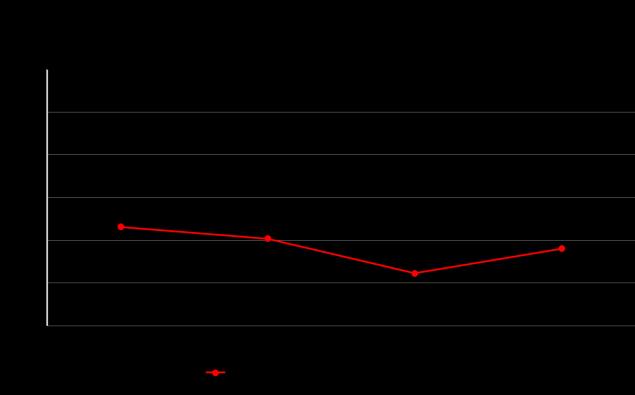
8 Wayfair Comparison - Ad Spend / Visit Ad Spend data source: Overstock and Wayfair 10-Ks and 10-Qs Visit data source: Hitwise, a division of Connexity 8
9 Wayfair Comparison - Brand Awareness Brand Awareness 100% 90% 80% 93% 79% 70% 60% 50% 40% 30% 20% 10% 0% Overstock Wayfair 30% more shoppers associate Overstock with lower prices Equal or better perceptions of quality for the price U.S. Aided Awareness Source: Overstock brand tracker- LRW (Lieberman Research Worldwide), Dec
10 Wayfair Comparison - Customer Acquisition Cost $80 $70 $68 $60 $50 $40 $38 $30 $20 Overstock Wayfair $10 $ Customer Acquisition Cost = Total Advertising Spend divided by Implied New Customers ((1-% of orders from Repeat Customers) * Total Orders) Source: Overstock and Wayfair Ks and Investor Presentations 10
11 Wayfair Comparison - Customer Loyalty 80.0% 70.0% 62.8% 63.3% 63.1% 63.0% 64.0% 65.0% 64.8% 65.3% 67.2% 68.4% 68.1% 68.8% 69.3% 70.0% 69.7% 71.0% 60.0% 50.0% 47.3% 48.0% 47.1% 46.8% 50.7% 51.6% 49.8% 50.3% 53.9% 56.6% 55.2% 54.3% 55.4% 57.6% 56.9% 58.0% 40.0% 30.0% 20.0% 2013-Q Q Q Q Q Q Q Q Q Q Q Q Q Q Q Q4 Overstock % of Orders from Repeat Customers (Home & Garden) Wayfair % of Orders from Repeat Customers Sources: Wayfair Q4 16 Investor Presentation and Overstock internal data (Home & Garden only) 11
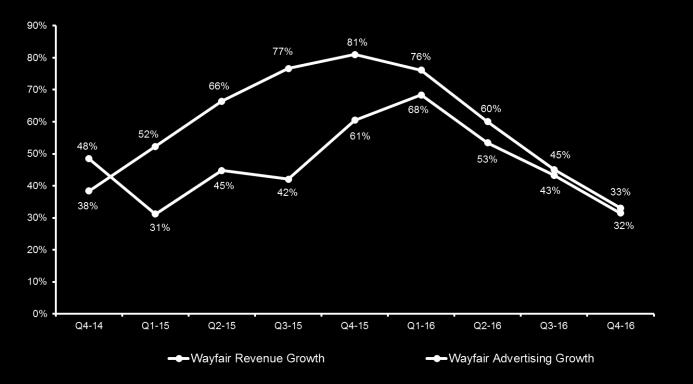
12 Wayfair Revenue & Advertising Growth 90% 80% 77% 81% 76% 70% 66% 60% 50% 48% 52% 61% 68% 60% 53% 45% 40% 30% 38% 31% 45% 42% 43% 33% 32% 20% 10% 0% Q4-14 Q1-15 Q2-15 Q3-15 Q4-15 Q1-16 Q2-16 Q3-16 Q4-16 Wayfair Revenue Growth Wayfair Advertising Growth Source: Wayfair 10-Ks and 10-Qs 12
13 Wayfair Comparison - Contribution Margin 14.0% 12.0% 10.0% 10.5% 12.1% 12.1% 11.2% 9.8% 12.1% 11.2% 11.1% 10.3% 8.0% 6.0% 4.0% 2.0% 0.0% 1.3% 3.5% 3.8% 4.0% 2.2% 2.6% 2.1% 3.9% -2.0% -4.0% -3.2% Q4-14 Q1-15 Q2-15 Q3-15 Q4-15 Q1-16 Q2-16 Q3-16 Q4-16 Overstock contribution margin Wayfair contribution margin Non-GAAP Overstock Contribution Margin = Gross profit less Sales & Marketing plus Club O Rewards and gift card breakage, divided by Total net revenue Wayfair Contribution Margin = Gross profit less Customer service and merchant fees, Advertising, and Merchandising, marketing and sales, divided by Total net revenue Source: Overstock and Wayfair 10-Ks and 10-Qs 13
14 Wayfair Comparison - Net Revenue per Employee ($,000) $350 $300 $250 $271 $251 $232 $216 $248 $228 $239 $261 $298 $200 $150 $174 $167 $172 $183 $194 $162 $146 $154 $175 $100 $50 $- Q4-14 Q1-15 Q2-15 Q3-15 Q4-15 Q1-16 Q2-16 Q3-16 Q4-16 Overstock Net Revenue per Employee Wayfair Net Revenue per Employee Net Revenue divided by total number of employees (as of period end) Source: Overstock and Wayfair 10-Ks, 10-Qs, and Earnings Conference Calls 14
15 Wayfair Comparison - Net Revenue per Employee ($,000) $1,200 $1,000 $869 $881 $873 $1,000 $800 $600 $588 $561 $591 $600 $400 $200 $ Overstock Net Revenue per Employee Wayfair Net Revenue per Employee Net Revenue divided by total number of employees (as of period end) Source: Overstock and Wayfair 10-Ks 15
16 Wayfair Comparison Contribution vs. Breakeven ($,000) ($,000) $300,000 $300,000 $250,000 $250,000 $200,000 $200,000 $150,000 $150,000 $100,000 $100,000 $50,000 $50,000 $- $- $(50,000) $(50,000) Overstock Retail Contribution $ Contribution $ needed to breakeven (pre-tax) Wayfair Contribution $ Contribution $ needed to breakeven (pre-tax) Non-GAAP Overstock Retail Contribution = Gross profit less Sales & Marketing plus Club O Rewards and gift card breakage (retail only) Wayfair Contribution = Gross profit less Customer service and merchant fees, Advertising, and Merchandising, marketing and sales Source: Overstock and Wayfair 10-Ks and 10-Qs 16
17 Wayfair Comparison - Days Payable Outstanding (DPO) Q1-15 Q2-15 Q3-15 Q4-15 Q1-16 Q2-16 Q3-16 Q4-16 Overstock DPO Wayfair DPO TTM Avg. Accounts Payable divided by TTM Cost of Goods Sold/360 Source: Overstock and Wayfair 10-Ks and 10-Qs 17
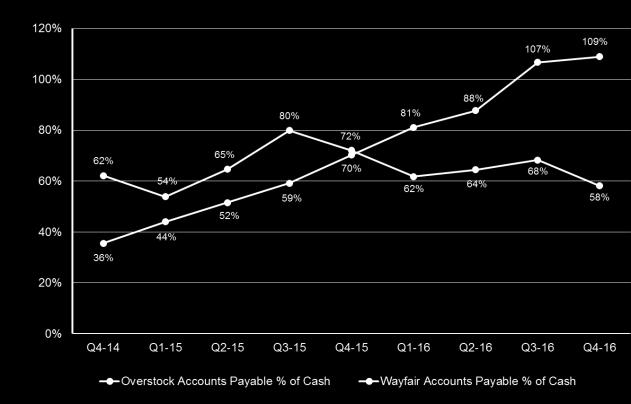
18 Wayfair Comparison - Accounts Payable % of Cash 120% 107% 109% 100% 88% 80% 80% 72% 81% 60% 62% 54% 65% 59% 70% 62% 64% 68% 58% 40% 44% 52% 36% 20% 0% Q4-14 Q1-15 Q2-15 Q3-15 Q4-15 Q1-16 Q2-16 Q3-16 Q4-16 Overstock Accounts Payable % of Cash Overstock - Accounts Payable divided by Cash & Cash Equivalents Wayfair - Accounts Payable divided by Cash & Cash Equivalents plus Short Term Investments Source: Overstock and Wayfair 10-Ks and 10-Qs Wayfair Accounts Payable % of Cash 18
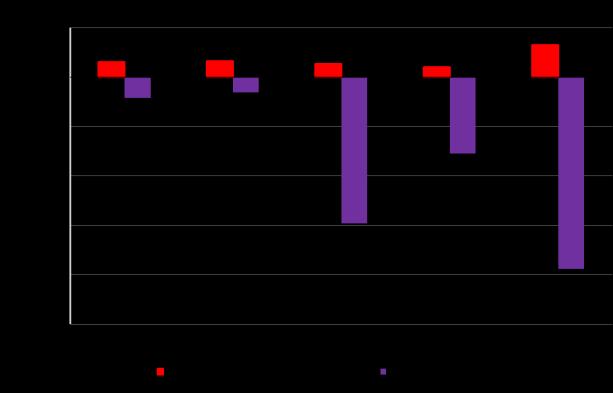
19 Wayfair Comparison - Change in Working Capital ($,000) $350,000 $250,000 Oct Wayfair IPO $236,158 $150,000 $50,000 $21,733 $(50,000) $(10,165) $(25,568) $(150,000) $(158,979) $(175,426) $(250,000) Overstock Change in Working Capital Wayfair Change in Working Capital Working Capital = Current Assets less Current Liabilities Source: Overstock and Wayfair 10-Ks 19
20 Wayfair Comparison - Working Capital ($,000) $300,000 $250,000 $254,276 Oct Wayfair IPO $200,000 $150,000 $100,000 $95,297 $50,000 $- $(50,000) $15,260 $(10,308) $11,425 $(100,000) $(80,129) $(150,000) Overstock Working Capital Wayfair Working Capital Working Capital = Current Assets less Current Liabilities Source: Overstock and Wayfair 10-Ks 20
21 Wayfair Comparison Gross Margin 25.0% 20.0% 20.3% 20.1% 19.5% 20.5% 18.7% 18.2% 18.1% 18.6% 15.0% 10.0% 5.0% 0.0% Q1-16 Q2-16 Q3-16 Q4-16 Overstock Gross Margin Wayfair Gross Margin Non-GAAP Overstock Gross Margin = Gross profit divided by Total net revenue Wayfair Gross Margin = Gross profit less Customer service and merchant fees, divided by Total net revenue Source: Overstock and Wayfair 10-Ks and 10-Qs 21
22 Wayfair Comparison Pricing Strategy Source: Overstock and Wayfair website screenshots 22
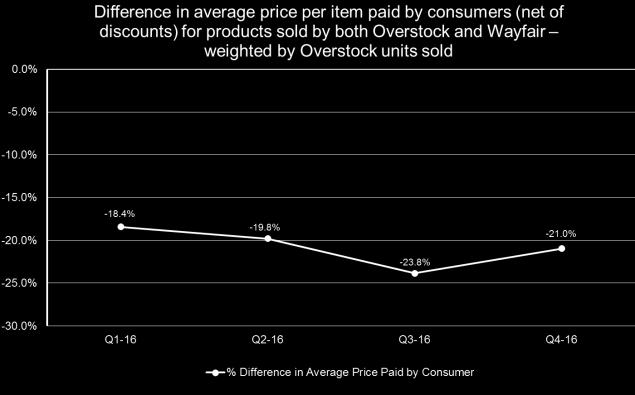
23 Wayfair Comparison Price Paid by Consumer 0.0% Difference in average price per item paid by consumers (net of discounts) for products sold by both Overstock and Wayfair weighted by Overstock units sold -5.0% -10.0% -15.0% -20.0% -18.4% -19.8% -21.0% -23.8% -25.0% -30.0% Q1-16 Q2-16 Q3-16 Q4-16 % Difference in Average Price Paid by Consumer Source: Overstock internal sales data and price scrapes from a 3 rd party pricing intelligence tool. 23
24 Wayfair Comparison Price Paid by Consumer 0.0% Difference in average price per item paid by consumers (net of discounts) for products sold by both Overstock and Wayfair weighted by Wayfair review counts -5.0% -7.5% -10.0% -9.8% -10.5% -12.4% -15.0% -20.0% -25.0% -30.0% Q1-16 Q2-16 Q3-16 Q4-16 % Difference in Average Price Paid by Consumer Source: Overstock internal sales data and review scrapes from a 3 rd party pricing intelligence tool. 24
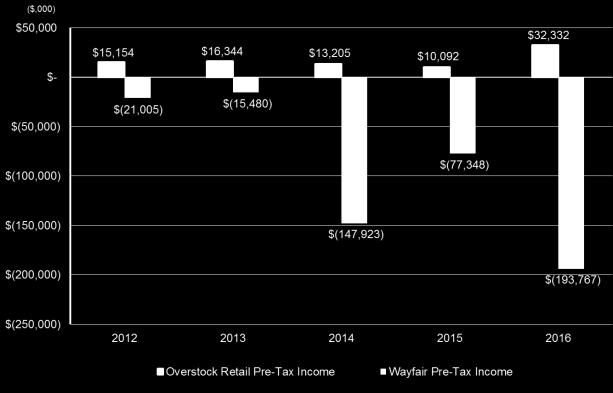
25 Wayfair Comparison - Pre-Tax Income (Loss) ($,000) $50,000 $- $15,154 $16,344 $13,205 $10,092 $32,332 $(50,000) $(21,005) $(15,480) $(100,000) $(77,348) $(150,000) $(147,923) $(200,000) $(193,767) $(250,000) Overstock Retail Pre-Tax Income Wayfair Pre-Tax Income Source: Overstock and Wayfair 10-Ks and 10-Qs 25

26 Wayfair Summary 26
27 Quarterly Revenue and Growth ($,000) 600,000 40% 500,000 35% 400, , , ,435 30% 25% 300,000 17% 20% 200,000 15% 10% 100,000 4% 5% 5% 0 Q1-15 Q2-15 Q3-15 Q4-15 Q1-16 Q2-16 Q3-16 Q4-16 Q1-17 Revenue ($) Revenue growth (yoy) 0% 27
28 Quarterly Gross Profit and Growth ($,000) 110,000 55% 100,000 90,000 86,907 50% 45% 80,000 75,437 77,307 40% 70,000 35% 60,000 30% 50,000 25% 40,000 18% 20% 30,000 20,000 12% 15% 10% 10,000 2% 5% 0 0% (10,000) Q1-15 Q2-15 Q3-15 Q4-15 Q1-16 Q2-16 Q3-16 Q4-16 Q1-17 Gross profit ($) Gross profit growth (yoy) -5% 28
29 Quarterly Contribution* and Growth ($,000) 60,000 60% 50,000 48,169 50,020 49,960 50% 40,000 40% 30,000 30% 20,000 17% 20% 10,000 4% 10% 0 0% 0% (10,000) Q1-15 Q2-15 Q3-15 Q4-15 Q1-16 Q2-16 Q3-16 Q4-16 Q1-17 Contribution ($) Contribution growth (yoy) -10% * Non-GAAP see discussion and reconciliation in our earnings press release Contribution dollars = Gross profit less Sales & Marketing expense plus Club O Rewards and Gift Card breakage. 29
30 Quarterly Gross Margin and Contribution Margin* 25.0% 20.0% 18.9% 18.7% 20.1% 15.0% 10.0% 12.1% 12.1% 11.6% 5.0% 0.0% Q1-15 Q2-15 Q3-15 Q4-15 Q1-16 Q2-16 Q3-16 Q4-16 Q1-17 Gross margin Contribution margin * Non-GAAP see discussion and reconciliation in our earnings press release Contribution margin = Gross profit less Sales & Marketing expense plus Club O Rewards and Gift Card breakage as a percentage of revenue. 30
31 Technology and G&A Expenses $s and % of Revenue ($,000) 80,000 70, % 11.5% 11.9% 12.0% 60, % 51,602 50,000 40,000 43, % 47, % 6.7% 8.0% 6.0% 30, % 5.3% 5.2% 4.0% 20,000 10, % - Q1-15 Q2-15 Q3-15 Q4-15 Q1-16 Q2-16 Q3-16 Q4-16 Q % G&A Technology G&A and Tech (% of revenue) G&A (% of revenue) Technology (% of revenue) 31
32 Corporate Employees 1,400 1,200 1,143 1,152 1,000 1, Q1-15 Q2-15 Q3-15 Q4-15 Q1-16 Q2-16 Q3-16 Q4-16 Q1-17 Non-Tech Tech * Corporate employees excludes customer service and warehouse staff. 32
33 Operating and Free Cash Flow * (TTM) ($,000) 100,000 80,000 60,000 67,424 63,102 47,580 50,970 40,000 20,000 25,661 20,988 31,022 0 (20,000) (9,391) (13,063) (40,000) Q1-15 Q2-15 Q3-15 Q4-15 Q1-16 Q2-16 Q3-16 Q4-16 Q1-17 Cash flow from operations (TTM) Free cash flow* (TTM) Cash paid for new headquarters construction (TTM) * Non-GAAP see discussion and reconciliation in our earnings press release Free Cash Flow = Cash Flow from Operations less Expenditures for Fixed Assets. 33
34 GAAP TTM Inventory Turns and GMROI % 1800% % 1659% 1600% 1400% 1200% % 1000% % 600% % % 0.0 Q1-15 Q2-15 Q3-15 Q4-15 Q1-16 Q2-16 Q3-16 Q4-16 Q1-17 0% TTM Inventory turns TTM GMROI TTM Inventory Turns = TTM COGS / Average Inventory TTM GMROI = TTM Gross Margin % * TTM Revenue / Average Inventory 34
35 Customer Orders and Average Order Size* (#,000) 4,000 $300 3,500 $250 3,000 2,500 2,000 2,630 2,675 2,606 $174 $177 $195 $200 $150 1,500 $100 1, $50 0 Q1-15 Q2-15 Q3-15 Q4-15 Q1-16 Q2-16 Q3-16 Q4-16 Q1-17 Customer orders Average order size* $0 * Average Order Size is measured at the time of order, before promotional discounts and shipping revenue. 35
36 Unique Customers and Cost Per Customer (#,000) 3,000 $ ,500 $35.00 $ ,000 1,901 1,894 1,811 $ ,500 $20.78 $ ,000 $14.72 $16.61 $15.00 $ $ Q1-15 Q2-15 Q3-15 Q4-15 Q1-16 Q2-16 Q3-16 Q4-16 Q1-17 $- Unique customers Marketing $ / unique customers (cost per customer) 36
37
38 Overstock.com Ticker Symbols Common Shares - NASDAQ: OSTK Series A Preferred - Medici Ventures t0 platform: OSTKP Series B Preferred - OTCQB: OSTBP 38
39 all questions to: Follow Us On 39
Overstock.com, Inc. Q Financial Results Presentation. January 30, 2009
 Overstock.com, Inc. Q4 2008 Financial Results Presentation January 30, 2009 Safe Harbor The information presented herein may contain forward-looking statements. Our actual results may vary materially from
Overstock.com, Inc Financial Results Presentation. February 7, 2006
 Overstock.com, Inc. 2005 Financial Results Presentation February 7, 2006 Safe Harbor The following information contains, or may be deemed to contain, forward-looking statements (as defined in the U.S.
Tom Szkutak, SVP & CFO Amazon.com. Banc of America Securities 2005 Consumer Conference March 16, 2005
 Tom Szkutak, SVP & CFO Amazon.com Banc of America Securities 2005 Consumer Conference March 16, 2005 Amazon.com This presentation may contain forward-looking statements, including statements regarding
VeriFone Files Restated Reports
 VeriFone Files Restated Reports SAN JOSE, Calif. -- August 19, 2008 --VeriFone Holdings Inc. (NYSE: PAY) today filed its amended and restated quarterly report on Form 10-Q/A for the fiscal quarters ended
Annual Shareholder Meeting June 14 th, 2007
 Annual Shareholder Meeting June 14 th, 2007 6/13/2007 6:38 PM 2 Amazon.com This presentation may contain forward-looking statements, including statements regarding expectations of sales, gross margin,
Forward Guidance. Priceline.com issued the following guidance for the 2nd half of 2004:
 Priceline.com Reports 2nd Quarter 2004 Financial Results; Gross Travel Bookings Are $470.4 Million, Up 58% Year Over Year; Airline Ticket Unit Bookings Grow 60% NORWALK, Conn.--(BUSINESS WIRE)--Aug. 2,
CISCO SYSTEMS, INC. Q4 FY 2004 CONFERENCE CALL
 CISCO SYSTEMS, INC. Q4 FY 2004 CONFERENCE CALL August 10, 2004 2004, Cisco Systems, Inc. All rights reserved. 1 GAAP Reconciliation and Forward-Looking Statements GAAP RECONCILIATION During this presentation
The Global Exchange For Advertising November 2018
 The Global Exchange For Advertising November 2018 1 COPYRIGHT RUBICON PROJECT 2018 SAFE HARBOR FORWARD-LOOKING STATEMENTS This presentation and management's remarks may include, forward-looking statements,
Q1 FY19 Financial Update
 Q FY9 Financial Update Salesforce NYSE: CRM @Salesforce_ir Safe Harbor "Safe harbor" statement under the Private Securities Litigation Reform Act of 995: This presentation contains forward-looking statements
Extreme Networks FQ2 18 Financial Results
 Extreme Networks FQ2 18 Financial Results February 6, 2018 Cautionary Statement on Financial Measures Non-GAAP Measures: In preparing the accompanying information, the Company has excluded, where applicable,
Talend Investor Relations Presentation August 25, 2016
 Talend Investor Relations Presentation August 25, 2016 2016 Talend SA 1 This presentation and the accompanying oral presentation contain forward-looking statements. All statements other than statements
PayPal Reports First Quarter 2017 Results and Raises Financial Guidance for Full Year
 PayPal Reports First Quarter 2017 Results and Raises Financial Guidance for Full Year Q1 GAAP EPS increased 6% to $0.32, non GAAP EPS increased 19% to $0.44 $5 billion stock repurchase authorization announced
The Global Exchange For Advertising April 2018
 The Global Exchange For Advertising April 2018 1 COPYRIGHT RUBICON PROJECT 2018 Safe Harbor Forward-Looking Statements This presentation includes, and management's answers to questions during the conference
Investor Presentation
 Investor Presentation May 2018 Copyright 2018 Quotient Technology Inc. All Rights Reserved. Quotient, the Coupons.com logo and the Quotient logo are trademarks of Quotient Technology Inc. All other trademarks,
JOHN B. SANFILIPPO & SON, INC. NEWS RELEASE. Chief Financial Officer
 JOHN B. SANFILIPPO & SON, INC. NEWS RELEASE COMPANY CONTACT: Michael J. Valentine Chief Financial Officer 847-214-4509 Frank Pellegrino Sr. Vice President, Finance, Corporate Controller and Treasurer 847-214-4138
Investor Update Q Rob LoCascio CEO Dan Murphy CFO
 Investor Update Q4 2017 Rob LoCascio CEO Dan Murphy CFO Safe Harbor Provision Statements in this presentation regarding LivePerson that are not historical facts are forward-looking statements and are subject
EnPro Industries Investor Presentation. Engineered Products for a Demanding and Safer World
 EnPro Industries Investor Presentation Engineered Products for a Demanding and Safer World Q1 2018 1 Forward-Looking Statements Statements in presentation that express a belief, expectation or intention,
WINDSTREAM CORPORATION UNAUDITED CONSOLIDATED STATEMENTS OF INCOME (In millions, except per share amounts)
") (A) (B) (C) (D) WINDSTREAM CORPORATION UNAUDITED CONSOLIDATED STATEMENTS OF INCOME (In millions, except per share amounts) THREE MONTHS ENDED SIX MONTHS ENDED Increase Increase June 30, June 30, (Decrease)
(A) (B) (C) (D) WINDSTREAM CORPORATION UNAUDITED CONSOLIDATED STATEMENTS OF INCOME (In millions, except per share amounts) THREE MONTHS ENDED SIX MONTHS ENDED Increase Increase June 30, June 30, (Decrease)
Steelcase Inc. Reports Third Quarter Fiscal 2002 Results; Declares Quarterly Dividend of Six Cents Per Share
 Steelcase Inc. Reports Third Quarter Fiscal 2002 Results; Declares Quarterly Dividend of Six Cents Per Share GRAND RAPIDS, Mich.--(BUSINESS WIRE)--Dec. 19, 2001--Steelcase Inc. (NYSE:SCS) today reported
Teva Pharmaceutical Industries Ltd. J.P. Morgan Healthcare Conference. Kåre Schultz President and CEO January 7, 2019
 Teva Pharmaceutical Industries Ltd. J.P. Morgan Healthcare Conference Kåre Schultz President and CEO January 7, 2019 Cautionary Note Regarding Forward-Looking Statements 2 This presentation contains forward-looking
Benchmark Company, LLC One-on-One Investor Conference. May 30, 2013
 Benchmark Company, LLC One-on-One Investor Conference May 30, 2013 Safe Harbor Summary Except for historical information contained herein, the statements in this presentation are forward-looking and made
Investor Presentation
 Investor Presentation As of February 5, 2018 Advanced Signal Processing Products Safe Harbor Statement Except for historical information contained herein, the matters set forth in this presentation contain
THE GLOBAL EXCHANGE FOR ADVERTISING
 THE GLOBAL EXCHANGE FOR ADVERTISING JANUARY 2018 0 COPYRIGHT RUBICON PROJECT 2018 SAFE HARBOR Forward-Looking Statements This presentation may include, forward-looking statements, including statements
The Global Exchange For Advertising May 30, 2018
 The Global Exchange For Advertising May 30, 2018 1 COPYRIGHT RUBICON PROJECT 2018 SAFE HARBOR FORWARD-LOOKING STATEMENTS This presentation and management's prepared remarks during the conference call referred
Talend Investor Relations Presentation November 2017
 Talend Investor Relations Presentation November 2017 2017 Talend SA 1 This presentation and the accompanying oral presentation contain forward-looking statements. All statements other than statements of
Investor Presentation September 2015
 Investor Presentation September 2015 SAFE HARBOR This presentation includes forward-looking statements. Wayfair Inc. ( Wayfair or the Company ) has based these forward-looking statements largely on its
Supplemental Financial Schedules May 19, 2015
 Supplemental Financial Schedules May 19, 2015 The presentations and related schedules contain financial measures that are not calculated in accordance with generally accepted accounting principles (GAAP).
PerkinElmer Announces Financial Results for the First Quarter 2008
 PerkinElmer Announces Financial Results for the First Quarter 2008 -- Revenue of $482 million, up 20% over the prior year -- EPS from continuing operations of $0.20; Adjusted EPS of $0.29, up 21% over
EnPro Industries Investor Presentation. Engineered Products for a Demanding and Safer World
 EnPro Industries Investor Presentation Engineered Products for a Demanding and Safer World Q2 2018 1 Forward-Looking Statements Statements in presentation that express a belief, expectation or intention,
Disclaimer Forward-Looking Statements Industry and Market Data Non-GAAP Financial Information
 Disclaimer Forward-Looking Statements This presentation includes forward-looking statements within the meaning of the Securities Act of 1933, as amended (the Securities Act ), the Securities Exchange Act
Q3 FY2015 Earnings Call Investor Presentation
 1 Q3 FY2015 Earnings Call Investor Presentation November 4, 2015 Forward-Looking Statements This presentation and the accompanying oral presentation contain forward-looking statements that are based on
Financial Accounting. John J. Wild. Sixth Edition. Copyright 2013 by The McGraw-Hill Companies, Inc. All rights reserved.
 Financial Accounting John J. Wild Sixth Edition McGraw-Hill/Irwin Copyright 2013 by The McGraw-Hill Companies, Inc. All rights reserved. Chapter 04 Reporting and Analyzing Merchandising Operations Conceptual
ACCOUNTING FOR MERCHANDISING ACTIVITIES
 Chapter 6 ACCOUNTING FOR MERCHANDISING ACTIVITIES Presented by: Endra M. Sagoro Economic Faculty YSU endra_ms@uny.ac.id Operating Cycle of a Merchandising Company Cash Accounts Receivable 2. Sale of merchandise
Investor Presentation
 Investor Presentation As of August 2, 2017 Advanced Signal Processing Products Safe Harbor Statement Except for historical information contained herein, the matters set forth in this presentation contain
Priceline.com Reports Financial Results for 2nd Quarter 2006; Gross Travel Bookings and Gross Profits Increase over 60% Year-over-Year
 Priceline.com Reports Financial Results for 2nd Quarter 2006; Gross Travel Bookings and Gross Profits Increase over 60% Year-over-Year NORWALK, Conn.--(BUSINESS WIRE)--Aug. 7, 2006--Priceline.com Incorporated
Landstar System, Inc. April 20,
 For Immediate Release Contact: Kevin Stout Landstar System, Inc. www.landstar.com April 20, 2016 904-398-9400 LANDSTAR SYSTEM REPORTS FIRST QUARTER REVENUE OF $712 MILLION AND RECORD FIRST QUARTER DILUTED
JOHN B. SANFILIPPO & SON, INC. NEWS RELEASE. Chief Financial Officer
 JOHN B. SANFILIPPO & SON, INC. NEWS RELEASE COMPANY CONTACT: Michael J. Valentine Chief Financial Officer 847-214-4509 Frank Pellegrino Sr. Vice President, Finance, Treasurer and Corporate Controller 847-214-4138
FedEx Corp. Reports Strong Earnings Growth
 FOR IMMEDIATE RELEASE FedEx Corp. Reports Strong Earnings Growth MEMPHIS, Tenn., December 17, 2014... FedEx Corp. (NYSE: FDX) today reported earnings of $2.14 per diluted share for the second quarter ended
Ross Stores, Inc. Investor Overview November 2017
 Ross Stores, Inc. Investor Overview Disclosure of Risk Factors Forward-Looking Statements: This presentation contains forward-looking statements regarding expected sales, earnings levels, and other financial
Extreme Networks FQ1 19 Financial Results
 Extreme Networks FQ1 19 Financial Results November 2, 2018 Cautionary Statement on Financial Measures Non-GAAP Measures: In preparing the accompanying information, the Company has excluded, where applicable,
Calix Q Financial Results. February 13, 2018
 Calix Q4 2017 Financial Results February 13, 2018 Safe Harbor This presentation includes forward-looking statements within the meaning of the Private Securities Litigation Reform Act of 1995. Such statements
PURCHASES - GROSS METHOD
 INTERMEDIATE ACCOUNTING 321 MAY 21, 2016 TAD MILLER INVENTORY TEST 03. 2184 Round your answers to the nearest cent $xxx.xx PURCHASES - GROSS METHOD - PERIODIC INVENTORY SYSTEM On May 10 th Our Co. ordered
Safe Harbor Statement & Non-GAAP Information
 1 Safe Harbor Statement & Non-GAAP Information This presentation should be viewed in conjunction with PepsiCo s webcast presentation at the Consumer Analyst Group of New York Conference on February 20,
Christine Skold. Vice President, Investor Relations and Corporate Communications
 Christine Skold Vice President, Investor Relations and Corporate Communications 2 Safe Harbor Statement The Company claims the protection of the safe-harbor for forward-looking statements contained in
JOHN B. SANFILIPPO & SON, INC. NEWS RELEASE. Chief Financial Officer
 JOHN B. SANFILIPPO & SON, INC. NEWS RELEASE COMPANY CONTACT: Michael J. Valentine Chief Financial Officer 847-214-4509 Frank S. Pellegrino Sr. Vice President, Finance, Treasurer and Corporate Controller
Solarfun Reports First Quarter 2010 Results
 Solarfun Reports First Quarter 2010 Results SHANGHAI, May 26, 2010 /PRNewswire via COMTEX News Network/ -- Solarfun Power Holdings Co., Ltd. ( "Solarfun" or the "Company") (Nasdaq: SOLF), a vertically
Investor Presentation
 Investor Presentation As of August 1, 2018 Advanced Signal Processing Products Safe Harbor Statement Except for historical information contained herein, the matters set forth in this presentation contain
Fourth Quarter 2018 Investor Presentation
 Fourth Quarter 2018 Investor Presentation Forward-looking statements Forward-looking statements are subject to the safe harbor provisions of the Private Securities Litigation Reform Act of 1995. These
Investor Presentation Q2 2009
 THE PEOPLE BEHIND BIRT THE PEOPLE BEHIND BIRT THE PEOPLE BEHIND BIRT THE 1 Investor Presentation Q2 2009 BIRT Actuate Corporation THE PEOPLE 2009 BEHIND BIRT THE PEOPLE BEHIND BIRT THE PEOPLE BEHIND BIRT
FedEx Corp. Reports Higher First Quarter Net Income FedEx Ground Segment Revenues Grow 14 Percent
 FOR IMMEDIATE RELEASE FedEx Corp. Reports Higher First Quarter Net Income FedEx Ground Segment Revenues Grow 14 Percent MEMPHIS, Tenn., September 20, 2007... FedEx Corp. (NYSE: FDX) today reported earnings
Phoenix Technologies Ltd.
 Phoenix Technologies Ltd. Woodson (Woody) Hobbs Kaufman Bros. 11 th Annual Investor Conference New York, NY - September 4, 2008 Phoenix Technologies Ltd. Safe Harbor Statement With the exception of historical
Q4 and Fiscal Year 2018 Financial Results. Investor Presentation February 2019
 Q4 and Fiscal Year 2018 Financial Results Investor Presentation February 2019 Safe harbor statement This presentation contains forward-looking statements that are based on our management s beliefs and
CFO Commentary on First-Quarter 2013 Results
 Intel Corporation 2200 Mission College Blvd. Santa Clara, CA 95054-1549 CFO Commentary on First-Quarter 2013 Results Summary First quarter revenue of $12.6B was down 7% sequentially, in line with the average
Investor Overview Q Slides updated as of July 31, 2018
 Investor Overview Q2 2018 Slides updated as of July 31, 2018 Safe Harbor and Non-GAAP Financial Measures This presentation contains forward-looking statements within the meaning of federal securities laws,
CHAPTER 4 ACCOUNTING FOR MERCHANDISING OPERATIONS
 CHAPTER 4 ACCOUNTING FOR MERCHANDISING OPERATIONS Key Terms and Concepts to Know Income Statements: Single-step income statement Multiple-step income statement Gross Margin = Gross Profit = Net Sales Cost
INVESTOR PRESENTATION. November 2018
 INVESTOR PRESENTATION November 2018 Forward Looking Statements Disclaimer This press release contains forward-looking statements as that term is defined in the Private Securities Litigation Reform Act
Jefferies TMT Conference
 Jefferies TMT Conference Tarek Sherif, Chairman and CEO Cory Douglas, CFO May 9, 2013 2013 Medidata Solutions, Inc. 1 Safe Harbor Statement This presentation contains forward-looking statements within
C O R P O R AT E P R E S E N TAT I O N. NASDAQ: BBSI November 2014
 C O R P O R AT E P R E S E N TAT I O N NASDAQ: BBSI November 2014 FORWARD-LOOKING STATEMENTS Statements in this presentation about future events or performance, including gross revenues expectations for
Unleash Hidden Profits: Make Your Supply Chain Work for You
 Unleash Hidden Profits: Make Your Supply Chain Work for You Objective Learn how you can Reduce Working Capital Improve Cash Flow Increase Profits by improving how you manage your materials and supply chain
We help build companies of the future
 March 2018 Investor Presentation We help build companies of the future By Pat Goepel SAFE HARBOR STATEMENT (Under the Private Securities Litigation Reform Act of 1995) Statements made in this presentation
Third Quarter Fiscal 2013 Performance June 29, Financial results and company highlights Fourth quarter and fiscal year 2013 outlook
 Third Quarter Fiscal 2013 Performance June 29, 2013 Financial results and company highlights Fourth quarter and fiscal year 2013 outlook Safe Harbor Statement This presentation contains forward looking
Q1 Fiscal 2016 Statistics
 Q1 Fiscal 2016 Statistics FedEx Corporation Financial and Operating Statistics First Quarter Fiscal 2016 September 16, 2015 This report is a statistical supplement to FedEx s interim financial reports
WESCO International. Dave Schulz, Senior Vice President and Chief Financial Officer Raymond James 39 th Annual Investors Conference, March 7, 2018
 WESCO International Dave Schulz, Senior Vice President and Chief Financial Officer 2 Safe Harbor Statement All statements made herein that are not historical facts should be considered as forward-looking
Investor Presentation
 Investor Presentation Spring 2011 NYSE Amex: PCYG www.parkcitygroup.com Forward Looking Statement Statements in this presentation that relate to Park City Group's future plans, objectives, expectations,
Net income of $7.2 million, or $0.04 per share, compared to net loss of $43.2 million, or
 NEWS RELEASE Trading Symbol: TSX: SVM NYSE: SVM SILVERCORP FISCAL 2015 Q2 RESULTS: SILVER PRODUCTION UP 32%, NET INCOME OF $7.2 MILLION ($0.04 PER SHARE), CASH FLOW FROM OPERATIONS OF $20.1 MILLION ($0.12
Investor Relations Presentation. September 2014
 Investor Relations Presentation September 2014 Forward Looking Statements This presentation contains historical information and forward-looking statements within the meaning of The Private Securities Litigation
2017 EARNINGS PRESENTATION PeerStream, Inc. Ticker: PEER
 2017 EARNINGS PRESENTATION PeerStream, Inc. Ticker: PEER safe harbor This presentation is for discussion purposes only. Certain material is based upon third party information that we consider reliable,
Investor Presentation
 Investor Presentation June 2018 Safe Harbor Statement All statements, other than statements of historical fact included in this presentation, are forward-looking statements. When used in this presentation,
Investor Presentation April 30, 2018
 Investor Presentation April 30, 2018 Safe Harbor Statement The statements contained herein that are not historical facts are forward-looking statements within the meaning of the federal securities laws
Mylan. Raymond James 40 th Annual Institutional Investors Conference March 05, 2019
 Mylan Raymond James 40 th Annual Institutional Investors Conference March 05, 2019 Forward-Looking Statements This presentation contains forward-looking statements. These statements are made pursuant to
THE GLOBAL EXCHANGE FOR ADVERTISING
 THE GLOBAL EXCHANGE FOR ADVERTISING AUGUST 2017 0 COPYRIGHT RUBICON PROJECT 2017 SAFE HARBOR Forward-Looking Statements These materials include forward-looking statements concerning or implying growth
FORM 10-Q SECURITIES AND EXCHANGE COMMISSION Washington, D.C ERIE INDEMNITY COMPANY
 FORM 10-Q SECURITIES AND EXCHANGE COMMISSION Washington, D.C. 20549 QUARTERLY REPORT UNDER SECTION 13 OR 15(d) OF THE SECURITIES EXCHANGE ACT OF 1934 For quarter ended September 30, 2001 Commission file
Accounting 101 Class Notes Chapter 4 Accounting for Merchandising Operations
 I. WHAT IS A MERCHANDISER? Merchandiser vs. Service Business Wholesaler vs. retailer This chapter changes the focus from a service-oriented business to a merchandising form of business. Merchandisers buy
17 th B. Riley & Co. Investor Conference. May 2016 Hollywood
 17 th B. Riley & Co. Investor Conference May 2016 Hollywood Christopher Barnard President & Co-Founder NASDAQ: PCOM, TSX: PTS 1 SAFE HARBOR This presentation contains or incorporates forward-looking statements
Industry. Challenges. success. CONTROL single and. suit particular CONTROL. > Special Books and. Music Features. - Cash Sales.
 Books & Music Retailers INTRODUCTION Industry Challenges The most significant challenges facing books and music retailers are online commerce and electronic publishing. Music digital downloads instead
WILLIAM BLAIR GROWTH STOCK CONFERENCE. June 14, 2017
 WILLIAM BLAIR GROWTH STOCK CONFERENCE June 14, 2017 Safe Harbor Statement Statements made in this presentation which are not statements of historical fact are forward-looking statements and are subject
Fiscal 2018 Fourth Quarter Earnings Call April 10, 2019
 Fiscal 2018 Fourth Quarter Earnings Call April 10, 2019 Forward Looking Statements This presentation may contain forward-looking statements, including, but not limited to, anticipated net earnings per
IBM REPORTS 2011 SECOND-QUARTER RESULTS
 IBM REPORTS 2011 SECOND-QUARTER RESULTS o Diluted EPS: - GAAP: $3.00, up 15 percent; - Operating (non-gaap): $3.09, up 18 percent; o Revenue: $26.7 billion, up 12 percent, up 5 percent adjusting for currency;
FedEx Corp. Reports First Quarter Earnings FedEx Express Announces 2010 Rate Increase
 1 FOR IMMEDIATE RELEASE FedEx Corp. Reports First Quarter Earnings FedEx Express Announces 2010 Rate Increase MEMPHIS, Tenn., September 17, 2009... FedEx Corp. (NYSE: FDX) today reported earnings of $0.58
CISCO SYSTEMS, INC. Q4 FY 2005 CONFERENCE CALL
 CISCO SYSTEMS, INC. Q4 FY 2005 CONFERENCE CALL August 9, 2005 2005, Cisco Systems, Inc. All rights reserved. 1 GAAP Reconciliation and Forward-Looking Statements GAAP RECONCILIATION During this presentation
Revenue for retailers
 Revenue for retailers The new standard s effective date is coming. US GAAP September 2017 kpmg.com/us/frv b Revenue for retailers Revenue viewed through a new lens Again and again, we are asked what s
Energy Aerospace & Defense Industrial. First Quarter Investor Review
 Energy Aerospace & Defense Industrial First Quarter 2018 Investor Review Presented May 2, 2018 1 Safe Harbor This presentation contains forward-looking statements within the meaning of Section 27 A of
Extreme Networks FQ4 17 Financial Results
 Extreme Networks FQ4 17 Financial Results August 14, 2017 Cautionary Statement on Financial Measures Non-GAAP Measures: In preparing the accompanying information, the Company has excluded, where applicable,
FY2015 Third Quarter Earnings Call
 FY2015 Third Quarter Earnings Call MARCH 20, 2015 Forward-Looking Statement Forward-looking statements in this communication regarding our expected earnings performance and all other statements that are
Investor Update. September 2018 NASDAQ: PCOM TSX: PTS. Points International Ltd.
 Investor Update September 2018 Points International Ltd. NASDAQ: PCOM TSX: PTS Safe Harbor This presentation contains or incorporates forward-looking statements within the meaning of the United States
6) Items purchased for resale with a right of return must be presented separately from other inventories.
 Items purchased for resale with a right of return must be presented separately from other inventories.") Chapter 8 Cost-based Inventories and Cost of Sales 1) Inventories are assets consisting of goods owned by the business and held for future sale or for use in the manufacture of goods for sale. Answer:
Chapter 8 Cost-based Inventories and Cost of Sales 1) Inventories are assets consisting of goods owned by the business and held for future sale or for use in the manufacture of goods for sale. Answer:
Results for Q3 FY14 Ended December 31, 2014 (Financial version)
") Results for FY14 Ended December 31, 2014 (Financial version) Net One Systems Co., Ltd. TSE : 7518 Contents 1 Q1-3 FY14 (Apr-Dec 9months) P. 1-7 2 FY14 (Oct-Dec 3months) P. 8-11 3 Outlook of Consolidated
Results for FY14 Ended December 31, 2014 (Financial version) Net One Systems Co., Ltd. TSE : 7518 Contents 1 Q1-3 FY14 (Apr-Dec 9months) P. 1-7 2 FY14 (Oct-Dec 3months) P. 8-11 3 Outlook of Consolidated
Limelight Networks. Investor Overview. February 2016
 Limelight Networks Investor Overview February 2016 Safe Harbor Statement Certain statements in this presentation relate to future results that are forward-looking statements as defined in the Private Securities
For personal use only
 For personal use only FIRST HALF RESULTS AND GUIDANCE UPDATE 31 Dec 2015 25/2/16 Brian Shanahan CEO and Co-Founder Deborah Kelly Group CFO Summary: Proforma First Half Results FY16 Temple & Webster is
A Retail Merchant Loyalty Program
 A Retail Merchant Loyalty Program Table of Content A Retail Merchant Community Slides 3 4 2014 Loyalty Strategy Slides 5 11 Suggested Systematic Marketing Campaign Calendar Slides 12 13 New Services we
For personal use only
 ACN 166 025 047 UPDATED PRO-FORMA STATEMENT OF FINANCIAL POSITION RAISING DATED: 20 MAY 2014 PRO FORMA CONSOLIDATED STATEMENT OF FINANCIAL POSITION The following pro forma consolidated statement of financial
Third quarter and first nine months 2017 Results Release. October 19 th, 2017
 Third quarter and first nine months 2017 Results Release October 19 th, 2017 Safe harbor statement Any statements contained in this document that are not historical facts are forward-looking statements
Vipshop Holdings Limited Investor Presentation. February 2019
 Vipshop Holdings Limited Investor Presentation February 2019 Disclaimer This presentation contains forward-looking statements. These statements are made under the safe harbor provisions of the U.S. Private
PepsiCo: Frito-Lay North America. Presentation to Consumer Analyst Group of New York February 21, 2018
 PepsiCo: Frito-Lay North America Presentation to Consumer Analyst Group of New York February 21, 2018 1 Safe Harbor Statement & Non-GAAP Information This presentation should be viewed in conjunction with
Investor Presentation 2018 M A Y
 Investor Presentation 2018 M A Y 2 0 1 8 Safe Harbor Statement Any statements contained in this presentation and the accompanying oral presentation that do not describe historical facts may constitute
Fresenius Investor News
 health care worldwide August 3, 2006 Contact: Birgit Grund Fresenius AG Investor Relations Tel. ++49-6172 - 608 2485 Fax ++49-6172 - 608 2488 e-mail: ir-fre@fresenius.de Internet: www.fresenius-ag.com
FY2015 Results Presentation CEO & Managing Director - Julian Ogrin CFO - Leanne Wolski
 FY2015 Results Presentation CEO & Managing Director - Julian Ogrin CFO - Leanne Wolski 21 August 2015 Important notice and disclaimer This presentation includes information about the activities of amaysim
Investor Presentation December NYSE American: IEC
 Investor Presentation December 2018 NYSE American: IEC Cautionary Note Regarding Forward-Looking Statements References in this report to IEC, the Company, we, our, or us mean IEC Electronics Corp. and
> Complex pricing. needs of single CONTROL. and stock CONTROL. this brochure: - Cash Sales. - Deliveries - Gift Vouchers - Loyalty Programs
 Homewares and Furnishings Retailers INTRODUCTION Industry Challenges > Volatile demandd across the housing industry > Fluctuations in disposable incomes > Changing consumer tastes and preferences > Increased
FedEx Corp. Reports Second Quarter Earnings FedEx International Priority Package Revenues Grow 13 Percent
 FOR IMMEDIATE RELEASE FedEx Corp. Reports Second Quarter Earnings FedEx International Priority Package Revenues Grow 13 Percent MEMPHIS, Tenn., December 20, 2007... FedEx Corp. (NYSE: FDX) today reported