I-30 Express Lanes Survey Report
|
|
|
- Annabelle Jennifer Cross
- 6 years ago
- Views:
Transcription


1 Submitted by the TEXAS A&M TRANSPORTATION INSTITUTE I-30 Express Lanes Survey Report Authors: Mark Burris Namoo Han Tina Geiselbrecht Nick Wood
2
3 I-30 Express Lane Survey Report by Mark Burris Research Engineer Texas A&M Transportation Institute Namoo Han Graduate Assistant in Research Texas A&M Transportation Institute Tina Geiselbrecht Associate Research Scientist Texas A&M Transportation Institute Nick Wood Associate Transportation Researcher Texas A&M Transportation Institute Performed in cooperation with the North Central Texas Council of Governments and the Federal Highway Administration February 2015 TEXAS A&M TRANSPORTATION INSTITUTE The Texas A&M University System College Station, Texas
4
5 DISCLAIMER This research was performed in cooperation with the North Central Texas Council of Governments (NCTCOG) and the Federal Highway Administration (FHWA). The contents of this report reflect the views of the authors, who are responsible for the facts and the accuracy of the data presented herein. The contents do not necessarily reflect the official view or policies of the NCTCOG or TxDOT. This report does not constitute a standard, specification, or regulation. TABLE OF CONTENTS Page List of Figures... iv List of Tables... iv Executive Summary... 1 Introduction... 3 I-30 (Tom Landry Freeway)... 4 Programs in the Dallas-Fort Worth Area... 6 I-30 Survey Methodology... 7 Traveler Trip Characteristics... 7 Incentives... 7 Stated Preference Questions... 7 Stated Preference Question Design: Travel Time... 8 Stated Preference Question Design: Trip Time of Day Stated Preference Question Design: Toll Rate Travel Time and Toll Rate Selection Design Bayesian Efficient Design Random Adjusting Design Incentive Selection Design Demographics Pilot Program Survey Administration Survey Results Conclusion References Appendix A: I-30 Traveler Survey Instrument Appendix B: Examination of the Change in Mode Share Due to Managed Lane Incentives Introduction Model Development Results Elasticities Utilities Elasticities iii
6 LIST OF FIGURES Page Figure 1: Example of SP Question with EL Incentive... 4 Figure 2: Map of TEXpress Lanes in the Dallas-Fort Worth Area... 5 Figure 3: Example of an Express Lane set-up... 5 Figure 4: Incentives List as Presented in the Survey... 7 Figure 5: Stated Preference Questions... 8 Figure 6: Example of SP Question with EL Incentive Figure 7: Example of SP Question with Bus Incentive Figure 8: Example Advertisement Figure 9: Cumulative Number of Responses by Day LIST OF TABLES Page Table 1: I-30 General Purpose Lane Average Speeds (DALTRANS Detector Data Archive)... 9 Table 2: Speed Range Used for the Survey... 9 Table 3: Time of Day Factors Based on Trip Start Time Table 4: Attribute Levels Table 5: Prior Coefficients for the D-Efficient Design Table 6: D-Efficient Design Results Table 7: Allowable Range of Random Adjusting Design Attributes Table 8: Random Adjusting Design Attributes Table 9: Number of Referrals from Various Sites Table 10: Survey Response Averages iv
7 EXECUTIVE SUMMARY Express lanes (ELs), are facilities within freeways that impose tolls or other vehicle restrictions that ensure faster speeds, improve trip reliability, and generate revenue. These facilities are capable of improving performance on all lanes of a corridor, even when managing traffic flow for select lanes. The most frequently cited reason travelers will use ELs is to avoid congestion on the adjacent general purpose lanes (GPLs). Express Lanes can also have secondary benefits, which may include trip reliability, feeling safer, and potentially earning transit credits for each trip taken. Judging how the public will react to ELs and estimating their potential use is difficult. To better predict usage, a survey was developed to measure how travelers would respond to various incentives. This report examines responses from a survey administrated in the Dallas-Fort Worth area where an Express lane is under construction and is expected to open in the fall of Appendix A contains the survey instrument and Appendix B provides more specifics on the survey incentives and methodology. Dallas-Fort Worth survey respondents reported that they generally travel alone with over 70 percent indicating they did so for their most recent trip on I-30. The most commonly reported trip purpose was work-related commutes at 40 percent followed by recreational/social/shopping at 32 percent. Stated preference (SP) questions were used to help understand how travelers would respond to various incentives for using the Express Lane. Examples of incentives include loyalty rewards such as a free trip on the Express lane for every 10 paid trips or transit discounts during peak hours. The responses showed that there were definite differences in the how the various incentives were favored by the respondents. Stated preference question 1 had no incentives and almost 80 percent of respondents chose to drive alone on the general purpose lane. After incentives were introduced in stated preference question 2, this percentage dropped to 70 percent. The transit incentives did not encourage much additional use of the EL, while incentives offered for carpooling or driving alone during off-peak periods on the EL were more accepted. Although the transit incentives did not seem to be favored by the respondents, currently there is little transit service in the area so respondents may not be accustomed to using that mode. Respondents were then given the chance to sign up for a Pilot Program where the various incentives would be offered to the participants and subsequently rated by those respondents in a follow-up survey. This would help further understand which incentives were most effective. Page 1
8
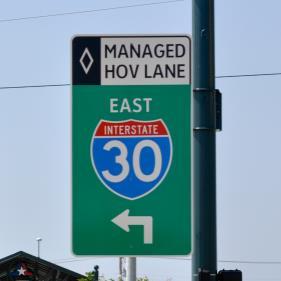
9 INTRODUCTION As congestion on freeways grows, Express Lanes (ELs) have become a more commonly used method to control and optimize freeway traffic. They are also known as managed lanes and are defined by the Federal Highway Administration (FHWA) as highway facilities or a set of lanes where operational strategies are proactively implemented and managed in response to changing conditions (1). They are managed to ensure free flow conditions on the lane or lanes. The main reason travelers choose to use ELs is that they are typically less congested and offer travel time savings. However, more recent studies have shown that travel time reliability is also an important aspect of express lane choice (2). This is done by restricting access, through tolls or limiting the types of users. One type of managed lane is the high occupancy toll (HOT) facility, which is tollfree for vehicles with the required number of occupants but tolls any single occupancy vehicles (SOVs) or other vehicles without the required occupancy wishing to use the lane. These tolls and/or occupancy requirements will typically change throughout the day based on the time of day and level of congestion. Although ELs are a relatively new concept, their popularity has grown and implementation is being considered by many agencies. Therefore, it is important to understand them and how they are used. Judging how the public will react to ELs and estimating their potential use is difficult. The initial operating characteristics can greatly impact how ELs are accepted and how it will be used by the public. The first few months of operating an Express Lanes are often referred to as the ramp-up period, when traffic volumes have yet to reach full potential. The ramp-up period can last up to the first few years as users become aware of how the Express Lanes function, alter their travel behavior, and realize the travel-time saving benefits of using the facility. For that reason, pricing and operating rules are commonly altered after opening to adjust for changes in user perceptions (3). Several incentive programs have been instituted to encourage carpooling and transit use on the lanes. A recent program, Cash for Commuters, in the Atlanta area offered up to $100 to commuters who shifted from driving alone to alternate modes (4). The program goals were to reduce congestion, improve air quality, and encourage drivers to choose alternative modes of travel. The Washington, D.C., metropolitan area implemented a similar incentive program run by Commuter Connections, with a goal to reduce congestion and encourage drivers of single occupant vehicles (SOV)s to either carpool or to use transit (5). A more recent and very similar program was implemented on the I-10 and I-110 freeways near downtown Los Angeles. The program converted the old high occupancy vehicle (HOV) lanes into HOT lanes and also improved transit availability by adding 59 new buses and expanding transit stations. Tolling began in November 2012 for I-110 and February 2013 for I-10 and is managed using a FasTrak account transponder. The pricing for those driving alone and wishing to use the Express Lanes varies between $0.25 and $1.40 per mile and is usually based on ensuring the EL does not exceed a certain level of congestion. Additionally, the I-10 express lane requires 3+ occupants during peak hours (5 a.m. 9 a.m. and 4 p.m. 7 p.m.) for a free trip (6). For the I-10 and I-110 Express Lanes, two loyalty programs were implemented for carpoolers and transit users to encourage travelers to carpool or use transit. For carpoolers, every trip taken while carpooling was recorded via FasTrak account and entered into a monthly lottery pool for a Page 3
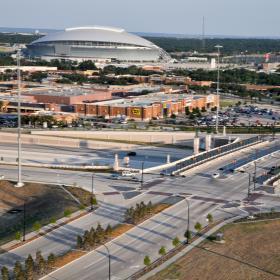
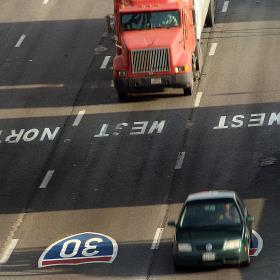
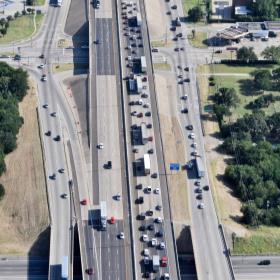
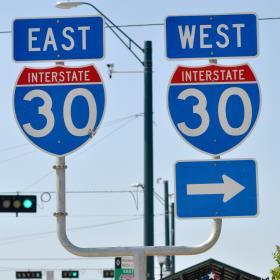
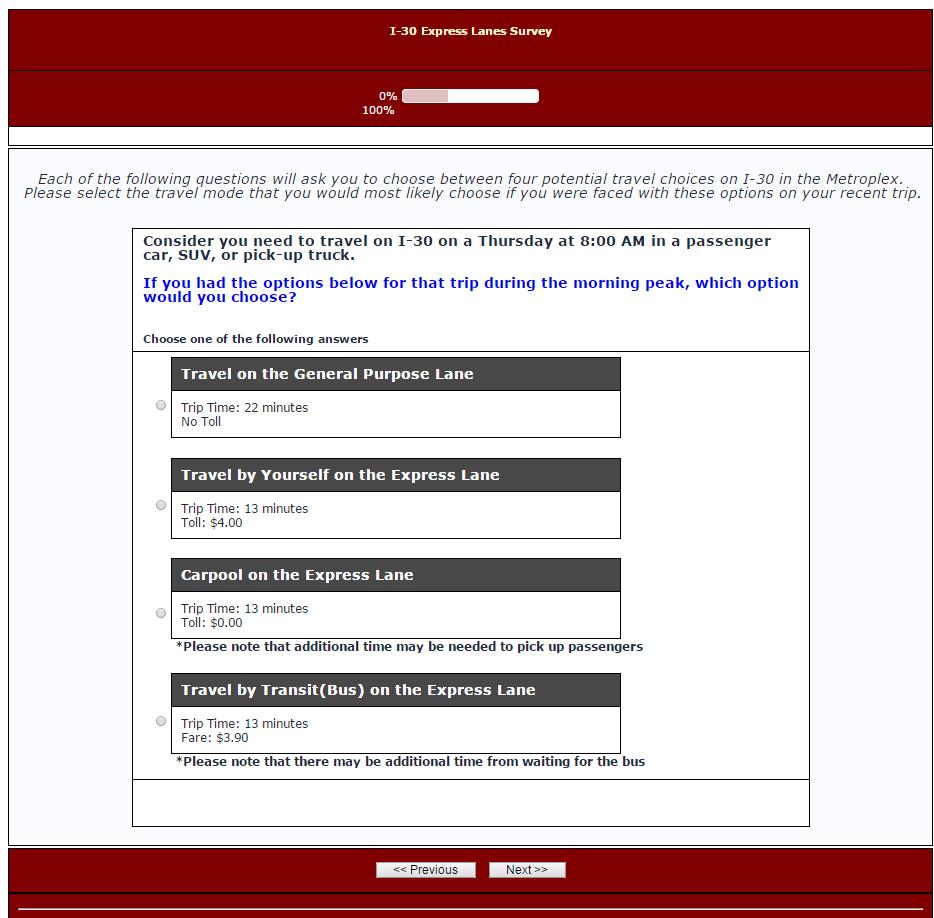
10 chance to win gift cards. Each carpool trip taken gave the account an additional chance to win. A separate pool was also created for 3+ carpools with more valuable rewards. Overall, there were a total of four lottery pools, two for I-10 and two for I-110. Transit users could earn a $5 toll credit by taking 32 one-way peak hour trips on either I-10 or I-110. Although there have been several programs around the country that have offered incentives to change travel modes, almost all have incentivized either alternative modes of transportation such as carpooling or transit or reductions in travel such as telecommuting. This survey for the I-30 Express Lanes tested incentives such as transit credit for multiple uses of transit or fare discounts during peak hours, but also included incentives for driving alone while on the ELs during offpeak periods such as rewards for loyal use. The incentives for driving alone on the ELs were the same ones given to carpoolers: a free trip for every 10 paid trips, various gifts such as gift cards or gas cards for using the Express Lane, and discounts to local businesses. These incentives were tested in the survey by offering the respondents four different choices for travel with some including incentives (see Figure 1). Figure 1: Example of SP Question with EL Incentive I-30 (TOM LANDRY FREEWAY) This study focused on travelers on the I-30 freeway between Arlington and Dallas, also known as the Tom Landry Freeway (see Figure 2). This section also goes through the cities of Grand Prairie and Arlington. Page 4
. ELs are currently being constructed with plans to open in October 2015.")

11 Figure 2: Map of TEXpress Lanes in the Dallas-Fort Worth Area The road is currently a six-lane divided freeway. ELs are being added in between GPLs (see Figure 3). ELs are currently being constructed with plans to open in October Other than being a major route inside the metropolitan area, it is notable for having both the Dallas Cowboys and Texas Rangers stadiums near it. (source: [8]) Figure 3: Example of an Express Lane set-up Page 5
12 PROGRAMS IN THE DALLAS-FORT WORTH AREA Try Parking It ( is the Dallas-Fort Worth region s Commuter Tracking and Ride-matching website that encourages commuters to use alternatives to driving alone to work such as ridesharing, biking, walking, telecommuting, and taking transit. Commuters are then encouraged to record information about those work-related trips. Try Parking It has been operated by the North Central Texas Council of Governments (NCTCOG) since In 2008, the ride-matching component of the website was launched, which allows commuters to locate both traditional carpool and vanpool matches. In March 2013, the program reached a milestone of 5 million miles saved and 10,600 vehicle trips saved. The program currently does not offer incentives; however incentives such as gift cards, airline tickets, and ipads were offered in the past during Commuter Challenge campaigns. These prize incentives were made available by participating sponsors. DFWConnectARide ( is the region s first casual carpooling website. Completed in 2014, the website allows commuters to locate and connect with other commuters for real-time carpool matches. DFWConnectARide was developed as a component of the Value Pricing Pilot Project along the I-30/Tom Landry corridor. Page 6

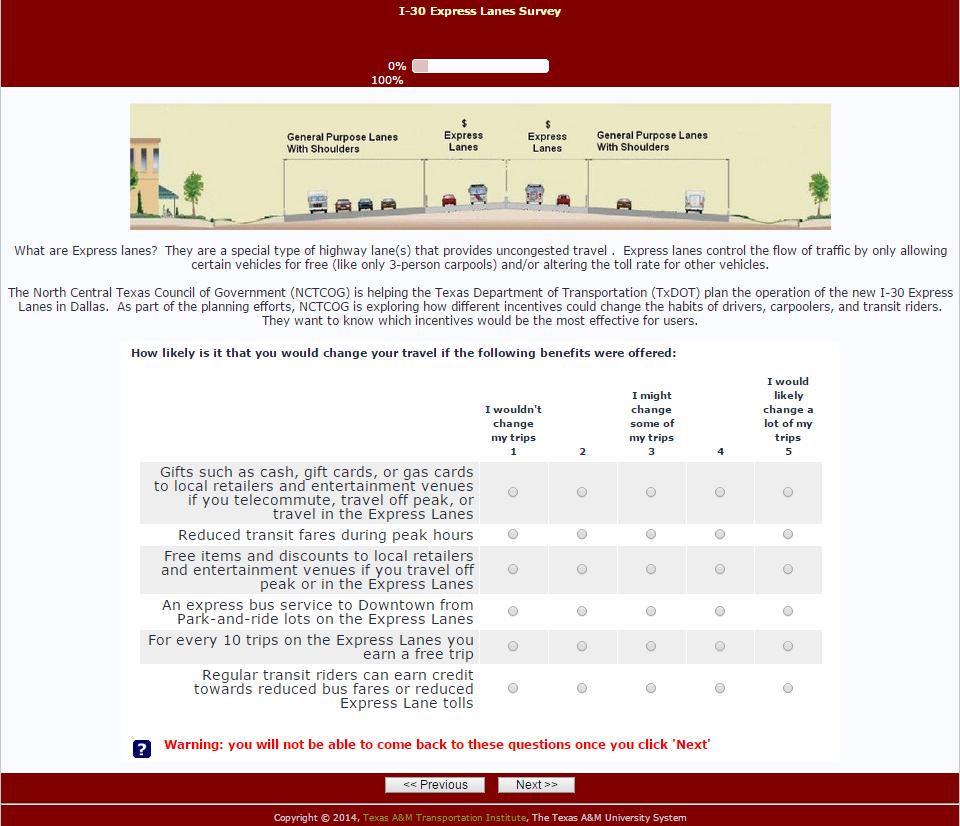
13 I-30 SURVEY METHODOLOGY TRAVELER TRIP CHARACTERISTICS The first question within the survey was a basic inquiry about the respondent s recent travel on the freeway. Questions on the survey include how often the respondent makes trips on the I-30 freeway, the associated trip purpose, and the time of the trip. Answers to these questions were then used later in the survey to set the stated preference scenarios. INCENTIVES After the initial basic questions, the next section of the survey provided a short definition about ELs and listed a series of potential incentives. Six incentives were shown and the respondent was asked to rate each on a scale of 1 5 (see Figure 4). A response of 1 indicated that the respondent would not change their trips while a response of 5 indicated the respondent would likely change a lot of their trips due to that incentive. Figure 4: Incentives List as Presented in the Survey The six incentives were presented in a random order so that the order they were shown would not influence their average rating. STATED PREFERENCE QUESTIONS In the stated preference questions section of the survey, three questions were asked to measure how people would respond if multiple travel options were available on I-30. In each question, four choices were given: Travel on the General Purpose Lane. Travel by Yourself on the Express Lane. Page 7
14 Carpool on the Express Lane. Travel by Transit (Bus) on the Express Lane. Travel on the GPL would be free, but have a longer travel time. The travel time on the other three would all be the same as they were all on the ELs. However, footnotes were added to indicate that extra time may be needed for carpooling and transit. This would be to either pick up and drop off passengers or wait at the bus stop (see Figure 5). Trip characteristics were either based on the answers given in the first section or were randomly generated if the respondent had not answered some of those trip detail questions from the first section. For example, if the day of the week and time of day were not provided, then a random weekday was chosen and the trip was set to either the AM or PM peak (50 percent chance of either) (Figure 5). However, if the day and time had been provided by the respondent, the first sentence of the question would read You described your most recent trip on I-30 as occurring on a day of the week at time in a vehicle. Day of week, time and vehicle were replaced with the respondents actual answers from the questions earlier in the survey. These characteristics set the basis of the stated preference questions. The next sections will explain how the travel time, toll rates, and incentives were generated. Figure 5: Stated Preference Questions Stated Preference Question Design: Travel Time Travel time is one of the most important factors a person considers when choosing their mode of transportation. Travel time depends on several factors including speed, distance, and time of day. To calculate the base travel time, the following equation was used: Page 8
 Typical speeds referenced in the survey were based on data obtained from freeway detectors on GPLs (see Table 1) and is summarized in Table 2.")
15 TT = D 60 V/TDF (1) Where: TT = total trip time (minutes) D = distance (miles) 60 to convert to miles/hour to miles/minute V = speed (mph) TDF = time of day factor, (see Trip Time of Day section below) Typical speeds referenced in the survey were based on data obtained from freeway detectors on GPLs (see Table 1) and is summarized in Table 2. Table 1: I-30 General Purpose Lane Average Speeds (DALTRANS Detector Data Archive) Table 2: Speed Range Used for the Survey Express lane (mph) Minimum speed Maximum speed General purpose lane (mph) Page 9
16 Stated Preference Question Design: Trip Time of Day The time of day that a trip is taken will have a significant effect on the total travel time due to the added congestion during peak periods. To account for this, a time of day factor was used. The factor is dependent on whether the GPLs or ELs are chosen and the time period the trip is taken (see Table 3). If the respondent provided the time the trip started, that input was used. However if the time was not provided, the survey defaulted to the peak period (randomly choosing between the AM and PM peak). This factor was then used in the Travel Time equation (see equation 1) to calculate the total travel time for the scenario. Table 3: Time of Day Factors Based on Trip Start Time Time of Day Factors Trip Start Time Time of Day General Purpose Express Lane Lane 6 AM to 7 AM Morning Shoulder Period 7 AM to 9 AM Morning Peak Period AM to 10 AM Morning Shoulder Period 10 AM to 4 PM Mid-Day PM to 5 PM Evening Shoulder Period 5 PM to 7 PM Evening Peak Period PM to 8 PM Evening Shoulder Period 8 PM to 6 AM Night Because ELs are managed, the travel time is less and is more consistent throughout the day. Therefore, it is less impacted by congestion and the time of day factor. The Time of Day column in Table 1 indicates what was shown to the respondent to help describe the hypothetical trip. Stated Preference Question Design: Toll Rate The toll rate was based on values taken from the existing LBJ TEXpress Lanes on I-635 and the bus fares on the Dallas Area Rapid Transit (DART). The LBJ TEXpress is based on real-time demand but generally ranges from 10 cents to 25 cents per mile during off-peak hours and 45 cents to 75 cents per mile during peak hours (9). The difference between the toll rates on the LBJ TEXpress and those for the I-30 Express Lanes are based on the operating goals for each facility. The LBJ TEXpress was developed as a public-private partnership with a strong revenue generation goal, whereas the I-30 Express Lanes seek to maximize throughput. Tolls for facilities with a strong revenue goal tend to have higher tolls, because more money can be taken from a smaller user base that has a high inelasticity due to a strong aversion for travel delay. Therefore, the starting toll level shown in the SP questions may be a bit higher than what the rate on I-30 ELs may be, but it is in the range of expected rates based on the other facility in the area. The DART currently charges $2.50 for a 2-hour pass that can be used locally, and $5.00 for a 2-hour pass that can be used regionally. DART also offers an off-peak pass (9:30 a.m. to Page 10
17 2:30 p.m.) that costs $1.75 for local trips and $3.50 for regional trips (10). Using these numbers, ranges for both the toll and price of transit were developed that could be used for the survey. Two different methods were used to determine the exact values that would be used, described in more detail in the following sections. TRAVEL TIME AND TOLL RATE SELECTION DESIGN The travel times and the toll rates for the SP questions were determined through a randomly selected process for each respondent. Specifically, the two random generation methods deployed were the Bayesian Efficient design and a Random Adjusting design. Each method had a 50 percent chance of being selected for the participant. These designs for each method are discussed in the following sections. Bayesian Efficient Design One way the survey s attributes (travel time, toll, transit fare, and incentives) were generated was by using the Bayesian Efficient design. In this design, the attributes travel time (based on speed), toll rate, and transit fare were estimated to minimize the standard errors for the parameters while maximizing the t statistic. The asymptotic standard errors are minimized for the discrete choice models. In this survey, the D-error efficiency criterion was used, so the Bayesian Efficient design was determined by minimizing the D-error of the asymptotic variance-covariance (AVC) matrix in the discrete choice model. The AVC matrix is the inverse of the Fisher information matrix in a discrete choice model (11). The parameters (coefficients or β values) for the survey attributes, such as toll and travel time, are not known before conducting the survey. Therefore, prior values of attributes from previous studies and literature must be used to estimate the parameters. In this survey, the priors were assumed to have normal distributions with non-zero means. The mean values were obtained from a previous Transit to SOV study (12). The Bayesian error was calculated using equation 2: D b error = detavc β Where: β θ = joint distribution of the assumed parameter priors θ= the corresponding parameters of the distribution K = the number of parameters in the model 1 β X K β θ dβ (2) The integral is computationally difficult so it can approximated by several different methods, including the use of Halton draws to simulate the distributions (11). This was the method used for this study. Once the Halton draws are completed, R independent draws are taken from each of the prior distributions of the K-parameters and the D b -error is then calculated using equation 3: D b error = R r=1 detavc 1 β r X K /R (3) Page 11
18 Where: β r = [β 1 1,, β k r ] R = the draw (1, 2,, R) The values for the attribute levels (see Table 5) were obtained from toll rates as described above in the section Toll Rate and the speeds were obtained as described in the section Travel Time. The cost for carpooling was set to be either free or a fraction of the full toll rate. Transit was assumed to only travel on the ELs. For this survey, the N-Gene software program was used to generate the D b -efficient designs. By inputting the attribute levels, means, and standard deviations, the program generates values of attributes such as toll rate and travel speed to be used in the survey. The stopping point is based on how small of an error is desired. A random parameter panel logit (rppanel) was specified for the discrete choice model and the priors were then simulated using 400 Halton draws from the prior distribution. The resulting Bayesian design is shown in Table 6 and has 24 rows divided into 8 blocks of 3 rows each. A respondent would be given SP questions with the attributes from all three rows out of a randomly chosen block. The D b -error for the design was found to be 0.74, which indicates an efficient design. Table 4: Attribute Levels Attribute Lane Levels Travel Time (minutes) Express Lane 8; 8.57; 9.23; 10; General Purpose Lane 10; 10.91; 12; 13.33; 15 Toll Rate (cents/mile) Express Lane 30, 35, 40, 45, 50 General Purpose Lane 0, 0, 15, 25 Transit Fare (dollars) Express Lane 3.5, 4.0, 4.5, 5 General Purpose Lane N/A Attribute Travel Time (minutes) Toll Rate (cents) Transit Fare (dollars) Table 5: Prior Coefficients for the D-Efficient Design Attribute Levels Express Lane 8; 8.57; 9.23; 10; General Purpose 10; 10.91; 12; 13.33; 15 EL Drive Alone 30, 35, 40, 45, 50 EL Carpool 0, 0, 15, 25 General Purpose 0 Transit 3.5; 4; 4.5; 5 Mean Value of Priors Standard Deviation of Priors Page 12
19 Mode Block General Purpose Lane Speed (mph) Table 6: D-Efficient Design Results Speed (mph) Toll Rate (single occupant) (cents/mile) Express Lane Toll Rate (carpool) (cents/mile) Transit Fare (dollars) Random Adjusting Design The other method used to select the attribute levels was by an adaptive random adjusting design. In this method, for the first SP question the attributes (initial speed and toll rate) are generated randomly from a range. This range was based on the speeds and toll costs obtained from the LBJ TEXpress and the DART transit rates as described above in the section Stated Preference Question Design: Toll Rate. The speed and toll rate in the following SP questions are then adjusted based on what the respondent chooses as the mode of transportation in the previous SP question. For example, if GPL is chosen in question 1, then the toll rate would be multiplied by a randomly generated factor of 0.35 to 0.7. If EL was chosen, then the toll rate would be multiplied by a random amount between 1.3 and 1.9. Page 13
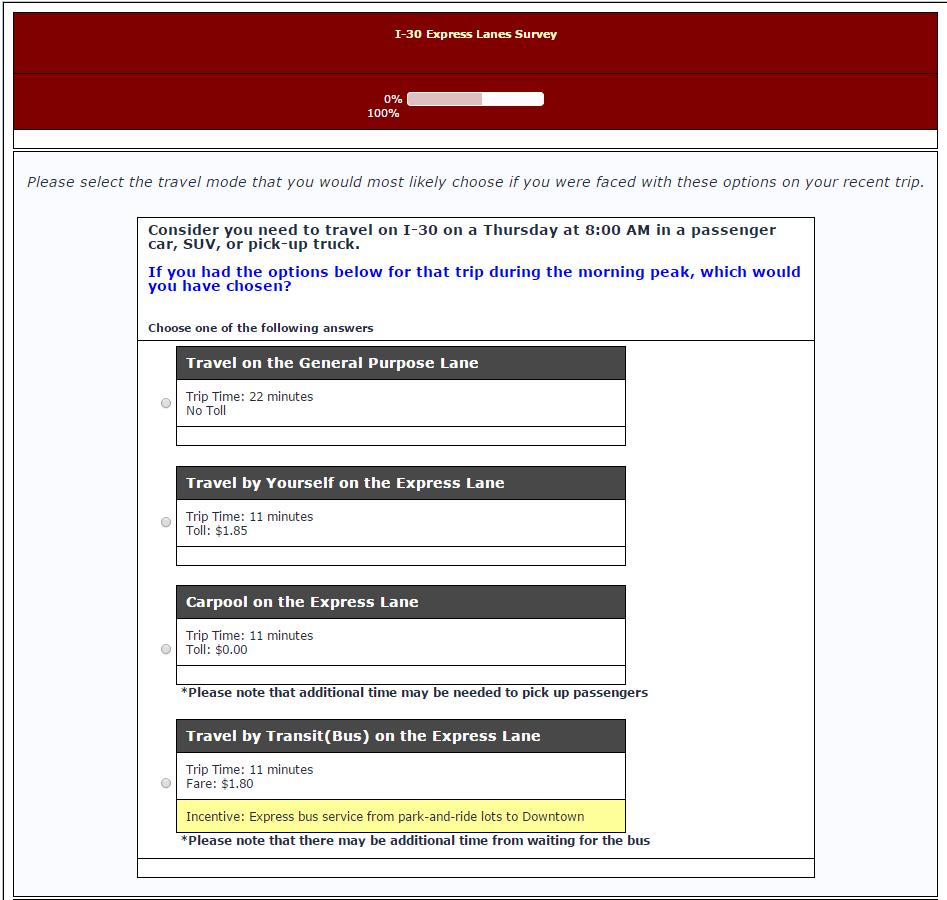
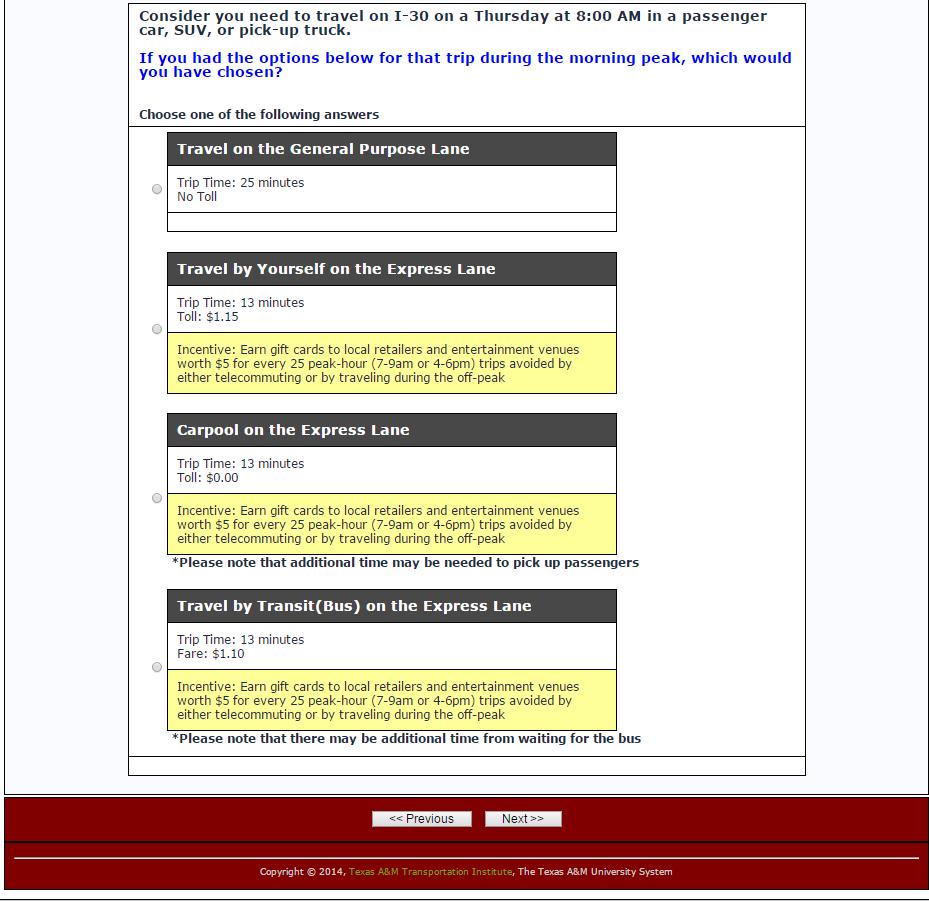
20 For the second and third questions, the speed would again be randomly generated using the same method as in the first question. Constraints were added to ensure the toll would not be either too high or too low (see Table 7). The initial speed and toll rates were again set based on data obtained from detectors on the I-30 freeway and current rates used for the LBJ TEXpress and the DART (see Table 8). Table 7: Allowable Range of Random Adjusting Design Attributes Mode Minimum Maximum Toll Rate (single occupancy) (cents/mile) Toll Rate (carpool) (cents/mile) 0 50 Transit Fare (dollars) Table 8: Random Adjusting Design Attributes Attribute Lane Range Speed (mph) Express Lane 55 + (0 to 20) General Purpose Lane 40 + (0 to 20) Toll Rate (cents/mile) Express Lane 30 + (0 to 20) General Purpose Lane 0 Transit Fare (dollars) Express Lane (0 to 1.5) General Purpose Lane N/A INCENTIVE SELECTION DESIGN The main focus of this survey was to determine how travelers would react and adjust their behavior if incentives for travel on EL were provided. For example, if a free trip on EL was offered after every 10 paid trips, would drivers be more willing to use ELs? To do this, incentives were added to the second and third SP questions. The incentive was chosen randomly among the six to ensure that every incentive would get equal consideration. All but one incentive had a numerical aspect. The value of the numerical aspect was randomly selected from a range. The six incentives and their incentive values were as follows: Earn a free trip for every 8, 9, 10, 11, or 12 paid trips taken on the Express Lanes. Earn gift cards worth $5 for every 20, 25, 30, or 35 peak-hour trips saved by either telecommuting or by not traveling during the peak hours (7 9 a.m. or 4 6 p.m.). 5 percent, 10 percent, 15 percent, 20 percent, or 25 percent discount offered through select businesses. For every 20, 25, 30, or 35 trips taken by transit, $5 in credits that can be used on ELs. A transit fare discount of 10 percent, 20 percent, or 30 percent. Express bus service from park-and-ride lots to downtown. The first three incentives applied to driving a personal vehicle on ELs (see Figure 6), while the last three only applied to the Transit (Bus) option (see Figure 7). Page 14


21 Figure 6: Example of SP Question with EL Incentive Figure 7: Example of SP Question with Bus Incentive DEMOGRAPHICS The last set of questions asked about the socioeconomic and demographic characteristics of the respondent (gender, age, race, education level, and household income). There was also a text box at the end for any comments or suggestions related to transportation on I-30. Page 15
22 PILOT PROGRAM The final part of the survey introduces the pilot program to the survey respondent. Once the I-30 ELs are constructed, the pilot program would offer various incentives to the participants. The incentives offered would be the same as, or similar to, the ones presented in the survey and discussed in the previous section of this report. Exactly which incentives are offered would be based on the survey responses and the ability to implement the various discounts and benefits. The respondents who sign up and participate in the program would be given a follow-up survey at a later date to collect data on how effective the incentives actually were and how it compared to SP responses. This will help determine what the most useful incentives are for maximizing the use and efficiency of the ELs. Page 16
23 SURVEY ADMINISTRATION The survey was developed and distributed using LimeSurvey software, available through a free website. LimeSurvey was used to both create the survey and collect the responses. The URL was used to direct people to the online survey. The survey was available from August 1, 2014, until November 30, The initial effort to garner responses was from August 1 to September 15 and included an incentive to encourage responses. Three randomly chosen respondents received a $250 MasterCard gift card at the end of that initial effort. Along with the random prize drawing, advertisements (as shown in Figure 8), and press releases were sent out to various transportation agencies, websites, and media outlets throughout the Dallas- Fort Worth area. Print advertisements were purchased in the Dallas Morning News Neighbors section and the main section of the paper for publication on September 5 and 12, both Fridays. Articles were placed in NCTCOG and North Texas Tollway Authority (NTTA) newsletters that were distributed in print and via . Social media was also used to advertise. Twitter was used to target media and community groups, and Facebook was used by TTI, NCTCOG, and NTTA to post links to the survey. Additionally, advertisements were posted on Craigslist. The initial effort garnered fewer responses than desired and thus the survey remained online past the original anticipated end date of September 15. Researchers and NCTCOG staff felt that another push to let people know of the survey might be able to garner additional responses. This effort was successful and the survey attracted several hundred more responses prior to its closing on November 30, Researchers used the LimeSurvey software to examine where survey referrals originated. The locations with the most number of referrals were government websites such as arlington-tx.gov (city of Arlington), gptx.org (city of Grand Prairie), and drivingnorthtexas.com, which is operated by the NTTA (see Table 9). The social media websites Facebook and Twitter were also successful in generating referrals. Traditional newspaper and television station websites such as cbslocal.com, fwbusinesspress.com, and opinionarlington.com garnered a small number of referrals. Table 9: Number of Referrals from Various Sites Referral Address Referral Count arlington-tx.gov 215 cbslocal.com 3 dallascitynewsroom.com 3 drivingnorthtexas.com 148 facebook.com 70 fwbusinesspress.com 5 gptx.org 38 nctcog.org 38 opinionarlington.com 5 reagan.com 2 texas.dotnewz.com 1 tryparkingit.com 2 twitter.com 13 uta.edu 3 Page 17
.")
24 Figure 8: Example Advertisement A second outreach effort occurred in November and lasted until the end of the survey on November 30, Although this push did not include an incentive for responses, it still garnered a significant amount of responses (see Figure 9) CUMULATIVE NUMBER OF RESPONSES BY DAY 1000 TOTAL NUMBER OF RESPONSES Figure 9: Cumulative Number of Responses by Day After the survey was closed to the respondents, data from the survey were checked to ensure that responses were legitimate and could be used in the analysis. Since a monetary prize was used as an incentive, there was a possibility that respondents could complete the survey multiple times to better their chances of winning. Therefore, it was important to filter out any responses that were DATE Page 18
25 very likely to be duplicates. It was also important to check the partially completed responses to determine which of those were usable. The following methods were used to filter unusable responses: Time started/ended and IP address were used to see if anyone took the survey multiple times in a row. o Most repeated IP addresses had differing answers and were assumed to be different family members or employees at the same company. These were all kept. o Several instances were found where someone started the survey, quit before finishing, then later started a new response and completed the survey. Any previously completed questions were answered in the same way. Therefore the partial responses (initial survey entry) were removed. Time started/ended was used to see how quickly people completed the survey. Any that took less than 3 minutes were further scrutinized. However, if nothing else was suspicious it was left in the dataset. A total of 173 responses were under three minutes. six were removed, mostly because although they completed the survey, they skipped almost all the questions. Any responses with suspect zip codes were removed: one response had a 3 digit zip code and was removed. Next, surveys that were not completed were examined to determine if enough of the survey had been completed that it was still useful. If all but the demographics section was complete, including all three SP questions, the response was kept. If the whole survey including the demographics section was completed, but the respondent did not answer all the SP questions, it was removed. After filtering using the above methods, out of the 894 completed surveys, 10 were removed for reasons stated above. Out of the 161 incomplete responses, 14 were kept and the rest were removed. Overall, after filtering, 898 responses were kept out of 1055 total responses. Page 19
26
27 SURVEY RESULTS Once the data were filtered, the next step was to begin analysis of the data. Table 10 summarizes traveler characteristics, incentive ratings, stated preference answers, and demographics from the survey. Table 10: Survey Response Averages Survey Design Type: Efficient A Random B All Characteristic Percentage of Travelers How Frequently do you travel on the I-30 (Tom Landry) Freeway? Multiple times per day About once a day A few times per week Once a week A few times per month I have not used I-30 in the past 6 months What was the purpose of your most recent trip on I-30? Commuting to or from work Recreational/Social/Shopping Major Sports game Work Related (non-commuting) Class or School Other On what day of the week was your most recent trip? Sunday Monday Tuesday Wednesday Thursday Friday Saturday Average respondent trip time (minutes) % Passenger vehicle, SUV or Pick-up truck How many people were in the vehicle? Page 21
28 Survey Design Type: Efficient A Random B All Characteristic Percentage of Travelers Was the respondent the driver or passenger? Driver Passenger Average time to pick up passenger (minutes) Passenger s relation to respondent Neighbor Child Co-worker Adult family member Commuter in a casual carpool Other Incentives (Weighted Average) C For every 10 trips on the Express Lanes you earn a free trip Gifts such as cash, gift cards, or gas cards to local retailers and entertainment venues if you telecommute, travel off peak, or travel in the Express Lanes Free items and discounts to local retailers and entertainment venues if you travel off peak or in the Express Lanes Regular transit riders can earn credit toward reduced bus fares or reduced Express Lane tolls Reduced transit fares during peak hours An express bus service to Downtown from Park-and-ride lots on the Express Lanes Time of Day of Trip Peak Shoulder Off-Peak Efficient Design block assignment Stated Preference (SP) Question 1 Average GPL travel time for SP Average Express Lane travel time for SP Average drive alone toll for SP Page 22
29 Survey Design Type: Efficient A Random B All Characteristic Percentage of Travelers Average carpool toll for SP Average transit fare for SP Mode Choice in SP1 General Purpose Lane Managed Lane Drive Alone Managed Lane Car Pool Transit Stated Preference Question 2 Average GPL travel time for SP Average Express Lane travel time for SP Average drive alone toll for SP Average carpool toll for SP Average transit fare for SP Incentives For every X trips, earn one free trip Number of times offered % of the time chosen when offered Average X Average X when chosen Average X when not chosen Gifts such as cash or gift cards for every X trips Number of times offered % of the time chosen when offered Average X Average X when chosen Average X when not chosen X% discount to local businesses Number of times offered % of the time chosen when offered Average X Average X when chosen Average X when not chosen $5 credit for every X trips taken by transit Number of times offered % of the time chosen when offered Average X Average X when chosen Average X when not chosen Page 23
30 Survey Design Type: Efficient A Random B All Characteristic Percentage of Travelers Transit discount of X% Number of times offered % of the time chosen when offered Average X Average X when chosen Average X when not chosen Express Bus Lanes Number of times offered % of the time chosen when offered Mode Choice in SP2 General Purpose Lane Managed Lane Drive Alone Managed Lane Car Pool Transit Stated Preference Question 3 Average GPL travel time for SP Average Express Lane travel time for SP Average drive alone toll for SP Average carpool toll for SP Average transit fare for SP Incentives For every X trips, earn one free trip Number of times offered % of the time chosen when offered Average X Average X when chosen Average X when not chosen Gifts such as cash or gift cards for every X trips Number of times offered % of the time chosen when offered Average X Average X when chosen Average X when not chosen X% discount to local businesses Number of times offered % of the time chosen when offered Average X Average X when chosen Average X when not chosen Page 24
31 Survey Design Type: Efficient A Random B All Characteristic Percentage of Travelers $5 credit for every X trips taken by transit Number of times offered % of the time chosen when offered Average X Average X when chosen Average X when not chosen Transit discount of X% Number of times offered % of the time chosen when offered Average X Average X when chosen Average X when not chosen Express Bus Lanes Number of times offered % of the time chosen when offered Mode Choice in SP3 General Purpose Lane Managed Lane Drive Alone Managed Lane Car Pool Transit Demographics Gender Male Female Age Ethnicity White/Caucasian Hispanic/Latino African American Asian American Native American Other Page 25
32 Survey Design Type: Efficient A Random B All Characteristic Percentage of Travelers Education Less than high school High school graduate Some college or vocational school College graduate Post-graduate college Household Income Less than $10, $10,000 $14, $15,000 $24, $25,000 $34, $35,000 $49, $50,000 $74, $75,000 $99, $100,000 $199, $200,000 or more Prefer not to answer A This is the Bayesian Efficient Design (Db- efficient design) method discussed above B This is the random adjusting design method discussed above. Approximately half of the respondents received each of these design methods, which varies the attributes given in the stated preference questions in different ways. C Ranked from 1 (I wouldn t change my trips) to 5 (I would likely change a lot of my trips) All tolls and fares are in dollars. All travel times are in minutes. Survey respondents ranged from frequent users of the Tom Landry Freeway to travelers who rarely use the freeway, with plenty of respondents in all categories. Virtually all of the travelers (99.2 percent) traveled using a passenger vehicle, SUV, or pick-up truck. Over half of the trips were work-related (55 percent when commuting and non-commuting trips are taken into account). From the weighted averages of the incentives, it can be seen that some incentives were more likely to encourage travelers to use the EL than others. The incentives that were rated highest (most likely to encourage managed lane use) were for every 10 trips on the Express Lanes you earn a free trip and gifts such as cash, gift cards, or gas cards to local retailers and entertainment venues if you telecommute, travel off-peak, or travel in the Express Lanes with weighted averages of 2.34 and 2.38, respectively. Transit incentives were rated lower, with transit riders can earn credit toward reduced bus fares and express bus service to Downtown from Park and Ride lots having a weighted average of 1.91 and 1.83, respectively. The transit incentive most likely to encourage EL use was reduced transit fares during peak hours with a weighted average of From the SP questions, it is clear that driving alone is the preferred method of travel on the Tom Landry Freeway. Without incentives in the first SP question, almost 90 percent of respondents chose to drive alone on either the general purpose lane or on the managed lane. However, with Page 26
33 the introduction of incentives in SP2 and SP3, these numbers decreased. The number of respondents that chose the option of driving on the GPL decreased from 79 percent in SP1 to 69 percent in SP2 to 66 percent in SP3. It is likely that the decrease was due to both the incentives offered and the lower toll prices. This is because more respondents who received the random adjusting survey design shifted from GPL to EL. Respondents who received the survey with random adjusting SP question attributes had lower toll costs than the D-eff survey design. This is because the toll was adjusted downward if the respondent chose a non-toll option in the previous SP question. The value of the incentive made minimal impact on the respondent s decision. This is shown by the average value of the incentives when offered, when chosen, and when not chosen. There is not much difference in the value of the incentive among the three. For example, the averages for the SP2 incentive for every X trips, earn on free trip are all 10.0 or 10.1, indicating that the value of the incentive may have not had a large enough range. Page 27
34
35 CONCLUSION This report overviews the creation and administration of a survey for I-30 Tom Landry freeway travelers. The purpose of the study was to develop an understanding of how travelers would respond to various incentives for using ELs so that the future I-30 ELs could be better managed. Most travelers were found to be commuting or on work-related trips, although a large amount of trips were found to be recreational, social, or shopping. Because most trips were solo drivers, it is important to see how they react to the various incentives for both solo driving and alternate modes. The incentive questions and SP questions showed that some incentives such as gift cards and gas cards were most highly accepted while transit incentives were not as impactful. Page 29
36
37 REFERENCES 1. Federal Highway Administration (FHWA). Managed Lanes and HOV Facilities. Accessed at: Accessed on January 16, Devarestty, P.C., Burris, M., and Shaw, W.D. The Value of Travel Time and Reliability - Evidence from a Stated Preference Survey and Actual Usage. Transportation Research Part A: Policy and Practice. 46 (8), pp , Kriger, D. S., Shiu, S., and Naylor, S. Estimating toll road demand and revenue Transportation Research Board, Commuter Rewards: Cash for Commuters. Accessed at: Accessed on December 10, Rogers, J., Ramfos, N., and Sivasailam, D. National Capital Region Transportation Planning Board (TPB) Commute Connections Carpool Incentive Demonstration Project Study. Metropolitan Washington Council of Government. DC incentives Metro ExpressLanes. How it works: Accessed on January 25, TEXpress. TEXpress Lanes System Map: Accessed on February 11, Santa Clara Valley Transportation Authority. VTA Express Lanes: SR 237 Express Lanes Project: express-lanes-project. Accessed February 11, LBJ TEXpress. How pricing is determined: Accessed on July 1, DART Fares. Pricing from: Accessed on July 1, Bliemer, M.C.J., Rose, J.M., Hess, S. Approximation of Bayesian efficiency in experimental choice designs. Journal of Choice Modelling 1, Chum, G. L. and Burris, M. W. Potential Mode Shift from Transit to Single-Occupancy Vehicles on a High-Occupancy Toll Lane. Transportation Research Record: Journal of the Transportation Research Board, No. 2072, pp Page 31
38

39 APPENDIX A: I-30 TRAVELER SURVEY INSTRUMENT Page 33
40 Page 34
41 Page 35
42 Page 36
43 Page 37
44 Page 38
45 Page 39
46 Page 40
47 Page 41
48
49 APPENDIX B: EXAMINATION OF THE CHANGE IN MODE SHARE DUE TO MANAGED LANE INCENTIVES INTRODUCTION After the survey data were gathered and basic analysis was completed, the next step was to create a model that could estimate how the incentives affected mode choice. This was done using the software Limdep. After testing many variables, a suitable model was found that could be used for planning. This section examines the creation of the model and then how the impacts of the incentives on mode choice were calculated. MODEL DEVELOPMENT The first step was to determine which variables were able to help predict mode choice and were significant in the model. This was done through testing of many different models using the variables collected in the survey, including: Trip characteristics such as: occupancy, trip frequency, driver or passenger, trip purpose, toll, travel time, incentive offered Demographic characteristics such as: age, gender, ethnicity, income The base model included travel time, toll, and all of the 6 incentives (see Table 1). Although only incentive 3 and 5 were significant, all 6 incentives were included since their impact on mode choice was needed in the Traffic Thermostat. Incentive Number Incentive 1 Incentive 2 Incentive 3 Incentive 4 Table 1: Incentive Descriptions Incentive Description Earn a free trip for every 8, 9, 10, 11, or 12 paid trips taken on the Express Lanes Earn gift cards worth $5 for every 20, 25, 30, or 35 peak-hour trips saved by either telecommuting or by not traveling during the peak hours (7-9am or 4-6pm) 5%, 10%, 15%, 20%, or 25% discount offered through select businesses For every 20, 25, 30, 35 trips taken by transit, $5 in credits that can be used on ELs Incentive 5 A transit fare discount of 10%, 20%, or 30% Incentive 6 Express bus service from park-and-ride lots to downtown The incentives were included in the model in two different ways. The first included the value of the incentive (for example, incentive 3 would have a value of 5, 10, 15, 20, or 25). The second model only included a variable to indicate if the incentive was offered or not. The value was set it to 1 if the incentive was offered, and 0 if it was not. The variables were examined for their level of significance in the model. The variables that were statistically significant were kept, while those with a poor level of significance were removed. 43
SECTION II CONTROLLED ACCESS FACILITIES
 SECTION II CONTROLLED ACCESS FACILITIES SYSTEM IDENTIFICATION A critical component of the Dallas-Fort Worth (DFW) Metropolitan Transportation System is the regional freeway and tollway systems, which are
Q9N. Likelihood of using Xpress if it meant you were better informed about how to use the bus system
 Q9N. Likelihood of using Xpress if it meant you were better informed about how to use the bus system on a 5 point scale, where: 1.0 1.8 Very Unlikely 1.8 2.6 2.6 3.4 Neutral 3.4 4.2 4.2 5.0 Very Likely
Travel Demand Modeling At NCTCOG
 Travel Demand Modeling At NCTCOG Arash Mirzaei North Central Texas Council Of Governments For University of Texas at Arlington ITE Student Chapter March 9, 2005 Agenda Background DFW Regional Model Structure
June 12, I-10 Corridor Advisory Group
 1 June 12, 2012 I-10 Corridor Advisory Group 2 Program Overview > Goal: Move More People, Not More Vehicles > 1 st HOT Lanes in LA County > $290 Million Program Budget ($210 M UPA/CRD Grant) > $142 M Transit
Alternative High Occupancy/Toll Lane Pricing Strategies and their Effect on Market Share
 Alternative High Occupancy/Toll Lane Pricing Strategies and their Effect on Market Share Michael Janson and David Levinson High Occupancy/Toll (HOT) Lanes typically charge a varying to single occupant
APPENDIX C. TECHNICAL MEMORANDUM #2: Transit Survey Analysis
 APPENDIX C TECHNICAL MEMORANDUM #2: Transit Survey Analysis This page intentionally left blank. Table of Contents Page 1 Introduction... 1 Key Findings... 1 2 Survey Responses... 2 Respondent Demographics...
TECHNICAL MEMORANDUM #2: Transit Survey Analysis
 TECHNICAL MEMORANDUM #2: Transit Survey Analysis Lawrence Transit COA August 2016 This page intentionally left blank. Table of Contents Page 1 Introduction... 1 Key Findings... 1 2 Survey Responses...
9.0 Meeting the Challenges
 9.0 Meeting the Challenges 9.1 SLRTP Goals The SLRTP is built around the six TxDOT Strategic Plan goals. 1. Develop an organizational structure and strategies designed to address the future multimodal
APPENDIX B - GLOSSARY FEBRUARY 2017
 APPENDIX B - GLOSSARY FEBRUARY 2017 DENVERMOVES Transit Denver Moves: Transit - ii - APPENDIX B TRANSIT AND MOBILITY GLOSSARY Amenities, stop or station: Objects or facilities (such as a shelter, bench,
Los Angeles County Congestion Reduction Demonstration Project
 Los Angeles County Congestion Reduction Demonstration Project frequently asked questions update #1 /august 2008 Los Angeles County Metropolitan Transportation Authority (Metro), California Department of
2004 FEASIBILITY STUDY UPDATE
 Austin-San Antonio Intermunicipal Commuter Rail District 2004 FEASIBILITY STUDY UPDATE December 2004 EXECUTIVE SUMMARY INTRODUCTION Almost 3 million people in Central Texas, living and working between
Technical Report Documentation Page 2. Government Accession No. 3. Recipient's Catalog No. 1. Report No. SWUTC/14/
 1. Report No. SWUTC/14/600451-00003-3 4. Title and Subtitle COMPENDIUM OF STUDENT PAPERS: 2014 UNDERGRADUATE TRANSPORTATION SCHOLARS PROGRAM Technical Report Documentation Page 2. Government Accession
9. TRAVEL FORECAST MODEL DEVELOPMENT
 9. TRAVEL FORECAST MODEL DEVELOPMENT To examine the existing transportation system and accurately predict impacts of future growth, a travel demand model is necessary. A travel demand model is a computer
Introduction. National Performance Requirements. Addressing Performance in Mobility 2045
 Introduction Measuring and tracking the performance of the region s transportation system is a fundamental component of the Metropolitan Transportation Plan (MTP) and the performance-based planning process.
Introduction. National Performance Requirements. Addressing Performance in Mobility 2045
 Introduction Measuring and tracking the performance of the region s transportation system is a fundamental component of the Metropolitan Transportation Plan (MTP) and the performance-based planning process.
Demand Reduction Assumptions Used For Travel Demand Analysis of EIS Alternatives
 M E M O R A N D U M Demand Reduction Assumptions Used For Travel Demand Analysis of EIS Alternatives TO: FROM: Project Management Team Steve Perone/PTV America DATE: Revised: February 6, 2009 Background
Computer Applications in Engineering and Construction Programming Assignment #7 Data Analysis Applied to Toll Road Data
 CVEN 302-501 Computer Applications in Engineering and Construction Programming Assignment #7 Data Analysis Applied to Toll Road Data Date distributed : 10/28/2015 Date due : 11/16/2015 at 12:00 p.m. Upload
US 75 Integrated Corridor Management
 US 75 Integrated Corridor Management Koorosh Olyai,, P.E. Assistant Vice President Dallas Area Rapid Transit ITS Texas September 5, 2008 Why ICM is needed in the US 75 Corridor DFW 5 th most congested
Getting Started. A Workshop for Local Partners. Federal Highway Administration Office of Operations
 Getting Started with Congestion Pricing A Workshop for Local Partners Federal Highway Administration Office of Operations SESSION 1 Welcome and Introductions Workshop Objectives Develop an understanding
REGIONAL TRANSPORTATION AUTHORITY: 2016 CUSTOMER SATISFACTION STUDY
 FINAL REPORT REGIONAL TRANSPORTATION AUTHORITY: 2016 CUSTOMER SATISFACTION STUDY 6.21.2017 PREPARED FOR: REGIONAL TRANSPORTATION AUTHORITY 55 Railroad Row White River Junction, VT 05001 802.295.4999 www.rsginc.com
: value pricing. application of the 10 criteria for the long-term consideration of 5.1 THE UNIVERSE OF FACILITIES IN THE DALLAS- FORT WORTH REGION
 Re g i o n a l Va l u e P r i c i n g C o r r i d o r E v a l u at i o n a n d Fe a s i b i l i t y S t u d y N o r t h C e n t r a l T e x a s C o u n c i l o f G o v e r n m e n t s 5 application of
PHASE III SURVEY REPORT
 PHASE III SURVEY REPORT FEBRUARY 2016 TABLE OF CONTENTS Introduction...2 Table 1: Phase III Survey Demographics...3 Figure 1: Respondent Age Distribution...3 Figure 2: Respondent Race/Ethnicity Distribution...4
General Population Survey Summary
 General Population Survey Summary A short online survey was used to get input from general population users of the Highway 169 corridor. The survey was promoted through a press release, email blast, social
RTC Position on Pavement Condition Targets
 RTC Position on Pavement Condition Targets NCTCOG Supports TxDOT Statewide 2022 Good Pavement Condition Targets for National Highway System Facilities NCTCOG Supports TxDOT Statewide 2022 Poor Pavement
DC Circulator 2018 Service Changes. Outreach Results Report May 2018
 DC Circulator 2018 Service Changes Outreach Results Report May 2018 2018 Service Changes Outreach results report Table of Contents 1.0 Proposed Major Service Changes... 4 2.0 Comments Collection Methodology...
I-66 Corridor Improvements Outside the Capital Beltway in Northern Virginia, USA
 15th International Conference on Managed Lanes I-66 Corridor Improvements Outside the Capital Beltway in Northern Virginia, USA Case Study for Funding of Transit Service and Transportation Demand Management
8: Transportation Demand &
 GPATS Long-Range Transportation Plan 8: Transportation Demand & Emerging Technologies INTRODUCTION The transportation systems of cities, states, and nations are undergoing a period of transformation. As
1.201 / / ESD.210 Transportation Systems Analysis: Demand and Economics. Assignment 2
 1.201 / 11.545 / ESD.210 Transportation Systems Analysis: Demand and Economics Assignment 2 Question 1 Elasticities and Consumer Surplus In April of 1973, the Massachusetts Bay Transportation Authority
Regional Transportation Council Workshop August 11, Ken Kirkpatrick, Counsel for Transportation
 Regional Transportation Council Workshop August 11, 2016 Ken Kirkpatrick, Counsel for Transportation BACKGROUND TollTag Users Have a Higher Payment Rate than ZipCash Users Pilot Initiated at RTC Suggestion
6.0 CONGESTION HOT SPOT PROBLEM AND IMPROVEMENT TRAVEL DEMAND MODEL ANALYSIS
 6.0 CONGESTION HOT SPOT PROBLEM AND IMPROVEMENT TRAVEL DEMAND MODEL ANALYSIS 6.1 MODEL RUN SUMMARY NOTEBOOK The Model Run Summary Notebook (under separate cover) provides documentation of the multiple
Mobility Management Basics
 Mobility Management Basics Module 5: Transportation for Job Seekers and Low-Income Workers For individuals with limited income or those transitioning from public assistance programs, having access to reliable
Plan Helps LA s ExpressLanes Meet Expectations
 Plan Helps LA s ExpressLanes Meet Expectations Presented by: Ken Wissel ITE Western District 2013 Annual Meeting Los Angeles Traffic LA drivers know traffic congestion 10 million + residents in LA County
Mobility 2025 Update: The Metropolitan Transportation Plan
 Mobility 2025 Update: The Metropolitan Transportation Plan May, 2001 North Central Texas Council of Governments Transportation Department MOBILITY 2025 UPDATE FINANCIAL SUMMARY Metropolitan Transportation
The Transportation dividend
 Prepared by AECOM Technical Appendices report February 2018 The Transportation dividend Transit investments and the Massachusetts economy Technical Appendix A economic Benefits Methodology and Results
Association for Commuter Transportation Recommendations to USDOT on MAP-21 Performance Measures
 Association for Commuter Transportation 1341 G Street, NW, 10th Floor Washington, DC 20005 Tel: 202.719.5331 www.actweb.org Association for Commuter Transportation Recommendations to USDOT on MAP-21 Performance
Congestion Management Process 2013 Update
 OVERVIEW OF THE DALLAS-FORT WORTH CONGESTION MANAGEMENT PROCESS Traffic Congestion In The Dallas-Fort Worth Region With the Dallas-Fort Worth (DFW) urban area as its center, the North Central Texas region
APPENDIX H: TRAVEL DEMAND MODEL VALIDATION AND ANALYSIS
 APPENDIX H: TRAVEL DEMAND MODEL VALIDATION AND ANALYSIS Travel demand models (TDM) simulate current travel conditions and forecast future travel patterns and conditions based on planned system improvements
AIR QUALITY AND CLIMATE CHANGE EVALUATION GUIDANCE
 AIR QUALITY AND CLIMATE CHANGE EVALUATION GUIDANCE The following guidance provides additional details regarding the process followed by PSRC to evaluate projects for potential air quality benefits. As
Current Trends in Traffic Congestion Mitigation
 Current Trends in Traffic Congestion Mitigation April 24, 2009 NCSL Spring Forum Washington, DC Jeff Lindley Associate Administrator, Office of Operations Federal Highway Administration U.S. Department
Contents i Contents Page 1 A New Transportation Plan Community Involvement Goals and Objectives... 11
 Contents i Contents 1 A New Transportation Plan... 1 Why develop a new plan?... 1 What area does the LRTP focus on?... 2 Why is this LRTP important?... 3 Meeting Requirements for Transportation Planning...
North Texas Alternative Futures. Transportation. September 15, 2009
 September 15, 2009 Page i Table of Contents Page System... 1 Methodology... 1 Findings... 2 Bicycle and Pedestrian... 7 Action Tools... 12 Assumptions and Limitations... 15 Vision North Texas Research
Willingness to Pay in the Autonomous Vehicle Age
 Willingness to Pay in the Autonomous Vehicle Age IBTTA Summit on Finance & Policy July 24, 2018 Solutions for a better world. PREMISE Autonomous Vehicles (AVs) are coming. AVs will impact long-term planning
Active Direction to Managing Transportation ATDM: Ohio s Perspective
 Active Direction to Managing Transportation ATDM: Ohio s Perspective John Gray, Associate Vice President AECOM Brenton, Bogard, P.E. Studies Engineer Ohio Department of Transportation Ohio Transportation
DART s Role in Transit - Oriented Development. Jack Wierzenski,, Director Economic Development & Planning Dallas Area Rapid Transit
 DART s Role in Transit - Oriented Development Jack Wierzenski,, Director Economic Development & Planning Dallas Area Rapid Transit The DART System Established in 1983 13 Member Cities Local Funding: $.01
VIA Long Range Plan Glossary
 VIA Long Range Plan Glossary Accessibility. Accessibility is the ability to reach opportunities (economic, social, etc.) within a certain geographical area. Americans with Disabilities Act (ADA). Passed
1996, TRANSPORTATION DEMAND MANAGEMENT FOR INTERPROVINCIAL TRAVEL
 1996, TRANSPORTATION DEMAND MANAGEMENT FOR INTERPROVINCIAL TRAVEL Executive Summary: Introduction In recent years, the demand for transportation in the National Capital Region has outpaced the ability
Changes in Service Levels, Fares, and Funding for Small Urban Transit Agencies: Survey Results
 Changes in Service Levels, Fares, and Funding for Small Urban Transit Agencies: Survey Results Preliminary Report Jeremy Mattson David Ripplinger Small Urban & Rural Transit Center Upper Great Plains Transportation
Chapter 3 Transportation System Management & Operations and Travel Demand Management
 Chapter 3: Transportation System Management & Operations and Travel Demand Management As roadways in Washington County grow more congested, it becomes increasingly important to focus on costeffective strategies
REPORT TO: Council FOR: Strategy Meeting. Direction from Council regarding the Squamish Transit 5-Year Business Plan
 DISTRICT OF SQUAMISH REPORT TO: Council FOR: Strategy Meeting PRESENTED: December 11, 2007 FILE: TRANSP SUBJECT: Squamish Transit 5-Year Business Plan Recommendation: Direction from Council regarding the
Transit System Survey
 Denver Moves: Transit SUMMARY Build Your Own Transit System Survey March-July 2017 ABOUT THE SURVEY The Denver Moves: Transit Build Your Own Transit System (BYOTS) survey invited people to share their
Maximize Transportation System Capacity
 US 75 Integrated Corridor Management System Using Technology and Partnership to Using Technology and Partnership to Maximize Transportation System Capacity What is ICM? The integrated management of freeway,
Dogpatch-Central Waterfront Transit Demand Study Planning Study Key Takeaways
 EXECUTIVE SUMMARY The purpose of this memo is to assist the SFMTA Transit Division with its final recommendation for replacement service of the existing 22-Fillmore bus service. It is informed by Planning
Click to add title. Maximizing your Marketing Power
 Click to add title Maximizing your Marketing Power Click to add title Marketing Your Program The role of the ETC to influence Marketing your program is your most effective tool Your powers as an ETC to
PRICING STRATEGIES PRESENTED BY JEFFREY D. ENSOR MALAYSIA TRANSPORT RESEARCH GROUP TO THE NOVEMBER 25, 2003
 PRICING STRATEGIES PRESENTED BY JEFFREY D. ENSOR TO THE MALAYSIA TRANSPORT RESEARCH GROUP NOVEMBER 25, 2003 Outline Motivations Distance-based pricing Congestion pricing Overview Scheme types Technology
10.0 Congestion Management Process
 Livability 2040 Regional Transportation Plan 10-1 10.0 Congestion Management Process 10.1 CMP Summary The identification and evaluation of projects for the Livability 2040 Regional Transportation Plan
This document has been developed to provide context to the Board as part of the strategic planning process. Regional development and travel trends
 1 This document has been developed to provide context to the Board as part of the strategic planning process. Regional development and travel trends and forecasts are provided, including population, employment,
Appendix B2: Factors Affecting Transit Choice
 Appendix B2: Factors Affecting Transit Choice 1 TRANSIT MARKET The transit market comprises those trips which have the option of taking transit, that is, those trips for which the trip origin and trip
Comparison of I-210 and I-710 as Potential ICM Corridors
 Comparison of I-210 and I-710 as Potential ICM Corridors Positive Aspects Traffic sensors Very good PeMS coverage of freeway mainline, HOV lanes, and ramps Many intersections within Pasadena already equipped
Charlotte Region HOV/HOT/Managed Lanes Analysis. Technical Memorandum Task 1.3 EVALUATION CRITERIA
 Charlotte Region HOV/HOT/Managed Lanes Analysis Technical Memorandum Task 1.3 EVALUATION CRITERIA October 23, 2007 TABLE OF CONTENTS 1.0 EVALUATION PROCESS -------------------------------------------------------------------------------------------
USING A SIMULATION ENVIRONMENT FOR DYNAMIC TOLL ANALYSIS
 USING A SIMULATION ENVIRONMENT FOR DYNAMIC TOLL ANALYSIS ABSTRACT Robert Kerns and Darryn Paterson Transurban, USA 1421 Prince Street, Suite 200 Alexandria, Virginia 22314 571-527-2050; rkerns@transurban.com;
DDI s Can Move More Than Cars. Alex Ariniello. Presentation for the ITE Western District Annual Meeting. July, 2016 in Albuquerque, New Mexico
 DDI s Can Move More Than Cars Alex Ariniello Presentation for the ITE Western District Annual Meeting July, 2016 in Albuquerque, New Mexico In January, 2016, a Diverging Diamond Interchange (DDI) opened
Transform 66 Multimodal Project: Prioritization Process and Evaluation Criteria Approved March 3, 2016
 Transform 66 Multimodal Project: Prioritization Process and Evaluation Criteria Approved March 3, 2016 The Memorandum of Agreement (MOA) for the Transform 66: Inside the Beltway Project directs NVTC to
Congestion Management Process in the US A Federal Requirement
 Congestion Management Process in the US A Federal Requirement ITS Argentina November 6, 2013 U.S. Department of Transportation Federal Highway Administration Outline of Seminar Discussion of Congestion
CIRCULATOR STATUS UPDATE PRESENTATION JUNE 22, 2015
 CIRCULATOR STATUS UPDATE PRESENTATION JUNE 22, 2015 1 Summary of Outreach Activities Peer Review Operating Plan Development Discussion Next Steps 2 CCT Cumberland Transfer Center Intercept Surveys Stakeholder
A Time Series Approach to Forecast Highway Peak Period Spreading and Its Application in Travel Demand Modeling
 A Time Series Approach to Forecast Highway Peak Period Spreading and Its Application in Travel Demand Modeling Sabya Mishra (University of Memphis) Timothy F. Welch (Georgia Institute of Technology) Subrat
Evaluating the Potential Economic Efficiency of Project Delivery Options
 1 1 1 1 1 1 1 1 0 1 0 1 Paper No. 1-000 Evaluating the Potential Economic Efficiency of Project Delivery Options Patrick DeCorla-Souza 1 Public-Private Partnerships Program Manager Build America Bureau
Examining the Differences between Travelers Revealed versus Actual Travel Time Savings
 1 1 1 1 1 1 1 0 1 0 1 Examining the Differences between Travelers Revealed versus Actual Travel Time Savings Prem Chand Devarasetty, Ph.D. Zachry Department of Civil Engineering Texas A&M University CE/TTI
Chapter #9 TRAVEL DEMAND MODEL
 Chapter #9 TRAVEL DEMAND MODEL TABLE OF CONTENTS 9.0 Travel Demand Model...9-1 9.1 Introduction...9-1 9.2 Overview...9-1 9.2.1 Study Area...9-1 9.2.2 Travel Demand Modeling Process...9-3 9.3 The Memphis
Political Dimensions of Congestion Pricing: the Case of the San Francisco-Oakland Bay Bridge
 Political Dimensions of Congestion Pricing: the Case of the San Francisco-Oakland Bay Bridge Karen Trapenberg Frick Department of City and Regional Planning University of California Transportation Center
Technical Briefing Report
 Technical Briefing Report March 2007 CONGESTION MANAGEMENT PROCESS (CMP) The Congestion Management Process (CMP) seeks a management solution to a growing traffic problem by targeting resources to operational
DIGITAL. Management LOCAL PARTNER LEGACY OF TRUST LEADER IN DIGITAL
 DIGITAL Management LOCAL PARTNER LEGACY OF TRUST LEADER IN DIGITAL There Is No Digital Strategy Anymore, Just STRATEGY IN A DIGITAL WORLD ABOUT US Orlando Sentinel Media Group is a cutting-edge, multimedia
20. Security Classif.(of this page) Unclassified
 Unclassified") 1. Report No. FHWA/TX-11/0-6396-1 4. Title and Subtitle OPERATIONAL PERFORMANCE MANAGEMENT OF PRICED FACILITIES Technical Report Documentation Page 2. Government Accession No. 3. Recipient's Catalog No.
1. Report No. FHWA/TX-11/0-6396-1 4. Title and Subtitle OPERATIONAL PERFORMANCE MANAGEMENT OF PRICED FACILITIES Technical Report Documentation Page 2. Government Accession No. 3. Recipient's Catalog No.
SECTION III - REGIONAL ARTERIAL SYSTEM. The Regional Arterial System is a subcomponent of a broader regional thoroughfare system.
 SECTION III - REGIONAL ARTERIAL SYSTEM SYSTEM IDENTIFICATION The Regional Arterial System is a subcomponent of a broader regional thoroughfare system. The NCTCOG Regional Thoroughfare Plan (RTP) recognizes
Analysis of the Observed Behavior of Users to Value Pricing and Travel time: The New Jersey Turnpike Case
 Analysis of the Observed Behavior of Users to Value Pricing and Travel time: The New Jersey Turnpike Case Kaan Ozbay, Ph. D. Associate Professor, Department of Civil and Environmental Engineering, Rutgers,
Customer Experience & Satisfaction Lessons from the 2018 Rider Survey
 Customer Experience & Satisfaction Lessons from the 2018 Rider Survey Customer Services & Marketing Strategic Initiatives Eric Lind Manager, Research & Analytics Understanding & Improving the Metro Transit
EXECUTIVE SUMMARY REGIONAL TRANSPORTATION PLAN 2050
 EXECUTIVE SUMMARY REGIONAL TRANSPORTATION PLAN 2050 Introduction Goals Policies, and Performance Measures Growth Forecast and Planned Land Use Development Key Recommendations i Executive Summary April
NCTCOG Existing and Planned Systems/Deployments NATALIE BETTGER NOVEMBER 27, 2018
 NCTCOG Existing and Planned Systems/Deployments NATALIE BETTGER NOVEMBER 27, 2018 Agenda Regional Planning Activities Organizational Structure Regional TSMO Projects Operations Travel Demand Management
A Plan for Sustainable Transportation at Yale. June 2012 [Updated September 1, 2013] INTRODUCTION
![A Plan for Sustainable Transportation at Yale. June 2012 [Updated September 1, 2013] INTRODUCTION](/thumbs/80/81721071.jpg "A Plan for Sustainable Transportation at Yale. June 2012 [Updated September 1, 2013] INTRODUCTION") A Plan for Sustainable Transportation at Yale June 2012 [Updated September 1, 2013] INTRODUCTION Yale Transportation Options has been providing support for members of the Yale community interested in more
A Plan for Sustainable Transportation at Yale June 2012 [Updated September 1, 2013] INTRODUCTION Yale Transportation Options has been providing support for members of the Yale community interested in more
Intelligent Transportation Systems
 Intelligent Transportation Systems TABLE OF CONTENTS Introduction... 3 Background... 3 Existing Conditions... 4 Traffic Signals... 4 Transit... 6 Parking... 6 Staffing... 7 Best Practices... 8 Recommendations...
Highest Priority Performance Measures for the TPP
 Highest Priority Performance Measures for the TPP The following list of measures are the highest priority performance measures as identified by modal working groups. These groups consist of staff from
Future Build Alternative Traffic Forecasts and Level of Service Analysis
 4.2.10 Future Build Alternative Traffic Forecasts and Level of Service Analysis For the five Build Alternatives, study intersections within one mile of potential station locations were analyzed, as it
Independent Accountants Report on Applying Agreed-Upon Procedures
 KPMG LLP Suite 2900 1918 Eighth Avenue Seattle, WA 98101 Independent Accountants Report on Applying Agreed-Upon Procedures Audit and Reporting Committee of the Board of Directors Central Puget Sound Regional
Zenith Model Framework Papers - Version Paper G Mode Choice Model
 Zenith Model Framework Papers - Version 3.0.1 Paper G Mode Choice Model May 2014 Page Intentionally Left Blank Paper G Mode Choice Model Draft Report COPYRIGHT: The concepts and information contained in
TABLE OF CONTENTS PAGE NUMBER. Executive Summary Why Variable Pricing? What Was Studied? User Surveys Air Quality Analysis User And Equity Analysis
 TABLE OF CONTENTS PAGE NUMBER Executive Summary Why Variable Pricing? What Was Studied? User Surveys Air Quality Analysis User And Equity Analysis Findings Scenario 1 Base Case Scenario 2 Detoll Scenario
Evaluation of Congestion Pricing for Management Highway in Seattle
 Evaluation of Congestion Pricing for Management Highway in Seattle Aman J. Aman, Diana C. Nuñez, Mohammed Hamideddin, Pankaj Laungani, Wail Abbo Abstract Congestion is one of the most important and complex
TRANSPORTATION OPTIONS PROGRAM PLAN TAP MEETING #1 1/23/17
 TRANSPORTATION OPTIONS PROGRAM PLAN TAP MEETING #1 1/23/17 Agenda Introductions ABC Ramps Info and History Multi-modal programs Partners and Stakeholders Research Problem Statement Research Scope of Work
Congest-Shun. Tim Lomax Texas A&M Transportation Institute
 Congest-Shun An SEC Rival Discusses Mobility Data & How It Might Be Used to Design and Market Transportation Projects 58 th Annual Transportation Conference February 2015 Tim Lomax Texas A&M Transportation
Chapter TRIP REDUCTION AND TRAVEL DEMAND MANAGEMENT
 Chapter 10.72 TRIP REDUCTION AND TRAVEL DEMAND MANAGEMENT Sections: 10.72.010 Short title. 10.72.020 Authority. 10.72.030 Marin County congestion management agency (CMA). 10.72.040 Definitions. 10.72.050
Roadway Traffic Assignment (Last Edit August 26, 2005)
") Roadway Traffic Assignment (Last Edit August 26, 2005) This chapter focuses on the Roadway Traffic Assignment module of the Dallas-Fort Worth Regional Travel Model (DFWRTM). Based on the input vehicle
Roadway Traffic Assignment (Last Edit August 26, 2005) This chapter focuses on the Roadway Traffic Assignment module of the Dallas-Fort Worth Regional Travel Model (DFWRTM). Based on the input vehicle
CHAPTER 4 FUTURE TRENDS
 CHAPTER 4 FUTURE TRENDS 4.1 LAND USE SCENARIO PLANNING Scenario planning represents the next generation of analytical processes created to evaluate the influence of development intensities and land use
MOBILITY 2025: THE METROPOLITAN TRANSPORTATION PLAN
 MOBILITY 2025: THE METROPOLITAN TRANSPORTATION PLAN Dan Lamers, P.E. North Central Texas Council of Governments Transportation Department www.nctcog.org/trans NORTH CENTRAL TEXAS COUNCIL OF GOVERNMENTS
Reaction to Value Pricing by Different Suburban Populations
 Reaction to Value Pricing by Different Suburban Populations by John Lowery Parsons Brinckerhoff 303 2 nd St, Suite 700 North San Francisco, CA 94107-6306 Ph: (415) 243-4716 lowery@pbworld.com Mark W. Burris,
STATE OF MINNESOTA Office of the State Auditor
 STATE OF MINNESOTA Office of the State Auditor Rebecca Otto State Auditor METRO TRANSIT MINNEAPOLIS, MINNESOTA AGREED-UPON PROCEDURES FOR THE YEAR ENDED DECEMBER 31, 2011 Description of the Office of the
FHWA-supported Parking Pricing Project Updates
 FHWA-supported Parking Pricing Project Updates This document provides an update on a selection of parking-pricing efforts across the country that were funded by the Federal Highway Administration (FHWA)
RIDESHARE PROGRAM PURPOSE
 Program FPG 7302 RIDESHARE PROGRAM PURPOSE The UCLA Health System Faculty Practice Group Program is designed to reduce the number of single occupant vehicle (SOV) trips to the worksite. This effort is
Findings from a Road Pricing Experiment
 Findings from a Road Pricing Experiment Los Angeles Congestion Pricing Workshop June 27, 2008 Project Background Long-Term Finance Reform Long-run viability of existing transportation finance approaches
report final Decennial Model Update Executive Summary Contra Costa Transportation Authority Cambridge Systematics, Inc.
 final report prepared for Contra Costa Transportation Authority prepared by with Dowling Associates Caliper Corporation June 2003 Table of Contents 1.0 Introduction... ES-1 2.0 Data Development... ES-5
Customer Success Story:
 Customer Success Story: How a New ecommerce Store Acquired 4,235 Leads in 2 Weeks of Launching, got Their 1st Few Sales, Built a Huge Audience & Generated $12,770 of Value From a Single Giveaway!! Tool
UK Road Pricing Feasibility Study: Modelling the Impacts Elizabeth Cox 1 UK
 Abstract UK Road Pricing Feasibility Study: Modelling the Impacts Elizabeth Cox 1 UK In July 2003, the UK government set up a comprehensive study to examine how a new system of charging for road use could
Transit, Intercity Bus, Taxi 8-1
 8-1 Introduction Public transit is a critical element of any transportation system. It both provides an alternative form of transportation to the traditional use of the automobile and provides mobility