FIRST MOVER ADVANTAGE IN SEQUENTIAL BERTRAND MARKETS: AN EXPERIMENTAL APPROACH A THESIS. Presented to
|
|
|
- Naomi Garrison
- 6 years ago
- Views:
Transcription
1 FIRST MOVER ADVANTAGE IN SEQUENTIAL BERTRAND MARKETS: AN EXPERIMENTAL APPROACH A THESIS Presented to The Faculty of the Department of Economics and Business The Colorado College In Partial Fulfillment of the Requirements for the Degree Bachelor of Arts By Perry Fitz April 2017
2 FIRST MOVER ADVANTAGE IN SEQUENTIAL BERTRAND MARKETS: AN EXPERIMENTAL APPROACH Perry Fitz April 2017 Mathematical Economics Abstract Literature and applied experimental evidence has established the consensus that firms competing with price competition in sequential markets have a second mover advantage. A high proportion of literature assumes firms have symmetric costs, while in real markets firms tend to have asymmetrical costs. In this paper, I use current literature to define various profit assumptions that yields a theoretical first mover advantage for a low-cost firm in a differentiated-product Bertrand-duopoly. I report on the findings of an experimental 30 round sequential game, where firms have varying levels of cost. The results show that a low-cost firm will not necessarily always have a first mover advantage against a high-cost competitor. KEYWORDS: Experimental Economics, Stackelberg, Bertrand, Asymmetric Firms JEL CODES: C71, C02, C70 ii
3 Acknowledgements I would like to thank my mentor, Rich Fullerton, for the amount of dedication and unconditional support he put throughout my thesis. Without his help from the beginning, I would be lost. Thank you to Kevin Rask and Kathryn Bryant for continuous support and input. iii
4 ON MY HONOR, I HAVE NEITHER GIVEN NOR RECEIVED UNAUTHORIZED AID ON THIS THESIS Signature iv
5 TABLE OF CONTENTS ABSTRACT ACKNOWLEDGEMENTS ii iii 1. INTRODUCTION MODEL METHOLOGY THEORITCAL BACKGROUND AND EQUILIBRIA HYPOTHESES EXPERIMENTAL RESULTS TABLE I TABLE III.. FIGURE DISCUSSION CONCLUSION FIGURE FIGURE APPENDIX REFERENCES v
6 1. Introduction From 2000 to 2016 the number of listed domestic companies in the United States decreased by 37% according to the World Bank s Federation of Exchanges database. In the same time frame, research and development expenditure towards technology has increased by 9% 1. As technology continues to grow in the United States, more firms are attempting to collect complete information of markets to stay ahead of their competition. Firms can compete against one another in a multitude of strategies; the most basic and popular being quantity or price competition. But having access to a growing amount of market information has added a third complexity: timing. Firms have the ability to use timing as an additional strategy with price or quantity. Firms can decide to compete with competitors simultaneously or sequentially. In sequential markets, companies select to be a leader or a follower, where both literature and experimental markets have supported the advantage of being a first-mover when using quantity competition. However, in price competition a consensus in literature has been gathered that the follower is at an advantage when symmetric firms compete against one another. Even so, real world markets rarely contain symmetric competitors in terms of cost. The main purpose of this paper is to apply experimental evidence to Amir and Stepanova s theory (2006) that a firm with a sufficient cost lead over its rival has a first 1 According to the World Bank s Research and Development Expenditure (% of GDP) database. vi
7 mover advantage in a differentiated-product Bertrand-duopoly with general demand and asymmetric linear costs. Asymmetric costs are more relevant in studying real world markets because it is unlikely that two competing firms will have identical cost functions for imperfect substitutes. Asymmetric costs are common in markets of large and small producers, where larger firms can achieve economies of scale (for example Barnes & Noble vs. an independent local bookstore) (Ledvina and Sircar, 2011). The experimental market in this study will be a two-firm duopoly with differentiated products. Differentiated products are goods that are not perfect substitutes, allowing each firm to receive demand regardless of setting the lowest price. For more complex study, the experiment will have three players : high-cost, medium-cost, and low-cost participants. Each participant will be randomly matched in the experiment to allow analysis of decision making based on the relative amount of cost a firm has. Finally, to see if a firm with a large cost advantage (Low-cost vs High-cost) has the same advantage as a firm with a modest cost advantage (Medium-cost vs High-cost). By replicating the assumptions used by Amir and Stepanova (2006), this paper focuses on Bertrand Stackelberg competition, which allows for a comparison to relevant literature on profit maximizing and first and second mover advantages. More importantly, this study will analyze the behavior of participants to understand if the Nash equilibrium and first mover advantage for the lower cost firm can be replicated. 1.1 Background Cournot (1929) and Bertrand (1883) competition are among the most frequently applied theories used to describe industry interaction. Firms using the Cournot model will compete with product output, while firms using the Bertrand model will compete on 2
8 prices. Cournot competition will result in the competitive price from market equilibrium, while Bertrand competition drives price to equal the marginal cost 2. In a duopolistic market with homogenous goods and equal marginal costs, Bertrand competition is more efficient than Cournot competition when demand is linearly structured 3 (Singh & Vives, 1984). However, firms need to determine the timing of their decision for quantity or price. Competing firms in any market will set their prices or quantities either simultaneously or sequentially. In a sequential duopolistic market, firms will act as either a leader or follower. The timing of the decision to be a leader or follower has a significant impact on the market outcome. Von Stackelberg (1934) argued that players in a market have a preference to which role (leader, follower) they hold 4. Both theory and applied experimental evidence 5 in quantity competition of homogenous duopolistic markets support that Stackelberg markets yield higher output, consumer rents, and higher welfare levels than Cournot markets 6. Higher levels of output and welfare levels in Stackelberg markets substantiate that sequential moves are more efficient than simultaneous timing in quantity competition 7. Theoretically, in quantity competition, the first mover in a homogenous duopolistic market has an advantage compared to the second mover as supported by Huck, etc. (2001). Price competition, however, varies to quantity 2 This will be true if the assumptions are set in a duopolistic situation with homogenous goods and equal marginal costs. 3 Regardless if goods are substitutes or complements. 4 In a duopoly both firms prefer the same role meaning that a stable equilibrium will not exist. When firms in a duopoly compete in quantity competition, the position of leader is most preferred, while in price competition the follower position is more advantageous as presented by Damme and Hurkens (2004). 5 See Huck, etc. (2001) and Kübler and Müller (2001). 6 Huck, etc. (2001) use experimental evidence to compare Stackelberg and Cournot duopolistic markets by focusing on homogenous products. Their results for Stackelberg markets show higher yields in output, higher consumer rents, and higher welfare levels than Cournot markets (Huck, 750). 7 This paper focuses on sequential timing because of the higher efficiency of sequential moves in markets. 3
9 competition as the advantage in Stackelberg markets is held by the follower 8. For example, in a homogenous duopolistic market where symmetric firms are competing in prices using sequential timing, the follower has the advantage because using perfect information to undercut the leader s price leads to the follower receiving higher demand. However, does this hold true when goods are heterogeneous? Kübler and Miller (2001) find when firms are symmetric competing in prices of heterogeneous duopolistic markets there is a significant first-mover disadvantage. Their experiment looks to study the difference between sequential and simultaneous movements. Our paper, however, will focus only on sequential movements in Bertrand markets, where firms are asymmetric in costs. There is a current lack of literature on asymmetric costs when duopolistic markets have differentiated products. Ledvina and Sircar (2011) conclude heterogeneous markets lead to inactive firms in equilibrium 9, however, do not focus on duopolistic markets. Alternatively, using literature on reaction functions, we can observe how asymmetric costs will impact first and second mover advantages. Gal-Or (1985) demonstrates that when two identical firms move sequentially, the first-mover earns lower profits than the follower, when the reaction functions of the firms are upward sloping 10. Amir and Stepanova (2006) use theoretical proofs to show that when both reaction functions 11 are downward sloping, both firms have a first-mover advantage. The same is true in a mixed case, where the firm with the downward sloping reaction function will have a first-mover advantage. In asymmetric cost functions, the 8 See Amir and Stepanova (2006) 9 Ledvina and Sircar (2011) study three-firm games before moving on to the general case of N-firm games, however, they do focus on heterogeneous markets with asymmetric cost firms. 10 Reaction functions are determined to be upward sloping (downward sloping) if they are twice differentiable and positive (negative). 11 Reaction functions of the two firms that are competing in a duopolistic market. 4
10 firm with a downward sloping reaction function will continue to have a first-mover advantage 12. However, this could be relative to a firm s timing, as the difference between costs of asymmetric firms would determine the range of profits for both firms in a duopolistic market. The purpose of this paper is to explore the theory that in price competition of duopolistic heterogeneous markets the first-mover has the advantage if their cost function is lower than their competitor. In a sequential move Bertrand-duopoly, firms will decide price inputs by committing to an action. The first-mover will engage in setting a price, which will be observed by the second-mover before making their own price decision, respectively. The experiment will allow for perfect information between randomly matched pairs 13, where players will have access to their opponent s price decision 14. Rebelein and Turkay (2016) create a classroom experiment to understand the first and second mover advantages in both price and quantity driven competition for sequential moving duopolistic markets. Our experiment is similar by creating a sequential Bertrand game by randomly matching students. However, their experiment fails to study asymmetric cost functions, games with perfect information, and analyze experimental evidence towards market efficiency. In this experiment, multiple asymmetric firms will be present. There are three different cost functions defined as Low-Cost, Medium-cost, and High-Cost firms. I aim to study how the effect of varying cost degrees between firms 12 This will be true if the relative firm operates with a lower cost function than their upward sloping reaction function competitor. 13 Huck, etc. (2001) report that in random matching Stackelberg markets report higher total yield quantities than theoretically predicted. Kübler and Müller (2001) also report that their theoretical predictions do better in treatments when random matching is present. 14 Only the follower will have access to their opponent s price decision, as the leader will move first. 5
11 affects first-mover advantage. The experiment will not provide firms the information as to which firm (Low-Cost, Medium-Cost, or High-Cost) they will be competing with. Although this brings up the issue that firms will have to make a guess as to which firm they are competing against, the three different cost firms have unique price equilibriums. I am looking to see if firms, depending on their opponent, can adapt in the latter half of the experiment to play the predicted equilibrium. 2. Model Observing a model of a duopolistic Bertrand market with differentiated goods, Firm i charges price p i, faces demand D i (p 1, p 2 ) and assumed to have linear production costs with asymmetric marginal cost c i, i = 1,2 15. The profit of firm i 16 is then given by: P i (p 1, p 2 ) = (p i c i ) D i (p 1, p 2 ) (1) The demand equation used by Amir and Stepanova (2006) that will be replicated in this experiment is the following: Equation (2) will use (1) for the profit of firm i. However, due to the fact that prices will need to be above marginal cost and that all quantities in the game will need to be positive 17, the following has to hold: i. C 1 > C 2, due to asymmetric costs. ii. The demand function (2) satisfies: 15 The standard model of duopolistic price competition with differentiated goods is defined by Amir and Stepanova (2006) on page This observation is taking from Amir and Stepanova (2006) on page 5, which is being used to replicate their assumptions. 17 This is taken from Amir and Stepanova (2006) on page 10 that is describing the assumptions needed for the demand equation. 6
12 iii. Let 18 iv. 0 < b < 1 Amir and Stepanova (2006) theorize that in order for either the low-cost or high-cost firm to have a first-mover advantage the final two assumptions have to hold: (Assumption 1) The demand equation D i (p 1, p 2 ) is twice continuously differentiable when > 0 and the following are held to be true 19 : (Assumption 2) D i (p 1, p 2 ) is strictly log-supermodular on P 1 x P 2, i = 1,2 20. This implies the following: (4) Concerning my experiment, I use the assumptions presented up to this point to observe the behavioral play of participants towards first-mover advantage. However, the demand model used for the experiment varies slightly compared to the one presented by Amir and Stepanova (2006). In order to make the experiment easier to follow when observing the optimal prices and profits, I adjusted the demand equation to decrease the 18 See This is assumption 1 from Amir and Stepanova (2006) that is being used for replication found on page This is assumption 2 also from Amir and Stepanova (2006) that is being used for replication found on page 7. 7
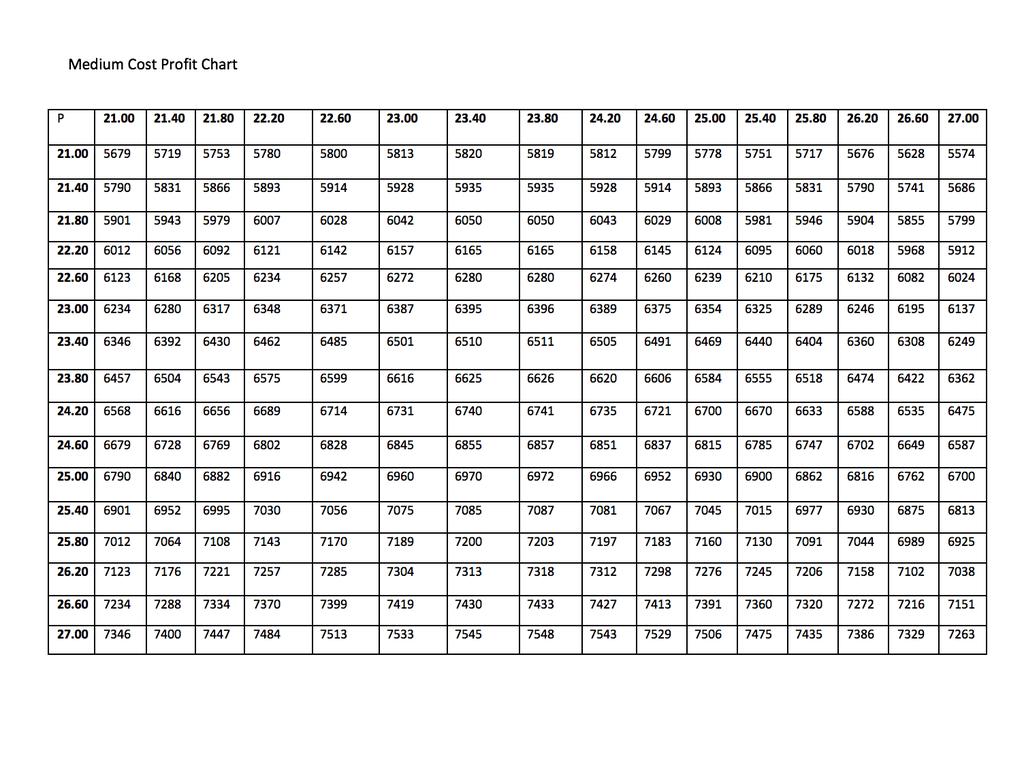
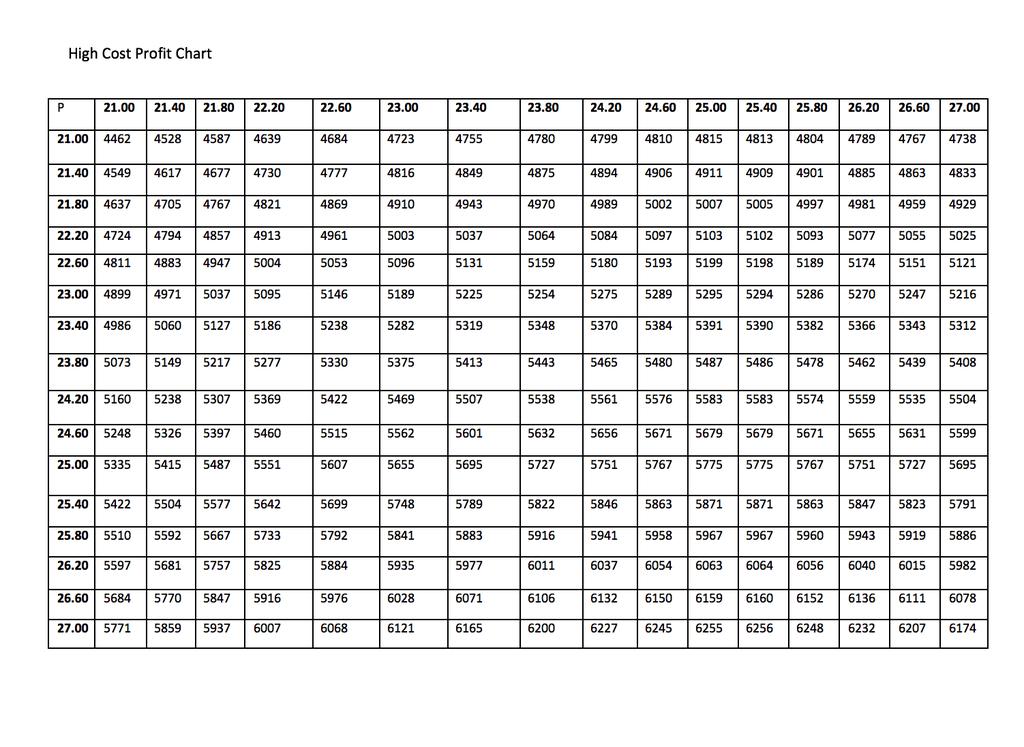
13 prices and profits 21. The demand equation allows for more comprehensible understanding as a participant, which is given by: 22 while the cost function for each firm is constant, yet asymmetric given by C a = 10 (6) C b = 7 (7) C c = 5 (8) Three firms are present with varying cost functions. By allowing varying costs when two of the three firms compete against each other, I hope to observe an effect of first and second-mover advantage based on the magnitude of costs 23. Finally, in regards to assumption i. that C 1 > C 2, C 1 can be either C a or C b, where C 2 can be either C b or C c. This possibly allows for observing decision making between firms that have varying percentage of higher costs of 40%, 43%, and 100% Methodology 3.1 Experimental Design The major setback in running a Stackelberg game at Colorado College was the lack of software that could replace the use of running the experiment with paper and pen. 21 Using the original demand equation (3), the prices were high around 60 units, with profits in the six-digit range. To allow more price inputs to be present on the payoff table, I decided to adapt the demand equation to give 5-digit profits and price inputs to be around 23 units. 22 a = 10 and b = In the experiment C 1 referred as the high-cost firm, C 2 is referred as the medium-cost firm, and C 3 is referred as the low-cost firm. 24 These percentages of cost differences are between C c and C b, C b and C a, C c and C a, respectively. 8
14 The use of software would allow for a major reduction in time and an increase in the rounds played. In order to run my experiment at Colorado College, it was first necessary to code my own software to allow for a high number of rounds to be played. This past summer I was taught Ruby on Rails at a ten-week intensive coding boot camp, where the last two weeks were spent on an individual project. The outcome of that time and the remainder of the summer was a real-time software that handled a 30-round Stackelberg Bertrand game. By building the game from scratch, I incorporated real-time connection to allow inputs to be sent back and forth immediately, and devise authentication with a random matching algorithm to allow for anonymity. 3.2 Subjects Twenty-four Colorado College undergraduate students took part in one session of sixty minutes. Fifty percent of the students were underclassmen (freshmen and sophomores), and forty-six percent of the students were female. Students were offered $5.00 for showing up to the experiment, $5.00 for finishing all thirty rounds, and told a bonus would be given of up to $18.00 depending on their average profit earned compared to cost similar competitors. All students had no prior knowledge of Stackelberg Bertrand competition and were selected from a wide variety of majors, including economics. Lastly, the issue of students knowing one another was not a concern because of the random and anonymous matching. 3.3 Procedure Students were instructed to show up to a testing lab furnished with 24 computers. Each computer was assigned either the role of the high-cost, medium-cost, or low-cost firm. Upon arrival, each participant was asked to draw a number for a random seat 9
15 assignment. When the participants sat down, the computer software instructed them to register using their name, student ID, and address. They were then instructed to sign in using their student ID and a password they created. After signing in, each student was instantly inserted into the game lobby where they were anonymously matched with another student. On each screen, the participant saw that they were either the leader or the follower for that specific round. Before the experiment begun, I clarified the instructions and initiated a practice round. Participants were encouraged to ask questions during and after their practice round. The session of thirty rounds lasted approximately forty minutes. In each round two students were randomly matched together, with one being the leader and the other being the follower. The leader would initiate the game by inputting a price from their profit table which sent in real-time to their respective follower. The follower used the input from the leader to select a price from their profit table before recording their own profit and sending a response price to the leader. The leader would then record their profit for the round, click refresh and begin their next round with a new partner from the game lobby. Once the leader was matched, a click for new opponent button appeared on the follower s screen. The new pairings would randomly assign a leader and follower for that round, allowing each student to experience the role of leader and follower throughout the thirty rounds. Upon completion, each participant was paid $5.00 and allowed to leave. A few students were asked about their observations while playing. Two students responded that their strategy was to play the price input for the column that held their highest respective payoffs; however, they noted that somewhere in the middle of the session, 10
16 opponents started to send inputs that would award both parties lower profits, as if the leader was trying to punish both parties. 4. Theoretical Background and Equilibriums In this experiment we have three firms, all with three different cost functions as seen in equations (6), (7), and (8). Once assigned the role of either leader or follower, firms are able to choose their price for each round. This allows one to theorize and predict the strategy for each firm depending on their high, medium, or low cost opponent. Participants did not have access to profit maximization functions, since allowing them to try and solve for their best input would be too time consuming, and many of the participants lacked the proper mathematical background. Instead, each student was given a profit table depending on their cost function 25. Participants used the profit table to select their inputs, which I theorized would lead students to pick the price input 26 of the column with the largest profits. To optimize price inputs for every firm depending on their opponent, I used profit maximization through each firm s reaction function. Each firm has the following profit function: P i (p 1, p 2 ) = (p i c i ) D i (p 1, p 2 ), where c i is either C a, C b, C c. (9) In a Stackelberg-Bertrand equilibrium, I can solve for the optimal price input by calculating the reaction functions of both the leader and the follower. The reaction function of the follower can be substituted into the profit maximizing equation to solve 25 See appendix. 26 This input was $25 for the high-cost firm, $23.80 for the medium-cost firm, and $22.60 for the low-cost firm. 11
17 for the leader s ideal output, and then used to solve for the follower s best response output. Using the profit function, we can generalize each reaction function with the following 27 : P! = (%! '!) (10 %!.96%!%/ + 40%/) (10) 2P3 243 %! '! 10 %!.96%!%/ + 40%/ = 0 (11) %! = :64;7.<=894; >75.<>4; (12) P/ = (%/ '/) (10 %/.96%/ :64;7.<=894; >75.<>4; :64;7.<=894; ) (13) >75.<>4; For this experiment, there are six pairs of observations I plan to analyze. With three different asymmetric costs and the need to understand the conditions of the first or second mover advantage, the following pairs for equilibrium and respective profits need to be addressed: Low-Cost 28 L vs High-Cost F Low-Cost L vs Medium-Cost F Medium-Cost L vs High-Cost F Medium-Cost L vs Low-Cost F High-Cost L vs Medium-Cost F High-Cost L vs Low-Cost F 4.1 Game Equilibria Low-Cost L vs High-Cost F Equilibriu Using the equations (6), (10), (11), (12), and the following High-Cost reaction = >67:<.=4; >75.<>4; (14) yields the preceding result when combined with equations (14), (8), and (13): 27 In the following equations, p i is the price of the follower. 28 L and F stand for the respective leader or follower of the Stackelberg-Bertrand game. 12
18 @/ = P/ = The strategy for the Low-Cost leader to play the ideal output of P j can be substituted into the reaction function of the follower to yield the following price and = P! = By following the same method for optimizing the maximizing price input and respective profit, I calculate the equilibriums for the remaining pairs. Low-Cost L vs Medium-Cost F Equilibrium The reaction function for the Medium-Cost = 5E7:=.E>4; >75.<>4; (15) Yielding for the Low-Cost leader: Medium-Cost = P/ = = P! = Medium-Cost L vs High-Cost F Reaction function for the High-Cost = >67:<.=4; >75.<>4; (16) Yielding for the Medium-Cost leader: High-cost = P/ =
19 @! = P! = Medium-Cost L vs Low-Cost F Reaction function for the Low-Cost = 5G7::.H4; >75.<>4; (17) Yielding for the Medium-Cost leader: Low-Cost = P/ = = P! = High-Cost L vs Medium-Cost F The High-Cost leader: Medium-Cost = 5E7:=.E>4; = P/ = = P! = (18) High-Cost L vs Low-Cost F The High-Cost leader: Low-Cost = 5G7::.H4; = P/ = (19) 14
20 @! = 22.4 P! = Hypotheses Hypothesis 1. The average price input and profit for the low-cost, medium-cost, and high-cost leaders will be equal to the game equilibriums found in section 4.1. Hypothesis 2. The average price input and profit for the low-cost, medium-cost, and high-cost followers will be equal to the game equilibriums found in section 4.1. Hypothesis 3. Due to assumptions one and two from section 2, each firm will prefer to lead than to follow. Because there is no data directly asking each firm if they want to be the leader or the follower to reflect a preference, I will hypothesize if Õ Leader > Õ Follower for any respective cost firm, then each firm prefers to be the leader. Furthermore, firms will have a first-mover advantage where Õ Leader > Õ Follower. Hypothesis 4. In trying to understand a new game, I theorize that the subjects of the experiment will move towards the equilibrium of each pairing in the latter rounds of the experiment. 6. Experimental Results The results of the participants are organized into four subsections. Section 6.1 presents the aggregate results by analyzing the average profit per input and more importantly the number of cases when the equilibrium by each firm type was played. Section 6.2 displays price inputs and profits divided into three groups, where each group corresponds to a different set of rounds. Section 6.3 exhibits the observed average response price input to each Stackelberg-leader s price input. The response inputs are 15
21 compared to the calculated best response function. 6.3 also calculates the observed response function for each firm type. Finally, section 6.4 attempts at modeling the interaction between competitors using a system of differential equations. 6.1 Equilibrium Data Table I presents the collective number of cases where either the follower or the leader played the game equilibrium. One issue to note is the variability of N for each firm. This is due to two players of the twenty-four student sample group having to be dropped. The two players dropped were both low cost players and their respective observations were removed due to corrupt data 29. Table I shows the number of times a firm played the game equilibrium against the two other opponents. Inspection of table I reveals that Medium-Cost firms played the various games equilibriums the most often with 58% as a Stackelberg-leader and 69% as a Stackelberg-follower. High-Cost firms 29 The data was corrupt because both players failed to follow the instructions. They believed that they were leaders for all rounds when verbal instructions clarified that each round the leader and follower would be randomly selected and the role for that player would appear on the respective screen. 16
22 played the various games equilibriums the least with 34% as a Stackelberg-leader and 35% as a Stackelberg-follower. Table I also shows that the equilibrium was played, percentagewise, a higher number times when a firm was a follower compared to when that same firm was a leader. Behaviorally, this may make sense because observing the payoff tables for each firm, it is clear that a single column 30 in each table gives the highest payoff. Therefore, as a follower, it makes logical sense to always choose the highest payoff. This could be a possible explanation as to why followers played the game equilibrium a higher number of times. Table III displays the average price input for the leader against their respective opponent in the first section of the table, and the average price input for the follower 30 Appendix shows one column in each payoff table with a higher profit. 17
23 against their opponent in the second section of the table. To establish credibility of averages in Table III, all input pairs for each type of game were tested for normality. Table III also exhibits the equilibrium for the respective game being played. The average price inputs are broken into three groups: Rounds 1-10, Rounds 11-20, and Rounds In breaking the average price inputs into these groups one can observe if firms moved closer or further from the game equilibrium as the number of rounds played for each firm grew. We note that there were three distinct instances when the average price input between the three groups approached the game equilibrium. This occurred for the games of Medium-Cost leader versus Low-Cost follower, High-Cost leader versus Medium-Cost follower, and High-Cost follower versus Low-Cost leader. Each type of game may not approach the game equilibrium throughout each grouping distinction because of a few players choosing inputs furthest from the equilibrium First and Second Mover Advantage In this subsection we analyze the average profit for each type of firm, displayed in figure 1. More specifically, we address the profit difference between being a leader or a follower against the same type of firm. Earlier in this paper we defined a first mover advantage when Õ Leader > Õ Follower. Following this definition of an advantage we analyze the profit difference for each firm by grouping the average profits in three distinct sections: Rounds 1-10, Rounds 11-20, and Rounds In the graph of Low-Cost vs Medium-Cost, the profit as a leader outweighs the profit as a follower. In this case we observe that the Low-Cost firm holds a first mover advantage. However, the average 31 There are many cases when students played inputs far from the equilibrium, where their respective opponents capitalized and played non-equilibrium inputs yielding high profit. 18
24 profits displayed in the graph of Low-Cost vs High-Cost exhibits that the Low-Cost firm earns a higher average profit as the follower, depicting a second mover advantage. In the Medium-Cost vs Low-Cost graph we observe a partial first mover advantage due to the average profits of the Medium-Cost firm being higher in two of the three groupings. However, in the Medium-Cost vs High-Cost graph we observe the opposite, where the Medium-Cost firm has a second mover advantage in two of the three groupings. In the final two graphs we see a mix of advantages. In the High-Cost vs Low-Cost graph we note that the High-Cost firm has a second mover advantaged in two of the three groups, while having a first mover advantage in two of the three groupings in the remaining graph. Note the pattern of the Low-Cost and Medium-Cost firms; they have a first mover advantage when playing a firm with a relatively closer cost difference 32. The same pattern of high profits holds for the Low-Cost and Medium-Cost firms when they are matched with a firm with a greater cost difference, giving a second mover advantage. It is surprising that Low-Cost firms have a first mover advantage against firms with almost equal cost functions, yet a second mover advantage against firms with larger cost differences. Asymmetric firms will have a first mover advantage if their reaction function is downward sloping in a duopolistic market (Amir & Stepanova, 2006). The assumptions to our profit functions gave each firm the ability to have a first mover advantage, yet with larger cost discrepancies, firms preferred to play as the follower. 6.3 Observed Response and Best Response Figure 2 shows the calculated best responses as well as the observed responses from each game. The graphs in Figure 2 each display the collective average response 32 The costs for each firm are 5,7, and 10 for the Low-Cost, Medium-Cost, and High-Cost firms, respectively. 19
25 input by the follower for each price inputted by the respective Stackelberg-leader. The calculated best response functions all have slight positive slopes that are located near the equilibrium for the respective game played. The observed responses for each input vary greatly, however; each graph displays at least one point which falls either on or in close proximity to the calculated best response inputs. The responses of the Medium-Cost followers against High-Cost firms almost mimic the calculated best responses. Using the responses for each follower, the following observed reaction functions were calculated for each type of firm: Low-Cost Follower I = @ J (20) Medium-Cost Follower I = @ J (21) High-Cost Follower I = @ J (22) Over time we observe that when the leader increases their prices, the Low-Cost follower will decrease their prices until zero, while Medium and High-Cost firms will increase their prices as P L increases. The observed reaction functions provide experimental understanding towards relevant literature. When two identical firms move sequentially, the leader earns a lower profit than the follower when the reaction functions are upward sloping (Gal-Or, 1985). Although the Medium and High-Cost firms are not identical, both observed reaction functions are upward sloping. Figure 1 of observed average profits displays Medium-Cost firms earning higher profits 33 as a follower against High-Cost firms. However, the opposite is true for the High-Cost firm against a Medium- Cost firm as inferred from Figure 2. Even though these firms are not identical, it is interesting to note the higher yield of profit for the Medium-Cost firm as a follower when playing an opponent with higher costs. Finally, when both reaction functions are 33 Medium-Cost firms yielded larger profits in 2/3 round groups, leading to the assumption that Medium- Cost firms have the first mover advantage. 20
26 downward sloping, both firms have a first mover advantage (Amir & Stepanova, 2006). Only the Low-Cost firm has an observed downward sloping reaction function, yet Figure 2 displays higher average profits as a follower against an opponent with larger cost differences. 6.4 Differential Equations Application Regardless of the type of cost-firm matchup, behavior in the experimental Stackelberg markets does not reach the predicted theoretical outcome. Instead, behavior by the varying cost firms fails to follow a common strategy. Using differential equations, we can attempt to model the long term behavior between two competing firms. Recall from Section 2 and Section 4.1 that each competing firm has varying costs and theoretically predicted profits. Further observation of Figure 1 shows that Low-Cost firms earn on average higher profits than medium and high cost firms. The same applies to Medium-Cost firms in respect to High-Cost firms. We will use the cost advantage between firms to model two competing firms in a predator-prey system. Predator-prey systems allow long term behavior to be analyzed; however, to apply this model to our competing cost firms, many assumptions need to be made. The following is a modified predator-prey system (Blanchard, 2012): 2; 2K = L/ 1 ; M N/! (23) 29 2K = O! + P/! (24) The first differential equation is a logistical growth model for the prey, where j represents the population, L represents the growth constant of j, N is the carrying capacity of j, and N is the proportion of interaction between i and j. The second 21
27 differential equation is the predator growth of model of population i by positively benefiting from the interaction with j, where O is the negative growth of i, and P is the positive proportion of interaction between i and j. To modify this equation to model interaction between two competing firms, we assume the prey is the high cost firm, and the predator the low cost firm. However, we need to assume that in our model only two firms compete in the experimental market. If one firm leaves the market, we assume that the remaining firm takes control of the monopolistic market. Furthermore, we assume that once a firm leaves the market, no other firms enter. Finally, the predator prey system measures the rate of profit instead of population growth, where j becomes P/, profit of the high cost firm, and i becomes P!, profit of the low cost firm. Therefore, both the predator and prey firms have logistical growth giving us the following system: 2P; 2K 2P9 2K = LP/ 1 P; M; P9 = QP! 1 M9 NP/P! (25) RP/P! (26) The second differential equation now has logistical growth where Q and R are the growth constant and the proportion of interaction, respectively. Due to P/ being the high cost firm, N > R is assumed due to the assumption that high cost is a disadvantage. Next, Q > L is inferred due to the assumption that in an asymmetric duopolistic market with heterogeneous goods, the lower cost firm will have a greater rate of profit growth over time. Finally, T! > T/ is assumed due to lower costs. Validating all of the assumptions made, the following system is created with numerical values: 2P; 2K = P/ 1 P; 566,666.2P/P! (27) 22

28 2P9 2K = 1.2P! 1 P9 5G6,666.1P/P! (28) The result of our system of differential equations is displayed in Figure 3. Figure 3 displays the phase portrait, which shows the directional field and various solutions curves for different initial conditions. The y-axis describes the profit behavior for the low cost firm, while the x-axis describes the profit behavior for the high cost firm. The solution curves for various initial conditions follow the directional field as time increases. The result is five distinct regions. If the initial condition for profit is in Region I, the long term behavior goes to the carrying capacity for the high cost firm, and zero for the low cost firm. This takes place only if the initial profit for the high cost firm is nearly three times the initial profit of the low cost firm, such as the point (30,10). Recall from Section 4 that the profit functions for a low cost and high cost firm are similar, where price inputs and cost vary. Therefore, 23
29 it is unlikely that long term profit will fall in Region I, as a high cost firm must earn a profit nearly three times greater than the low cost firm. However, this may explain the behavior of inputs away from the predicted Stackelberg equilibrium, as players may force favorable inputs for themselves as a leader, only to be punished by the follower. In Region II & Region III, we observe initial profit conditions that are positive for both firms and positive for the low cost and negative for the high cost, respectively. In both scenarios the long term behavior of profit approaches the carrying capacity for the low cost firm. Both these cases display that the low cost firm will drive the high cost firm out of the business. An interesting note is the directional vector in Region II, where positive initial conditions will decrease both firms profits. However, the high cost firm will continue to decrease towards zero, while the low cost firm will start to have logistical growth at the approximate line of y = 10. Region IV will be an initial condition of negative profit, and will continue to grow negative. Region V displays a positive initial condition for the high cost firm and a negative initial condition for the low cost firm. Due to the bounds of price in the experimental game, Regions III, IV, and V can be ignored as negative profit was unattainable. Focusing on Regions I & II, an equilibrium point to the system can be observed around the point (12,5). At these initial conditions for profit, both firms will be in equilibrium such that the growth of profit is zero. Lastly, the long term behavior in Regions I & II depicts the duopolistic market shifting into a monopolistic market. However, it is extremely difficult for the high cost firm to oust the low cost firm. The result is either the high cost firm earns profit until being removed from the market, or to play extreme price inputs so that profit is roughly three times greater than the low cost, 24
30 resulting in the behavior of Region I. However, landing in Region I by inputting extreme values will fail almost every time if the high cost firm is a market leader. This implies that a high cost firm is better off as a market follower. 7. Discussion In this section we address whether or not the various hypotheses stated in Section 6 hold. More importantly, we summarize our results by stating our own conclusions. Based upon our results, hypothesis 1 and 2 fail to fully hold as the highest percentage for the collective number of times an equilibrium was played was 69%. Hypothesis 3 holds for Low-Cost and Medium-Cost firms when the opponent is also either a Low-Cost or Medium-Cost firm, but fails when the Low-Cost or Medium-Cost firm is paired with the High-Cost firm. Hypothesis 4 holds true in three of the twelve potential firm pairings, which ultimately is a rejection of hypothesis 4. Result 1: Calculated Nash equilibriums are rarely played in Stackelberg games, as followers have the opportunity to capitalize on behavioral error, skewing the observed average inputs. Result 2: Subjects will have problems understanding the game leading to either removing observations or risk highly skewed data. Result 3: Various cost differences allow for long term profit advantages dependent on the initial starting profit of a firm. Result 4: A firm with a cost advantage will not always have a first mover advantage. If the cost advantage is much larger, a second-mover advantage is present. 25
31 Result 5: There appears to be a cost difference value when the lower cost firm switches from a first mover advantage to a second mover advantage. In spite of these results, it is difficult to predict the behavior of each various firm. It appears that subjects will vary in behavior which can be attributed to a multitude of reasons such as lack of knowledge, understanding or failure to follow directions. More importantly, we note that to make the game easier to comprehend the exact equilibrium solutions were not present on the profit tables provided. To account for the variability of these conditions it would be considerate to rerun this experiment with set roles and only two firms: low and high cost. Multiple sessions would be run, where the difference in cost between the low and high cost firms vary in each session. 8. Conclusion The theoretical results provided by Amir and Stepanova (2006) failed to hold in our experimental game, where a first mover advantage was the supposed outcome for low cost firms. If our game comprised of only two firms, one low cost and one high cost, then this hypothesis might have held. However, with the inclusion of a third firm, medium cost, our results show that there is a point between the differences in costs, which switch the low cost firm having a first mover advantage to having a second mover advantage. This allows for further study to identify the degree of cost differences that result in a first or second mover advantage. 26
32 Figure. 1. Average profit as leader and follower against the same type of firm. Low-Cost vs Medium-Cost Medium-Cost vs Low-Cost High-Cost vs Low-Cost Profit ($) Profit as Leader Profit as Follower Profit ($) Profit as Leader Profit as Follower Profit ($) Profit as Leader Profit as Follower Low-Cost vs High-Cost Medium-Cost vs High-Cost High-Cost vs Medium-Cost Profit ($) Profit as Leader Profit as Follower Profit ($) Profit as Leader Profit as Follower Profit ($) Profit as Leader Profit as Follower 27
33 Fig. 2. Observed response for each input compared to the theoretical best response. Observed Response for Low-Cost Follower vs Medium-Cost Leader Variable 27 Low4Response BestResponse4 26 Observed Response for Medium-Cost Follower vs Low-Cost Leader Variable 27.0 Medium2Response BestResponse Observed Response for High-Cost Follower vs Medium-Cost Leader Variable 27 High3Response BestResponse3 Price (Low-Cost Follower) Price (Medium-Cost Follower Price (High-Cost Follower) Price (Medium-Cost Leader) Price (Low-Cost Leader) Price (Medium-Cost Leader) Price (Low-Cost Follower) Observed Response for Low-Cost Follower vs High-Cost Leader Variable Low5Response BestResponse5 Price (Medium-Cost Follower) Observed Response for Medium-Cost Follower vs High-Cost Leader 26.5 Variable Medium6Response BestResponse Price (High-Cost Follower Observed Response for High-Cost Follower vs Low-Cost Leader Variable 27 High1Response BestResponse Price (High-Cost Leader) Price (High-Cost Leader) Price (Low-Cost Leader) 28

34 Appendix 29
35 30
36 9. References Amir, R., & Stepanova, A. (2006). Second-mover advantage and price leadership in Bertrand duopoly. Games and Economic Behavior, 55(1), Blanchard, Paul, Robert L. Devaney, and Glen R. Hall. Differential Equations. Boston, MA: Brooks/Cole, Cengage Learning, Print. Damme, E. V., & Hurkens, S. (2004). Endogenous price leadership. Games and Economic Behavior, 47(2), Gal-Or, E. (1985). First Mover and Second Mover Advantages. International Economic Review, 26(3), 649. Huck, S., Muller, W., & Normann, H. (2001). Stackelberg Beats Cournot - On Collusion and Efficiency in Experimental Markets. The Economic Journal, 111(474), Huck, S., Müller, W., & Normann, H. (2002). To Commit or Not to Commit: Endogenous Timing in Experimental Duopoly Markets. Games and Economic Behavior, 38(2), Kaldor, N., & Stackelberg, H. V. (1934). Marktform und Gleichgewicht. Economica, 3(10), 227. Kübler, D., & Müller, W. (2002). Simultaneous and sequential price competition in heterogeneous duopoly markets: experimental evidence. International Journal of Industrial Organization, 20(10), Ledvina, A. F., & Sircar, R. (2011). Bertrand and Cournot Competition Under Asymmetric Costs: Number of Active Firms in Equilibrium. SSRN Electronic Journal. Macgregor, D. H., Cournot, A., & Bacon, N. T. (1929). The Mathematical Principles of the Theory of Wealth, The Economic Journal, 39(153), 91. Rebelein, R., & Turkay, E. (2016). When do first-movers have an advantage? A Stackelberg classroom experiment. The Journal of Economic Education, 47(3), Singh, N., & Vives, X. (1984). Price and Quantity Competition in a Differentiated Duopoly. The RAND Journal of Economics, 15(4),
Oligopoly: How do firms behave when there are only a few competitors? These firms produce all or most of their industry s output.
 Topic 8 Chapter 13 Oligopoly and Monopolistic Competition Econ 203 Topic 8 page 1 Oligopoly: How do firms behave when there are only a few competitors? These firms produce all or most of their industry
Chapter 9: Static Games and Cournot Competition
 Chapter 9: Static Games and Cournot Competition Learning Objectives: Students should learn to:. The student will understand the ideas of strategic interdependence and reasoning strategically and be able
Managerial Economics & Business Strategy Chapter 9. Basic Oligopoly Models
 Managerial Economics & Business Strategy Chapter 9 Basic Oligopoly Models Overview I. Conditions for Oligopoly? II. Role of Strategic Interdependence III. Profit Maximization in Four Oligopoly Settings
ECN 3103 INDUSTRIAL ORGANISATION
 ECN 3103 INDUSTRIAL ORGANISATION 5. Game Theory Mr. Sydney Armstrong Lecturer 1 The University of Guyana 1 Semester 1, 2016 OUR PLAN Analyze Strategic price and Quantity Competition (Noncooperative Oligopolies)
Chapter 13. Oligopoly and Monopolistic Competition
 Chapter 13 Oligopoly and Monopolistic Competition Chapter Outline Some Specific Oligopoly Models : Cournot, Bertrand and Stackelberg Competition When There are Increasing Returns to Scale Monopolistic
14.01 Principles of Microeconomics, Fall 2007 Chia-Hui Chen November 7, Lecture 22
 Monopoly. Principles of Microeconomics, Fall Chia-Hui Chen November, Lecture Monopoly Outline. Chap : Monopoly. Chap : Shift in Demand and Effect of Tax Monopoly The monopolist is the single supply-side
Oligopoly Pricing. EC 202 Lecture IV. Francesco Nava. January London School of Economics. Nava (LSE) EC 202 Lecture IV Jan / 13
 EC 202 Lecture IV Jan / 13") Oligopoly Pricing EC 202 Lecture IV Francesco Nava London School of Economics January 2011 Nava (LSE) EC 202 Lecture IV Jan 2011 1 / 13 Summary The models of competition presented in MT explored the consequences
Oligopoly Pricing EC 202 Lecture IV Francesco Nava London School of Economics January 2011 Nava (LSE) EC 202 Lecture IV Jan 2011 1 / 13 Summary The models of competition presented in MT explored the consequences
A PRICE GAME WITH PRODUCT DIFFERENTIATION IN THE CLASSROOM
 A PRICE GAME WITH PRODUCT DIFFERENTIATION IN THE CLASSROOM Jan Edman Penn State University jme22@psu.edu ABSTRACT This paper describes how a small game is used in the classroom to teach theory and decision
INTERMEDIATE MICROECONOMICS LECTURE 13 - MONOPOLISTIC COMPETITION AND OLIGOPOLY. Monopolistic Competition
 13-1 INTERMEDIATE MICROECONOMICS LECTURE 13 - MONOPOLISTIC COMPETITION AND OLIGOPOLY Monopolistic Competition Pure monopoly and perfect competition are rare in the real world. Most real-world industries
ECONOMICS. Paper 3 : Fundamentals of Microeconomic Theory Module 28 : Non collusive and Collusive model
 Subject Paper No and Title Module No and Title Module Tag 3 : Fundamentals of Microeconomic Theory 28 : Non collusive and Collusive model ECO_P3_M28 TABLE OF CONTENTS 1. Learning Outcomes 2. Introduction
Imperfect Competition
 Imperfect Competition 6.1 There are only two firms producing a particular product. The demand for the product is given by the relation p = 24 Q, where p denotes the price (in dollars per unit) and Q denotes
Stackelberg or Cournot Equilibria", Games and Economic Behavior, 2, 29-46, 1990.
 Hamilton, Jonathan H., and Steven M. Slutsky, "Endogenous Timing in Duopoly Games: Stackelberg or Cournot Equilibria", Games and Economic Behavior, 2, 29-46, 1990. Kahana, Nava, "Do Multiplant Labor-Managed
The Analysis of Competitive Markets
 C H A P T E R 12 The Analysis of Competitive Markets Prepared by: Fernando & Yvonn Quijano CHAPTER 12 OUTLINE 12.1 Monopolistic Competition 12.2 Oligopoly 12.3 Price Competition 12.4 Competition versus
U n iversity o f H ei delberg. From Imitation to Collusion A Comment Jörg Oechssler, Alex Roomets, and Stefan Roth
 U n iversity o f H ei delberg Department of Economics Discussion Paper Series No. 588 482482 From Imitation to Collusion A Comment Jörg Oechssler, Alex Roomets, and Stefan Roth March 2015 From Imitation
Chapter 6. Game Theory Two
 6.8 Repeated Games A game that is played only once is called a one-shot game. Repeated games are games that are played over and over again. Repeated Game = A game in which actions are taken and payoffs
The Retailers Choices of Profit Strategies in a Cournot Duopoly: Relative Profit and Pure Profit
 Modern Economy, 07, 8, 99-0 http://www.scirp.org/journal/me ISSN Online: 5-76 ISSN Print: 5-745 The Retailers Choices of Profit Strategies in a Cournot Duopoly: Relative Profit and Pure Profit Feifei Zheng
Microeconomics (Oligopoly & Game, Ch 12)
") Microeconomics (Oligopoly & Game, Ch 12) Lecture 17-18, (Minor 2 coverage until Lecture 18) Mar 16 & 20, 2017 CHAPTER 12 OUTLINE 12.1 Monopolistic Competition 12.2 Oligopoly 12.3 Price Competition 12.4
Microeconomics (Oligopoly & Game, Ch 12) Lecture 17-18, (Minor 2 coverage until Lecture 18) Mar 16 & 20, 2017 CHAPTER 12 OUTLINE 12.1 Monopolistic Competition 12.2 Oligopoly 12.3 Price Competition 12.4
Chapter 15 Oligopoly
 Goldwasser AP Microeconomics Chapter 15 Oligopoly BEFORE YOU READ THE CHAPTER Summary This chapter explores oligopoly, a market structure characterized by a few firms producing a product that mayor may
Working Paper No Can By-product Lobbying Firms Compete? Paul Pecorino
 Working Paper No. -2-3 Can By-product Lobbying Firms Compete? Paul Pecorino February 2 Can By-product Lobbying Firms Compete? Paul Pecorino* Department of Economics, Finance and Legal Studies Box 87224
Competition and Incentives
 Competition and Incentives Lisa Fey University of Munich Klaus M. Schmidt University of Munich Carmen Thoma University of Munich ENDOGENOUS PREFERENCES AND THE BROADER EFFECTS OF COMPETITION KNAW, Amsterdam,
Modeling of competition in revenue management Petr Fiala 1
 Modeling of competition in revenue management Petr Fiala 1 Abstract. Revenue management (RM) is the art and science of predicting consumer behavior and optimizing price and product availability to maximize
Do not open this exam until told to do so. Solution
 Do not open this exam until told to do so. Department of Economics College of Social and Applied Human Sciences K. Annen, Fall 003 Final (Version): Intermediate Microeconomics (ECON30) Solution Final (Version
ECMC02H Intermediate Microeconomics - Topics in Price Theory
 1 ECMC02H Intermediate Microeconomics - Topics in Price Theory Answers to the Term Test June 23, 2010 Version A of the test Your name (Print clearly and underline your last name) Your student number 1.
Econ Microeconomic Analysis and Policy
 ECON 500 Microeconomic Theory Econ 500 - Microeconomic Analysis and Policy Monopoly Monopoly A monopoly is a single firm that serves an entire market and faces the market demand curve for its output. Unlike
Chapter 12. Oligopoly. Oligopoly Characteristics. Oligopoly Equilibrium
 Chapter Oligopoly Oligopoly Characteristics Small number of firms Product differentiation may or may not eist Barriers to entry Chapter Oligopoly Equilibrium Defining Equilibrium Firms are doing the best
! lecture 7:! competition and collusion!!
 ! lecture 7:! competition and collusion!! the story so far Natural monopoly: Definitions (Ideal) Pricing solutions Regulation in practice Regulation under asymmetric information Competition policy: Introduction
Collusion. Sotiris Georganas. February Sotiris Georganas () Collusion February / 31
 Collusion February / 31") Collusion Sotiris Georganas February 2012 Sotiris Georganas () Collusion February 2012 1 / 31 Outline 1 Cartels 2 The incentive for cartel formation The scope for collusion in the Cournot model 3 Game
Collusion Sotiris Georganas February 2012 Sotiris Georganas () Collusion February 2012 1 / 31 Outline 1 Cartels 2 The incentive for cartel formation The scope for collusion in the Cournot model 3 Game
Universitat Autònoma de Barcelona Department of Applied Economics
 Universitat Autònoma de Barcelona Department of Applied Economics Annual Report Endogenous R&D investment when learning and technological distance affects absorption capacity Author: Jorge Luis Paz Panizo
Lecture 22. Oligopoly & Monopolistic Competition
 Lecture 22. Oligopoly & Monopolistic Competition Course Evaluations on Thursday: Be sure to bring laptop, smartphone, or tablet with browser, so that you can complete your evaluation in class. Oligopoly
Note on webpage about sequential ascending auctions
 Econ 805 Advanced Micro Theory I Dan Quint Fall 2007 Lecture 20 Nov 13 2007 Second problem set due next Tuesday SCHEDULING STUDENT PRESENTATIONS Note on webpage about sequential ascending auctions Everything
Game Theory & Firms. Jacob LaRiviere & Justin Rao April 20, 2016 Econ 404, Spring 2016
 Game Theory & Firms Jacob LaRiviere & Justin Rao April 20, 2016 Econ 404, Spring 2016 What is Game Theory? Game Theory Intuitive Definition: Theory of strategic interaction Technical Definition: Account
Volume 30, Issue 3. Specialization through Cross-licensing in a Multi-product Stackelberg Duopoly
 Volume 30, Issue 3 Specialization through Cross-licensing in a Multi-product Stackelberg Duopoly Luigi Filippini Università Cattolica, Milano Abstract We argue that cross-licensing is a device to establish
Strategic Corporate Social Responsibility
 Strategic Corporate Social Responsibility Lisa Planer-Friedrich Otto-Friedrich-Universität Bamberg Marco Sahm Otto-Friedrich-Universität Bamberg and CESifo This Version: June 15, 2015 Abstract We examine
Managerial Economics Chapter 9 Practice Question
 ECO 3320 Lanlan Chu Managerial Economics Chapter 9 Practice Question 1. The market for widgets consists of two firms that produce identical products. Competition in the market is such that each of the
OPTIMAL R&D POLICY AND ENDOGENOUS QUALITY CHOICE
 MS # 1949 OPTIMAL R&D POLICY AND ENDOGENOUS QUALITY CHOICE Tsuyoshi TOSHIMITSU * Kwansei Gakuin University Final version March 2003 Abstract In a quality-differentiated duopoly where (i) quality is endogenously
Solutions to Final Exam
 Solutions to Final Exam AEC 504 - Summer 2007 Fundamentals of Economics c 2007 Alexander Barinov 1 Veni, vidi, vici (30 points) Two firms with constant marginal costs serve two markets for two different
Econ Economics of Public Sector HW #1 Suggested Solutions.
 Econ 411-1 Economics of Public Sector HW #1 Suggested Solutions. by Anna Rubinchik-Pessach October 7, 1 Problem 1: Chapter 5, q.4 Cash-for-Clunkers Program The goal of the EPA policy is to limit emission
A study of cartel stability: the Joint Executive Committee, Paper by: Robert H. Porter
 A study of cartel stability: the Joint Executive Committee, 1880-1886 Paper by: Robert H. Porter Joint Executive Committee Cartels can increase profits by restricting output from competitive levels. However,
PRICE DISCRIMINATION IN STACKELBERG COMPETITION
 THE JOURNAL O INDUSTRIAL ECONOMICS 00-181 Volume LVII June 009 No. Notes on the Journal of Industrial Economics Website www.essex.ac.uk/jindec/ PRICE DISCRIMINATION IN STACKELBERG COMPETITION LEVENT KUTLU
The Competitive Model in a More Realistic Setting
 CHAPTER 13 Monopolistic Competition: The Competitive Model in a More Realistic Setting Chapter Summary and Learning Objectives 13.1 Demand and Marginal Revenue for a Firm in a Monopolistically Competitive
Econ 001: Midterm 2 (Dr. Stein) Answer Key March 31, 2008
 Answer Key March 31, 2008") Instructions: Econ 001: Midterm 2 (Dr. Stein) Answer Key March 31, 2008 This is a 60-minute examination. Write all answers in the blue books provided. Show all work. Use diagrams where appropriate and
Instructions: Econ 001: Midterm 2 (Dr. Stein) Answer Key March 31, 2008 This is a 60-minute examination. Write all answers in the blue books provided. Show all work. Use diagrams where appropriate and
Cardiff Economics Working Papers
 Cardiff Economics Working Papers Working Paper No. E016/3 Gains from Variety? Product Differentiation and the Possibility of Losses from rade under Cournot Oligopoly with Free Entry David R. Collie pril
Reverse Pricing and Revenue Sharing in a Vertical Market
 Reverse Pricing and Revenue Sharing in a Vertical Market Qihong Liu Jie Shuai January 18, 2014 Abstract Advancing in information technology has empowered firms with unprecedented flexibility when interacting
C H A P T E R 12. Monopolistic Competition and Oligopoly CHAPTER OUTLINE
 C H A P T E R 12 Monopolistic Competition and Oligopoly CHAPTER OUTLINE 12.1 Monopolistic Competition 12.2 Oligopoly 12.3 Price Competition 12.4 Competition versus Collusion: The Prisoners Dilemma 12.5
Analytic Preliminaries for Social Acceptability of Legal Norms &
 Analytic Preliminaries for Social Acceptability of John Asker February 7, 2013 Yale Law School Roadmap Build on case studies of environments where extra-legal norms are at least as important as formal
SUBJ SCORE # Version D: Page 1 of 9. (signature) 2. Please write your name and GU ID carefully and legibly at the top of this page.
 2. Please write your name and GU ID carefully and legibly at the top of this page.") SUBJ SCORE # Version D: Page 1 of 9 Economics 001 NAME Professor Levinson GU ID # Midterm #2 November 12, 2012 DO NOT BEGIN WORKING UNTIL THE INSTRUCTOR TELLS YOU TO DO SO. READ THESE INSTRUCTIONS FIRST.
SUBJ SCORE # Version D: Page 1 of 9 Economics 001 NAME Professor Levinson GU ID # Midterm #2 November 12, 2012 DO NOT BEGIN WORKING UNTIL THE INSTRUCTOR TELLS YOU TO DO SO. READ THESE INSTRUCTIONS FIRST.
Price competition in a differentiated products duopoly under network effects
 Price competition in a differentiated products duopoly under network effects Krina Griva Nikolaos Vettas February 005 Abstract We examine price competition under product-specific network effects, in a
29/02/2016. Market structure II- Other types of imperfect competition. What Is Monopolistic Competition? OTHER TYPES OF IMPERFECT COMPETITION
 Market structure II- Other types of imperfect competition OTHER TYPES OF IMPERFECT COMPETITION Characteristics of Monopolistic Competition Monopolistic competition is a market structure in which many firms
Business 33001: Microeconomics
 Business 33001: Microeconomics Owen Zidar University of Chicago Booth School of Business Week 8 Owen Zidar (Chicago Booth) Microeconomics Week 8: Oligopoly & Strategy 1 / 89 Today s Class 1 Overview of
Education, Institutions, Migration, Trade, and The Development of Talent
 Education, Institutions, Migration, Trade, and The Development of Talent Dhimitri Qirjo Florida International University This Version: March 2010 Abstract This paper proposes a theory of free movement
The Role of Price Floor in a Differentiated Product Retail Market 1
 The Role of Price Floor in a Differentiated Product Retail Market 1 Barna Bakó 2 Corvinus University of Budapest Hungary 1 I would like to thank the anonymous referee for the valuable comments and suggestions,
STATISTICAL TECHNIQUES. Data Analysis and Modelling
 STATISTICAL TECHNIQUES Data Analysis and Modelling DATA ANALYSIS & MODELLING Data collection and presentation Many of us probably some of the methods involved in collecting raw data. Once the data has
Preface. Chapter 1 Basic Tools Used in Understanding Microeconomics. 1.1 Economic Models
 Preface Chapter 1 Basic Tools Used in Understanding Microeconomics 1.1 Economic Models 1.1.1 Positive and Normative Analysis 1.1.2 The Market Economy Model 1.1.3 Types of Economic Problems 1.2 Mathematics
PICK ONLY ONE BEST ANSWER FOR EACH BINARY CHOICE OR MULTIPLE CHOICE QUESTION.
 Econ 101 Summer 2015 Answers to Second Mid-term Date: June 15, 2015 Student Name Version 1 READ THESE INSTRUCTIONS CAREFULLY. DO NOT BEGIN WORKING UNTIL THE PROCTOR TELLS YOU TO DO SO You have 75 minutes
Principles of Microeconomics Assignment 8 (Chapter 10) Answer Sheet. Class Day/Time
 Answer Sheet. Class Day/Time") 1 Principles of Microeconomics Assignment 8 (Chapter 10) Answer Sheet Name Class Day/Time Questions of this homework are in the next few pages. Please find the answer of the questions and fill in the blanks
1 Principles of Microeconomics Assignment 8 (Chapter 10) Answer Sheet Name Class Day/Time Questions of this homework are in the next few pages. Please find the answer of the questions and fill in the blanks
Signaling Quality Through Prices in an Oligopoly.
 Signaling Quality Through Prices in an Oligopoly. Maarten C.W. Janssen University of Vienna, Austria and Tinbergen Institute Rotterdam, The Netherlands. Santanu Roy Southern Methodist University, Dallas,
References. Deneckere, R. (1983), Duopoly Supergames with Product Differentiation, Economics Letters, 11, pp
, Duopoly Supergames with Product Differentiation, Economics Letters, 11, pp") References Chang M. (1991), The Effects of Product Differentiation on Collusive Pricing, International Journal of Industrial Organization, 9, pp.453-69. Deneckere, R. (1983), Duopoly Supergames with Product
References Chang M. (1991), The Effects of Product Differentiation on Collusive Pricing, International Journal of Industrial Organization, 9, pp.453-69. Deneckere, R. (1983), Duopoly Supergames with Product
Advanced Microeconomics Theory. Chapter 8: Game Theory and Imperfect Competition
 Advanced Microeconomics Theory Chapter 8: Game Theory and Imperfect Competition Outline Game Theory Tools Bertrand Model of Price Competition Cournot Model of Quantity Competition Product Differentiation
Competition in Complementary Transport Services
 Competition in Complementary Transport Services Derek John Clark a, Finn Jørgensen b and Terje Andreas Mathisen b * a Tromsø University Business School, University of Tromsø, NO 9037 Tromsø, Norway b Bodø
Game theory (Sections )
") Game theory (Sections 17.5-17.6) Game theory Game theory deals with systems of interacting agents where the outcome for an agent depends on the actions of all the other agents Applied in sociology, politics,
Game theory (Sections 17.5-17.6) Game theory Game theory deals with systems of interacting agents where the outcome for an agent depends on the actions of all the other agents Applied in sociology, politics,
Economics Bulletin, 2012, Vol. 32 No. 4 pp Introduction
 Economics ulletin, 0, Vol. 3 No. 4 pp. 899-907. Introduction Considerable research has been done to investigate whether selling different products in a bundle is anti-competitive and whether it generates
Cost of Delay and Endogenous Price Leadership
 Cost of Delay and Endogenous Price Leadership (IJIO #1613) by Ivan Pastine University College Dublin and CEPR and Tuvana Pastine NUI Maynooth and CEPR July 20, 2003 Abstract We study the effects of discounting
Market Structure & Imperfect Competition
 In the Name of God Sharif University of Technology Graduate School of Management and Economics Microeconomics (for MBA students) 44111 (1393-94 1 st term) - Group 2 Dr. S. Farshad Fatemi Market Structure
Contents in Brief. Preface
 Contents in Brief Preface Page v PART 1 INTRODUCTION 1 Chapter 1 Nature and Scope of Managerial Economics and Finance 3 Chapter 2 Equations, Graphs and Optimisation Techniques 21 Chapter 3 Demand, Supply
Journal of Industrial Organization Education. Third-Degree Price Discrimination
 An Article Submitted to Journal of Industrial Organization Education Manuscript 1030 Third-Degree Price Discrimination Qihong Liu Konstantinos Serfes University of Oklahoma, qliu@ou.edu Drexel University,
WRITTEN PRELIMINARY Ph.D. EXAMINATION. Department of Applied Economics. University of Minnesota. June 16, 2014 MANAGERIAL, FINANCIAL, MARKETING
 WRITTEN PRELIMINARY Ph.D. EXAMINATION Department of Applied Economics University of Minnesota June 16, 2014 MANAGERIAL, FINANCIAL, MARKETING AND PRODUCTION ECONOMICS FIELD Instructions: Write your code
TOPIC 4. ADVERSE SELECTION, SIGNALING, AND SCREENING
 TOPIC 4. ADVERSE SELECTION, SIGNALING, AND SCREENING In many economic situations, there exists asymmetric information between the di erent agents. Examples are abundant: A seller has better information
COST THEORY. I What costs matter? A Opportunity Costs
 COST THEORY Cost theory is related to production theory, they are often used together. However, here the question is how much to produce, as opposed to which inputs to use. That is, assume that we use
Networks, Network Externalities and Market Segmentation
 Networks, Network Externalities and Market Segmentation A. Banerji Delhi School of Economics, University of Delhi, Delhi 110007, India, (a.banerji@econdse.org) and Bhaskar Dutta Department of Economics,
Commerce 295 Midterm Answers
 Commerce 295 Midterm Answers October 27, 2010 PART I MULTIPLE CHOICE QUESTIONS Each question has one correct response. Please circle the letter in front of the correct response for each question. There
COORDINATING DEMAND FORECASTING AND OPERATIONAL DECISION-MAKING WITH ASYMMETRIC COSTS: THE TREND CASE
 COORDINATING DEMAND FORECASTING AND OPERATIONAL DECISION-MAKING WITH ASYMMETRIC COSTS: THE TREND CASE ABSTRACT Robert M. Saltzman, San Francisco State University This article presents two methods for coordinating
International Journal of Industrial Organization
 International Journal Int. J. Ind. of Industrial Organ. 28 Organization (2010) 350 354 28 (2010) 350 354 Contents lists available at ScienceDirect International Journal of Industrial Organization ournal
Chapter 13. Microeconomics. Monopolistic Competition: The Competitive Model in a More Realistic Setting
 Microeconomics Modified by: Yun Wang Florida International University Spring, 2018 1 Chapter 13 Monopolistic Competition: The Competitive Model in a More Realistic Setting Chapter Outline 13.1 Demand and
Industrial Organization
 Industrial Organization Markets and Strategies 2nd edition Paul Belleflamme Université CatholiquedeLouvain Martin Peitz University of Mannheim University Printing House, Cambridge CB2 8BS, United Kingdom
8. Oligopoly Some of this material can be found in Varian Chapter 15-16; see especially
 8. Oligopoly Some of this material can be found in Varian Chapter 15-16; see especially 16.5-16.10. I. Overview A. So far we have only looked at two extreme types of markets. 1. Competitive markets have
Social Norms for Team Work
 Social orms for Team Work Marc-Olivier Moisan-Plante February 7, 003 Introduction In his seminal 198 paper, Hölmstrom showed that there do not exist sharing rules among a partnership that yields the first-best
Oligopolies Part III
 Oligopolies Part III It's called an oligopoly. It's not a regular market. It's a market in which they control the prices and they've been doing it for years. Richard Miller The Prisoner s Dilemma Consider
ECON 2100 Principles of Microeconomics (Summer 2016) Monopoly
 Monopoly") ECON 21 Principles of Microeconomics (Summer 216) Monopoly Relevant readings from the textbook: Mankiw, Ch. 15 Monopoly Suggested problems from the textbook: Chapter 15 Questions for Review (Page 323):
ECON 21 Principles of Microeconomics (Summer 216) Monopoly Relevant readings from the textbook: Mankiw, Ch. 15 Monopoly Suggested problems from the textbook: Chapter 15 Questions for Review (Page 323):
ECON 230-D2-002 Version 2. MULTIPLE CHOICE. Choose the one alternative that best completes the statement or answers the question.
 ECON 230-D2-002 Version 2 Name MULTIPLE CHOICE. Choose the one alternative that best completes the statement or answers the question. 1) The two largest auto manufacturers, Toyota and GM, have experimented
MICROECONOMICS II - REVIEW QUESTIONS I
 MICROECONOMICS II - REVIEW QUESTIONS I. What is a production function? How does a long-run production function differ from a short-run production function? A production function represents how inputs are
Predictive Planning for Supply Chain Management
 Predictive Planning for Supply Chain Management David Pardoe and Peter Stone Department of Computer Sciences The University of Texas at Austin {dpardoe, pstone}@cs.utexas.edu Abstract Supply chains are
How Do Environmental and Natural Resource Economics Texts Deal With the Simple Model of the Intertemporal Allocation of a Nonrenewable Resource?
 How Do Environmental and Natural Resource Economics Texts Deal With the Simple Model of the Intertemporal Allocation of a Nonrenewable Resource? by Robert S. Main* Professor of Economics College of Business
Intra-industry trade, environmental policies and innovations: The Porter- Hypothesis revisited
 Intra-industry trade, environmental policies and innovations: The Porter- Hypothesis revisited Gerhard Clemenz March 2012 Abstract: According to the Porter Hypothesis (PH) stricter environmental regulations
Econ 001: Midterm 2 (Dr. Stein) Answer Key Nov 13, 2007
 Answer Key Nov 13, 2007") Instructions: Econ 001: Midterm 2 (Dr. Stein) Answer Key Nov 13, 2007 This is a 60-minute examination. Write all answers in the blue books provided. Show all work. Use diagrams where appropriate and label
Instructions: Econ 001: Midterm 2 (Dr. Stein) Answer Key Nov 13, 2007 This is a 60-minute examination. Write all answers in the blue books provided. Show all work. Use diagrams where appropriate and label
Section I (20 questions; 1 mark each)
") Foundation Course in Managerial Economics- Solution Set- 1 Final Examination Marks- 100 Section I (20 questions; 1 mark each) 1. Which of the following statements is not true? a. Societies face an important
Foundation Course in Managerial Economics- Solution Set- 1 Final Examination Marks- 100 Section I (20 questions; 1 mark each) 1. Which of the following statements is not true? a. Societies face an important
ECON 2100 (Summer 2009 Section 06) Final Exam. Multiple Choice Questions: (2 points each)
 Final Exam. Multiple Choice Questions: (2 points each)") ECON 2100 (Summer 2009 Section 06) Final Exam Multiple Choice Questions: (2 points each) 1. Price Elasticity of Demand is defined as A. the unique price at which Total Consumer Expenditures on a good are
ECON 2100 (Summer 2009 Section 06) Final Exam Multiple Choice Questions: (2 points each) 1. Price Elasticity of Demand is defined as A. the unique price at which Total Consumer Expenditures on a good are
Oligopoly Equilibria à la Stackelberg in Pure Exchange Economies 1
 Oligopoly Equilibria à la Stackelberg in Pure Exchange Economies 1 Ludovic A. Julien Fabrice Tricou * * 1 2 3 1 Introduction The concept of oligopoly competition introduced by Stackelberg (1934) has mainly
58.5% 17.3% 17.0% 7.1%
 CHAPTER 7 - INTERNATIONAL TRADE THEORY In the first chapter of the book, we examined the nature of the global economy. We saw that the nations of the world are becoming more economically interdependent.
Final Exam Study Questions:
 Final Exam Study Questions: Practice Multiple-Choice Questions 1. If a consumer purchases only two goods (X and Y ) and the demand for X is elastic, then a rise in the price of X a. will cause total spending
Price of anarchy in auctions & the smoothness framework. Faidra Monachou Algorithmic Game Theory 2016 CoReLab, NTUA
 Price of anarchy in auctions & the smoothness framework Faidra Monachou Algorithmic Game Theory 2016 CoReLab, NTUA Introduction: The price of anarchy in auctions COMPLETE INFORMATION GAMES Example: Chicken
Lecture 2: Market Structure I (Perfect Competition and Monopoly)
") Lecture 2: Market Structure I (Perfect Competition and Monopoly) EC 105. Industrial Organization Matt Shum HSS, California Institute of Technology October 1, 2012 EC 105. Industrial Organization ( Matt
Lecture 2: Market Structure I (Perfect Competition and Monopoly) EC 105. Industrial Organization Matt Shum HSS, California Institute of Technology October 1, 2012 EC 105. Industrial Organization ( Matt
Industrial. Organization. Markets and Strategies. 2nd edition. Paul Belleflamme Universite Catholique de Louvain. Martin Peitz University of Mannheim
 Industrial Organization Markets and Strategies 2nd edition Paul Belleflamme Universite Catholique de Louvain Martin Peitz University of Mannheim CAMBRIDGE UNIVERSITY PRESS Contents List offigures xiii
A nash equilibrium game and pareto efficient solution to a cooperative advertising
 IOSR Journal of Mathematics (IOSR-JM) e-issn: 78-578, p-issn: 319-765X. Volume 11, Issue 1 Ver. V (Jan - Feb. 015), PP 100-104 www.iosrjournals.org A Nash Equilibrium Game and Pareto Efficient Solution
Chapter 12. A Game Theoretic Approach to Strategic Behavior
 Chapter 12 A Game Theoretic Approach to Strategic Behavior Chapter Outline An Introduction to the Theory of Games Prisoner s Dilemma Nash Equilibrium Maximin Strategy Strategies for Repeated Play Sequential
AP Microeconomics Review Session #3 Key Terms & Concepts
 The Firm, Profit, and the Costs of Production 1. Explicit vs. implicit costs 2. Short-run vs. long-run decisions 3. Fixed inputs vs. variable inputs 4. Short-run production measures: be able to calculate/graph
Value Creation and Value Capture with Frictions
 Alliance Center for Global Research and Education Value Creation and Value Capture with Frictions Olivier CHATAIN Peter ZEMSKY 2011/49/ST/ACGRE (Revised version of 2009/35/ST/ACGRE) Value Creation and
CONTENTS. Introduction to the Series. 1 Introduction to Economics 5 2 Competitive Markets, Demand and Supply Elasticities 37
 CONTENTS Introduction to the Series iv 1 Introduction to Economics 5 2 Competitive Markets, Demand and Supply 17 3 Elasticities 37 4 Government Intervention in Markets 44 5 Market Failure 53 6 Costs of
Chapter Summary and Learning Objectives
 CHAPTER 11 Firms in Perfectly Competitive Markets Chapter Summary and Learning Objectives 11.1 Perfectly Competitive Markets (pages 369 371) Explain what a perfectly competitive market is and why a perfect
Assortative Matching > 0. (2)
") Assortative Matching In a marriage market the competition for spouse leads to sorting of mates by characteristics such as wealth, education, and other characteristics. Positive assortative matching refers
Assortative Matching In a marriage market the competition for spouse leads to sorting of mates by characteristics such as wealth, education, and other characteristics. Positive assortative matching refers
Strategic Ignorance in the Second-Price Auction
 Strategic Ignorance in the Second-Price Auction David McAdams September 23, 20 Abstract Suppose bidders may publicly choose not to learn their values prior to a second-price auction with costly bidding.