2017 Interim Results
|
|
|
- Sibyl Bell
- 6 years ago
- Views:
Transcription

1 Interim Results
2 Disclaimer This presentation incorporates information contained in the interim results announcement (the Results Announcement ) for the six months period ended 30 e of Li Ning Company Limited (the Company ). This presentation should be read in conjunction with the Results Announcement and is qualified in its entirety by the more detailed information and financial information contained in the Results Announcement. Other than the information contained in the Results Announcement, you shall not reproduce or distribute this presentation, in whole or in part, and you shall not disclose any of the contents of this presentation or use any information herein for any purpose without the Company s prior written consent. You hereby agree to the foregoing by accepting delivery of this presentation. The contents of this presentation have not been reviewed or approved by any regulatory authority in Hong Kong or elsewhere. The contents of this presentation are not investment, legal or tax advice. You are advised to exercise caution in perusing the contents of this presentation. If you are in any doubt about any of the contents of this presentation, you should obtain independent professional advice. 2
3 Agenda Results Highlights Financial Review Business Review Appendix 3


4 Results highlights
5 Highlights Financial Highlights : Reported net profit of RMB 189 million, margin raised from 3.2% to 4.7% Revenue up 11% to RMB 3,996 million Gross profit margin expanded 1 percentage point Enhanced operating leverage through disciplined cost management Negative impact of RMB 22 million from new business investment Operating cash flow (Excluded Double Happiness) increased over 90% to RMB 589 million Significant improvement in working capital continued Gross average working capital improved (down) by 14% while revenue increased by 11% Cash conversion cycle further improved (shortened) by 19 days (: 75 days / : 56 days) Operational Highlights: High-single digit growth for total platform retail sales, including online and offline channels Channel inventory turnover improvement continued Overall Same-Store-Sales in grew mid-single digit New product performance improved Sell-out rate up over 4 percentage points Discount rate improved 1 percentage point 5

6 Financial review 6

7 Revenue -RMB Million- Other Brands Growth, YoY growth YoY Group: 16% 11% LN Brand: 17% 12% LN Brand 4,419 3,902 3,596 3,996 3,187 3,127 3,845 3,553 4,372 3,966 * H2 * H2 *Excluded Double Happiness Growth continued led by Li Ning brand momentum 7
8 Revenue and Sell-Through Mix 100% Company Revenue Mix E-commerce Retail Wholesale Sell-Through Mix (Incl. Retail, Wholesale and E-commerce) Old Product 100% New Product (Current and Last Season) 52% 60% 51% 54% 47% 69% 69% 76% 75% 78% 41% 30% 36% 30% 34% 7% 10% 13% 16% 19% 31% 31% 24% 25% 22% H2 H2 H2 H2 Enhanced profitability driven by further balanced business model 8
9 Same Store Sales Growth (SSSG) Rate SSSG (: vs ) Overall Mid-Single Digit Retail Low-Single Digit Wholesale Low-Single Digit E-commerce* High-Sixties Overall Platform 0% Low-Single Digit Q3 High-Single Digit Q4 Retail Wholesale Negative Mid-Single Digit Q1 Flat Q2 0% High-Single Digit Q3 Mid-teens Q4 Flat Q1 High-Single Digit Q2 0% Low-Single Digit Q3 Low-Eighties Low-Single Digit Q4 Negative Mid-Single Digit Q1 E-commerce* Mid-Nineties Low-Fifties Low-Single Digit Q2 Mid-Nineties *E-commerce: LN brand sell-through generated from T-mall, JD and Lining.com 0% Q3 Q4 Q1 Q2 9
10 Online and Offline Expansion No. of POS (Period End) Sell-through growth, YoY % Offline Channel Online and Offline Channels 6,133 6,169 6,440 6,329 10% 12% 8% 8% 13% 7% 9% 9% 5,745 4% 4% Dec Dec H2 H2 Productive expansion continued to drive business growth 10
11 Wholesale Business^ 4,453 Business Performance Revenue (RMB million) 4,618 No. of POS (Period End) 4,829 4,785 4,671 8% 4%, YoY, YoY Trade Fair Order* (Tag Price) Growth, % YoY 2018 High-Single Digit 2,260 2,310 Mid-Single Digit 1,604 1,753 1,821 H2 H2 Q2 Q3 Q4 Q1 Q2 Q3 Q4 Q1 Controlled business growth led by precise trade fair order strategy ^ Wholesale business: Including sale of badminton and football categories products to specialty-store channel wholesaler *Order placed during trade fair (excl. orders from subsidiaries), e.g. 2018Q1 orders were placed about half year ago 11
12 Retail Business^ Business Performance Revenue Growth Analysis Revenue (RMB million) 1,292 1,515 1,498 No. of POS (Period End) 1,611 1,544 6%, 21%, YoY Growth Drivers +218 Productive Expansion Initiatives ,239 1,118 1,261 1,264 1,330 1, ,330 H2 H2 Same Store New Stores Closed Stores & Special Clearance Sales Revenue growth impacted by negative SSSG and non-productive store closure ^ Retail business: Refers to direct retail operation Excluded Blue label concept stores 12
13 GP Margin Analysis vs Reported GP Margin Channel Revenue Mix Wholesale New Product Mix Direct Retail New Product Discount Reported GP Margin +0.5p.p. +0.3p.p. +0.2p.p. 47.7% 46.7% Gross profit (GP) margin expansion driven by enhanced channel mix 13
14 Profitability Analysis vs -RMB Million- Reported Net Profit Bad Debt Provision Gross Profit Sales Related Variable Costs Platform Operation Costs Other income and Profits* Interest & Tax LN Brand Net Profit Loss form New Businesses Reported Net Profit Retail & EC Business Logistics & Others Advertising & Promotion Other Expenses Breakeven Margin expansion continued; Led by operating leverage of LN brand and partially offset by new business investments *Other income and profits include (i) miscellaneous income and gains, (ii) share profit from associate 14
15 Channel Inventory Inventory Level (Tag Price) Turnover Months (Store Inventory Only) Turnover Months (Store + Warehouse Inventory) % 6 months or less (New Product) 28% 24% 25% 22% 19% 23% 15% 7-12 months Over 12 Months 21% 14% 14% 49% 61% 54% 64% 67% Dec Dec Dec Dec Improvement in efficiency and inventory mix driven by controlled wholesale business initiatives 15
16 Company Inventory At cost, before provision (RMB Million) 1,227 1,129 1,205 1,109 1, % 6 months or less 7-12 months over 12 months 30% 28% 26% 26% 20% 13% 21% 17% 22% 18% 49% 55% 53% 56% 67% Dec Dec Dec Dec Further optimized inventory mix notwithstanding expansion in direct operated business (Incl. EC) 16
17 Trade Receivables At gross amount, before provision (RMB Million) 1,915 1,879 1,800 1,784 Improved by 20% 100% Below 90 days days over 180 days 19% 28% 25% 21% 25% 1,506 25% 27% 23% 18% 21% 47% 54% 52% 61% 54% Dec Dec Dec Dec Receivables volume significantly improved 17
18 Working Capital Efficiency -RMB Million- Inventory^ Trade Receivables^ Payables^ Working Capital # Working Capital # as % of Revenue* ,332 2,164 2,068 37% 28% 29% 1,968 1,778 22% 22% H2 Working capital efficiency further enhanced ^ Simple average between period opening and ending # Gross Amounts of inventory, trade receivables and payables, without netting off provisions * Annualized revenue H2 18
19 Balance sheet summary and cash position -RMB Million- 1,754 2,163 Net Cash Position^ 993 1,247 1,335 Dec Dec -For the Six Months Period- Cash Conversion Cycle (Days) Operating Cash Flow ^Net Cash / (Debt) = Cash and Cash Equivalents Borrowings 19

20 Business Review 20


21 Foster the LI-LING Brand Value Through Experience, Embrace The Opportunities In Sports Market National Policies in favor of industry development - Implement policies that promote the development of sports industry, including < No.46 Guidance issued by the State Council>, < National Fitness Program> - Regular sports participant are estimated to increase from approx. 400 million in to 500 million in Sports Experience Sports industry trend in China - The sales of sporting goods in China are estimated to increase from RMB190 billion in to RMB270 billion in The number of participants in marathon or related races have reached 2.8 million in and is estimated to reach 10 million in Product Experience Demand for smart products - The demand for sports electronics equipment was driven by the increasing popularity of personal sports data analysis. - Runners tend to use social media platform to conveniently share their sports records, in order to seek recognition. Shopping Experience LI-NING Brand Value Through Experience Experience through interacting with sports participants, design the products to meet their needs and provide flexible experience according to the differentiated consumption habits. Source:State Council of the People's Republic of China, Athletic Association of the People's Republic of China, Euromonitor 21


22 Enhance Experience Value based on the foundation of Three-Pillar Strategy and Digitization Establish all-rounded experience value through product, channel and retail capability Strengthen brand value through digitization Classify stores by categories with own profitability model, to match product planning and assortment Optimize channels to enhance retail sales efficiency, by closing down low productivity and loss-making stores Digitization + Experience Value Product Upgrade store image and implement standard operating procedure Reinforce the training for frontline sales and building sports advisors team Strengthen membership platform through omni-channel digital marketing Enhance sports functionality adhered, integrate trendy elements into design Differentiated product assortment and management 22


23 Product: Five Core Categories* Drove Business Growth Retail Sell-through YoY Change Retail Sell-through Mix Total Value 9% Running 26% Training 15% Basketball 5% Sports Causal 2% Non-core 21% Sell-in YoY change 16% Non-core Sports Casual 22% 10% Basketball 23% Running 29% Training Badminton* 6% *The Five Core Product Categories include running, training, basketball, sports casual and badminton Sales of badminton products are shown with sell-in data for reference as they are mainly distributed via professional channels 23


24 For Practical Training Functionality Supreme Functions Running Product: Diversified running footwear portfolio High Air Arc Running Shoes Classic Arc Running Shoes Super Light 14 th Running Shoes Launched in 17Q1 Tag price: RMB499 6 months sell-out rate: 62% 6 months sales volume: Approx. 370,000pairs Launched in 17Q1 Tag price: RMB399 6 months sell-out rate: 71% 6 months sales volume: Over 400,000 pairs Launched in 17Q2 Tag price: RMB479 3 months sell-out rate: 56% 3 months sales volume: Over 560,000 pairs Cushion Running shoe Light weight V1 Running shoe Launched in 17Q1 Tag price: RMB369 6 months sell-out rate: 74% 6 months sales volume: Approx. 230,000 pairs Speed Star Running Shoes Launched in 17Q1 Tag price: RMB299 6 months sell-out rate: 74% 6 months sales volume: Approx. 120,000pairs Light weight V2 Running shoe Launched in 17Q2 Tag price: RMB369 3 months sell-out rate: 55% 3 months sales volume: Over 220,000 pairs Launched in 17Q2 Tag price: RMB299 3 months sell-out rate: 54% 3 months sales volume: Over150,000 pairs Casual 24


25 Basketball Product: Combination of Function and Fashion Basketball Court Shoes WADE series BAD FIVE apparel series Li-Ning shock-absorption technology Trendy and stylish sports casual Focus on street basketball fashion applied to the midsole Casual and all-match, simple but fashion Playful design,simple but fashionable Design Focus Carbon-fiber plate provides support to midfoot and prevents sprains Provide choices of diversified all season products Trendy and stylish, sporty and energetic Special knit structure, practical and goodlooking CBA designated Sonic V basketball shoes Key Product Launched in 17Q2 Tag price:rmb 599 Sales Performance 3 months sell-out rate: 46% 3 months sales volume: Over 40,000 pairs 6 months sell-out rate: 76% 6 months sales volume: Over 570,000 units 6 months sell-out rate: 65% 6 months sales volume: Over 630,000 units 25


26 Training Product: Technological elements boost performance Training Footwear Training Apparel Design Focus Breathable one-piece knit EVA light sole provides flexibility Reinforced support provides good protection Elastic big sole enhances flexibility Keep warm:far-infrared WARM AT FAR INFRARED Quick-dry:AT DRY/ AT DRY FREEZE Protection:AT PROOF WIND/ AT-BACTERIA Super Trainer One-piece knit trainers One-piece knit trainers Key Product Launched in 17Q1 Tag Price:RMB 369 Launched in 17Q1 Tag Price:RMB 439 Sales Performance 6 months sell-out rate: 74% 6 months sales volume: over 200,000 pairs 6 months sell-out rate: 78% 6 months sales volume: approx. 40,000 pairs 6 months sell-out rate: 73% 6 months sales volume: over 2,000,000 units 26


27 Sports Causal Products: Uniqueness by Colors and Texture Hero Products Full palm cushion protection; Neat and clean shoe body design, simple but Single-piece knitting vamp that allows feet to Design Focus upgraded Tech+ experience Multi-color mix & match, break unique Lightweight thickened IP midsole, providing a breathe Bubble UP half palm air cushion + EVA midsole, up the boredom comfortable wearing experience giving a comfortable wearing experience Bubble Face full palm air cushion casual shoes Heather Classic Casual Shoes Bubble UP Knit half palm air cushion casual shoes Key Product Launched in 17Q1 Tag Price:RMB 439 Launched in 17Q2 Tag Price:RMB 299 Launched in 17Q2 Tag Price:RMB 399 Sales Performance 6 months sell-out rate: 75% 6 months sales volume: over 220,000 pairs 3 months sell-out rate: 62% 3 months sales volume: approx. 130,000 pairs 3 months sell-out rate: 56% 3 months sales volume: over 230,000 pairs 27


28 Channel: Capitalized on trends, diversified online experience Major Marketing Events February T-mall Super Members Day Season 1 February T-mall opens 7-24 during CNY February 4 月美国队长上线 March Super Light 14 th launch event March April 8 th March Queens Day April 10 th anniversary of T-mall flagship store May e live streaming the 10K Run at Xi An Station e 5 月 Rouge Rabbit Launched T-mall Flagship Store 618 T-mall mid-year sale 621 Fan base exceeded 5 million e Li-Ning YOUNG launched officially 28


29 Channel: Digitalization enhanced efficiency and experience Forecast system based on data analysis Strengthen We Media culture for online stores More accurate product planning and sales forecast Coordinate and integrate forecast with supply chain to improve operating efficiency Increase customer loyalty through enhancing user experience Continuously increase O2O interaction to seek for business opportunities Precision Marketing Trendy Crowd Professional Crowd Live Streaming Increase view conversion rate to over 12.8% Content marketing + interaction User interaction, increase customer loyalty, establish the characteristics of We Media Promotion for pre-launch; Online viewers reached 240,000 More than 530,000 views since the night walker video has been uploaded for two days 29


30 Channel: Well-defined categories stores focused on high store productivity Sales Review Product Planning Full- Categories Store Category Theme Store Running Basketball Sports Casual Product Development Enhance consumer s experience Optimize and Innovate Stores VI/VM Strengthen product and retail operation 1 Revamp 2 Open Expand stores with high productivity in key market Open large influential stores in key markets Categories Store Assortment 3 Close Close low productivity and loss-making stores 30


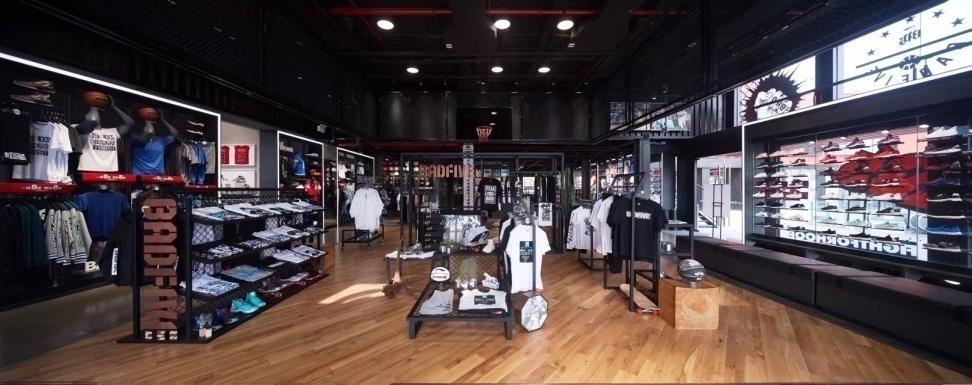
31 Channel: Well-defined category stores Full-Categories Store Shanghai River Mall experience store 31


32 Channel: Well-defined category stores Category focus store Basketball-focused store Beijing Wukesong Hua Xi HI-UP store Category focus store Sports casual store Beijing Wangfujing Danyao store 32

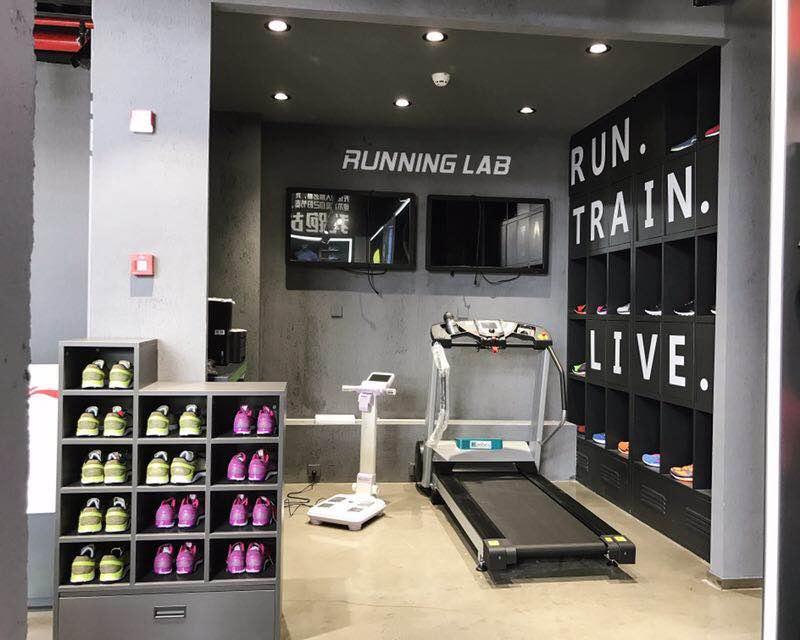
33 Channel: Focus on larger stores with high store productivity Xi an Xiaozhai Saige experience store Dalian New Mart Shopping Plaza experience store Conghua Chang Chao experience store Located in the core business district in the most important city in Northwest China Area:Approx. 400 square meters Core business district in Dalian The first experience store in China s department store Area:Approx. 400 square meters The first large scale experience store in third-tier city in Southern China Area:Approx. 500 square meters 33


34 Retail Capability: Optimizing Retail Operation Platform Refined and upgraded store management system Enhanced evaluation system Enhance training system in a step-ladder approach Equipped the frontline sales with ability of recommending adjustment for the rhythm of product sales according to regional weather, consumer habits etc. Operating benchmark Training system Identify store image by categories Optimized the design process Store image Retail Operation Platform Omnichannel Operation Initially established O2O all-in-one inventory system Implemented direct to store delivery Store display Marketing and promotion Product display according to the store images and locations Promotion based on area with different seasons Marketing in new media and multi-channels Professional sports advisor stationed at the stores Membership experience and interaction 34


 Product Sales Mix")


35 Retail Capability: Strengthened The Retail Operation Closed Loop (Data reflected the situation in the first half of and YoY change Offline Channel Sales Performance Sell-through: mid single-digit growth Sales Volume: low single-digit growth News Product Performance Contribution to total sales: up 2 p.p. Sell-through: increase by approximately 9% 2) Product Development New Product Sell-out Rate Q1 products: up 4 p.p. in 6 months Q2 products: up 5 p.p. in 3 months 3) Product Sales Mix 1) Product Planning 4) In-Store Retail Retail Operation Closed Loop 6) Cash Recovery 5) Stock Clearance Offline Channel Sales Efficiency SSSG: low single-digit decline Retail Discount: increased 0.7 p.p. Over 12 months inventory mix Channel: declined (improved) 6 p.p. Company: declined (improved) 6 p.p. Operating Cash Flow Cashflow from operating activities: RMB589 million net inflow Net Cash: increased by RMB828 million Trade receivables before provisions: Amount decreased (Improved) by 20% Cash conversion cycle: decreased(improved) by 19 days 35
36 New Business Progress The brand positioned itself as a brand of female sports presented in a fashionable manner; Product lines include Dansfit (sports products with fashionable and modern designs), Danslife (the pure fashion series), Danslux (the high-end fashion series) and Dance (the ballet series) Partnered with experienced suppliers in the first half of To promote its brand value with marketing activities focused on digital channels Planned to open 3 to 5 stores in the fourth quarter of The expected negative impact on net profit is approximately RMB35 million for Opened approximately 20 stores in the first half, most of them located in the northern part of China, planned to net addition for 70 store in second half. The current distributors from the 3 rd party licensee will be taken over on Jan 1, 2018 Channel development based on market demand, LN YOUNG stores cover the market of age 3-14; LN KIDS stores focus on the market of 3-6. Developed retail business operation model based on products and store profitability The trade fair of LI-NING YOUNG for the first quarter of 2018 was held, with improvement in product design, style and materials The expected negative impact on net profit is approximately RMB30 million for Continued to improve and optimize products according to brand positioning in the first half of Channel expansion has been focused on established shopping malls, consistent to our strategy As of 30 e, 8 stores were opened in cities including Beijing, Shanghai, Hefei, Dalian, Qingdao and Nanjing. The expected negative impact on net profit is approximately RMB25 million for 36


37 Open Forum 37
38 Summary of Income Statement (RMB million) Period ended 30 e Better/(Worse) Revenue 3,996 3,596 11% Gross Profit 1,904 1,678 14% Distribution costs -1,502-1,355 (11%) Administrative expenses (8%) Other income and other gains net (39%) Operating Profit % EBITDA % Profit Attributable to Equity Holders % Basic Earnings per share(rmb cents) % * Adjusted for the contribution form Double Happiness in (Recorded as discontinued operations in, and share of profit using equity method in ) for comparison 38
39 Profit Margins And Expense Ratios Better/(Worse) Period ended 30 e Gross Profit Margin 47.7% 46.7% 1.0p.p. Operating Profit Margin 5.0% 4.2% 0.8p.p. EBITDA Margin* 10.4% 9.8% 0.6p.p. Margin of Profit Attributable to Equity Holders 4.7% 3.2% 1.5p.p. R&D Expenses(as % of revenue) 1.4% 1.6% 0.2p.p. A&P Expenses(as % of revenue) 11.3% 12.1% 0.8p.p. Staff Costs(as % of revenue) 10.7% 9.8% (0.9p.p.) * Adjusted for the contribution form Double Happiness in (Recorded as discontinued operations in, and share of profit using equity method in ) for comparison 39
40 Key Operational Indicators Better/(Worse) Period ended 30 e Average Inventory Turnover(Days) Average Trade Receivables Turnover(Days) Average Trade Payables Turnover(Days) (6) Cash Conversion Cycle(Days) Return on Equity(ROE) 4.3% 3.5% 0.8p.p. Return on Asset(ROA) 2.8% 1.7% 1.1p.p. CAPEX(RMB million) % 40
41 Summary of Balance Sheet (RMB Million) Dec Better/(Worse) Cash and Cash Equivalents 2,365 1,954 21% Borrowings (1%) Convertible Bonds Liabilities N.A Net Cash* 2,163 1,754 23% Current Liabilities 2,072 2,674 23% Current Ratio(times) x Total Liabilities to Total Assets Ratio 31.4% 41.0% 9.6p.p. *Net Cash = Cash and Cash Equivalents Borrowings 41
2012 INTERIM RESULTS. August 2012
 2012 INTERIM RESULTS August 2012 AGENDA Financial Highlights Business Review Operational Review & Future Strategies Open Forum FINANCIAL HIGHLIGHTS SUMMARY OF INCOME STATEMENT (RMB million) 1H2012 1H2011
FILA s Positioning. Blue. White Red. Originale. High Price. Mid-to-high Price. The 45-year-old. The 20-year-old. Mission
 FILA s Positioning Mission Bring out the elegance in life through sports High Price Blue Fulfill an unmet demand for sports fashion from the middle class White Red Expand target age group to 20-45 through
For immediate release
 For immediate release ANTA Sports Announces 2012 Annual Results Committed to Achieving Sustainability in the Long Run *** Striving Towards Brand Development, Distribution Channel Optimisation and Product
Annual Results Announcement. 27 March 2012
 2011 Annual Results Announcement 27 March 2012 Disclaimer Cautionary note regarding forward looking statements This presentation material contains certain forward looking statements with respect to the
361 Degrees International Limited (Stock code: 1361:HK) 2015 Annual Results March 2016
 2015 Annual Results March 2016") 361 Degrees International Limited (Stock code: 1361:HK) 2015 Annual Results March 2016 Disclaimer These presentation slides have been prepared by 361 Degrees International Limited (the Company ) solely
361 Degrees International Limited (Stock code: 1361:HK) 2015 Annual Results March 2016 Disclaimer These presentation slides have been prepared by 361 Degrees International Limited (the Company ) solely
IT S MY LIFE STYLE. MC GROUP Public Company Limited Results Summary. 1 March 2017
 IT S MY LIFE STYLE MC GROUP Public Company Limited 2016 Results Summary 1 March 2017 IT S MY LIFE STYLE MC GROUP Public Company Limited 2016 Results Summary 1 March 2017 CONFIDENTIAL Disclaimer The information
INVESTOR MEETING / MARCH 9, 2010
 INVESTOR MEETING / MARCH 9, 2010 1 Disclosure Regarding Forward-Looking Statements This presentation contains forward-looking statements within the meaning of the federal securities laws. All statements,
Evolution of Sales and Distribution Channel
 Evolution of Sales and Distribution Channel Traditional Dept. Store New-age mall Online Market place 1 Commissary Market Place Supermarket Channel Functions Marketing Research Communications Contact Matching/Customizing
August 2017 ANALYST & INVESTOR PRESENTATION H1 2017
 August 2017 ANALYST & INVESTOR PRESENTATION H1 2017 H1 2017 AT A GLANCE With RESET almost concluded successfully, TOM TAILOR GROUP undergoes the most comprehensive restructuring program in the company
Interim Results FY17/18 For the 6 months ended 30 September November 2017
 Interim Results FY17/18 For the 6 months ended 30 September 2017 23 November 2017 Agenda Group s Financial Performance Business Review by Market Outlook And The Way Forward 1 Group s Financial Performance
For personal use only
 For personal use only FIRST HALF RESULTS AND GUIDANCE UPDATE 31 Dec 2015 25/2/16 Brian Shanahan CEO and Co-Founder Deborah Kelly Group CFO Summary: Proforma First Half Results FY16 Temple & Webster is
COMPANY RESEARCH AND ANALYSIS REPORT
 8119 TSE JASDAQ Analyst Hideo Kakuta Index Summary----------------------------------------------------------------------------------------------------------------------------------------------------------------------------
01.2 CORPORATE STRATEGY
 PAGE 10 ZALANDO IS EUROPE S LEADING ONLINE FASHION PLATFORM FOR WOMEN, MEN AND CHILDREN. WE PROVIDE OUR CUSTOMERS WITH A CONVENIENT ONE-STOP SHOPPING EXPERIENCE, OFFERING AN EXTENSIVE SELECTION OF FASHION
Lovable Lingerie Ltd. - IPO Note
 Lovable Lingerie Ltd. - IPO Note Issue Details Issue Date March 08, 2011 March 11, 2011 Issue Size Rs.887-933mn Price Band Rs.195-205 FV Rs.10 Fresh Issue 4.55 mn equity shares QIB 50 % Non Institutional/HNIs
REDACTED REDACTED REDACTED REDACTED REDACTED REDACTED OVERVIEW
 This summary aims to give you an overview of the information contained in this [REDACTED]. Since it is a summary, it does not contain all the information that may be important to you. You should read the
ADLER Modemärkte Equity Story
 ADLER Modemärkte Equity Story November 2017 1 Investment Summary: ADLER Modemärkte is well positioned to face short-term challenges and lift mid- to long-term potentials Growing target group Assets Very
2015 INTERIM RESULTS. 21 AUGUST, 2015 CHINA UNICOM (HONG KONG) LIMITED
 LIMITED") 2015 INTERIM RESULTS 21 AUGUST, 2015 CHINA UNICOM (HONG KONG) LIMITED www.chinaunicom.com.hk 254758-006 1 Management Present Mr. Lu Yimin Executive Director & President Mr. Li Fushen Executive Director
2015 INTERIM RESULTS 21 AUGUST, 2015 CHINA UNICOM (HONG KONG) LIMITED www.chinaunicom.com.hk 254758-006 1 Management Present Mr. Lu Yimin Executive Director & President Mr. Li Fushen Executive Director
Analyst Presentation. First Quarter 2013 ADLER
 Analyst Presentation First Quarter 2013 1 2 Highlights Steilmann Group 3 Financials 4 Outlook 2013 2 Highlights Q1 2013 Revenue and Profitability Revenue of 104.4 mio. Gross profit margin increase of 2.9
Christine Skold. Vice President, Investor Relations and Corporate Communications
 Christine Skold Vice President, Investor Relations and Corporate Communications 2 Safe Harbor Statement The Company claims the protection of the safe-harbor for forward-looking statements contained in
2016/17 Interim Results Announcement
 2016/17 Interim Results Announcement Analyst Meeting Nov 17, 2016 Key Financial Highlights - 2016/17 (US$m) 2015/16 2016/17 Change Revenue 1,604 1,844 15.0% Total Margin 547 655 19.9% % of Revenue 34.1%
WESCO International. Dave Schulz, Senior Vice President and Chief Financial Officer Raymond James 39 th Annual Investors Conference, March 7, 2018
 WESCO International Dave Schulz, Senior Vice President and Chief Financial Officer 2 Safe Harbor Statement All statements made herein that are not historical facts should be considered as forward-looking
H&M group capital markets day Stockholm 2018 H&M GROUP CAPITAL MARKETS DAY 2018
 H&M group capital markets day Stockholm 2018 Disclaimer THIS PRESENTATION IS NOT AN OFFER OR SOLICITATION OF AN OFFER TO BUY OR SELL SECURITIES. IT IS SOLELY FOR USE AT A CAPITAL MARKETS EVENT AND IS PROVIDED
For personal use only MOBILE EMBRACE ASX: MBE. FY 2016 Results. Chris Thorpe, CEO REACH ENGAGE TRANSACT EMBRACE 1
 MOBILE EMBRACE ASX: MBE FY 2016 Results Chris Thorpe, CEO 1 TABLE OF CONTENTS 2016 FY RESULTS 1. PROVEN, PROFITABLE, GROWING: 2016 FY RESULTS 2. WHO WE ARE p 5-13 p 14-23 3. SET UP FOR SUCCESS p 24-28
Logitech Q1 Fiscal Year 2015 Preliminary Financial Results Management s Prepared Remarks (July 23, 2014)
") Logitech is posting a copy of these prepared remarks, its press release and accompanying slides to its investor website. These prepared remarks will not be read on the call. We refer both to GAAP and to
Logitech is posting a copy of these prepared remarks, its press release and accompanying slides to its investor website. These prepared remarks will not be read on the call. We refer both to GAAP and to
LA-Z-BOY INCORPORATED
 LA-Z-BOY INCORPORATED November 2017 Providing comfort to America for 90 years FORWARD-LOOKING DISCLAIMER This presentation contains forward-looking statements that involve uncertainties and risks as detailed
Panalpina a leading global Supply Chain Management company
 Geneva, 22 nd September 2009 Panalpina a leading global Supply Chain Management company 22 nd September 2009 2 Panalpina at a glance Comprehensive global network Worldwide no. 3 in Air freight, no. 4 in
Avery Dennison Investor Presentation August 2014
 Avery Dennison Investor Presentation August 2014 Unless otherwise indicated, the discussion of the company s results is focused on its continuing operations, and comparisons are to the same period in the
Matahari Putra Prima Company Focus
 January 26, 2015 Matahari Putra Prima Company Focus More Challenging Expansion Changes to estimates We lowered our 2015E/2016E core EPS by 4.5/-13.0% due to lower expected number of new stores. Our new
2012 Results Announcement
 Results Announcement I. Overview Wide Social Recognition with Repeated Industry Awards Ranked No. 2 in the Global 225 Largest Contractors by Engineering News Record in Made into the Fortune 500 list for
China Strategy. HUGO BOSS Investor Day Mr. Gareth Incledon, Managing Director China Hong Kong, November 26, 2013
 HUGO BOSS Investor Day 2013 China Strategy Mr. Gareth Incledon, Managing Director China Hong Kong, November 26, 2013 Investor Day 2013 // China Strategy HUGO BOSS November 26, 2013 2 / 34 Agenda HUGO BOSS
Oppenheimer Conference TSA (NYSE)
") Oppenheimer Conference TSA (NYSE) September 3, 2005 Note: As of /29/05; excludes name changes due to rebranding Merger Completed August 2003 95 Stores 97 Stores 0 2 3 8 6 2 4 20 48 25 2 4 5 2 30 2 3 2
Oppenheimer Conference TSA (NYSE) September 3, 2005 Note: As of /29/05; excludes name changes due to rebranding Merger Completed August 2003 95 Stores 97 Stores 0 2 3 8 6 2 4 20 48 25 2 4 5 2 30 2 3 2
Investor Meeting Presentation
 Investor Meeting Presentation Dennis Weber, Head of Investor Relations German Senior Investor Day Munich UBS November 30, 2016 HUGO BOSS has been impacted by some profound changes in the industry Premium
Investor Meeting Presentation
 Investor Meeting Presentation Mark Langer, CEO Frank Böhme, Investor Relations Manager Premium Review Conference Paris Société Générale December 01, 2016 HUGO BOSS has been impacted by some profound changes
OUTLETS. Making the Case for Outlets. Outlet stores, for both consumers and retailers, are a win-win.
 OUTLETS Making the Case for Outlets Outlet stores, for both consumers and retailers, are a win-win. For consumers, they offer a place to buy their favorite brands at a steep discount, oftentimes as much
KBC Securities London. December 2013
 KBC Securities London December 2013 Disclaimer This presentation is not an offer or solicitation of an offer to buy or sell securities. It is furnished to you solely for your information and use at this
Tractor Supply Company. Third Quarter 2015
 Tractor Supply Company Third Quarter 2015 Safe Harbor Statement The Company claims the protection of the safe-harbor for forward-looking statements contained in the Private Securities Litigation Reform
Finance 301 Sec. 101 Spring 2016 Group 8
 Finance 301 Sec. 101 Spring 2016 Group 8 Kaitlyn O'Connell Karan Patel Abel Pious Anton Pokhodenko Introduction: Blue Ribbon Sports is an American multinational company, founded in 1964, is now the brand
1.1 Supply Chain Management & Strategic Planning. Supply Chain Evolution The Supercheap Auto Group Story
 1.1 Supply Chain Management & Strategic Planning Supply Chain Evolution The Supercheap Auto Group Story Peter Birtles Managing Director Supercheap Auto Group Carter McNabb Partner GRA Pty Ltd Agenda Group
Fundamentals of Retail E-learning Suite
 Fundamentals of Retail E-learning Suite Background RST66 Whether sales, marketing, consulting, development or implementation, the vendors whose people know their customer s industry achieve better results
2015 Annual Results. Innovation Integration Growth
 2015 Annual Results Innovation Integration Growth March 2016 Disclaimer This presentation and the accompanying slides (the Presentation ) have been prepared by WH Group Limited ("WH Group " or the "Company")
Solid start into the year
 Deutsche Post DHL Group results Q 203 Solid start into the year Larry Rosen, CFO Bonn, 4 May 203 Q 203 Highlights (/2) Delivering solid results in still challenging macro-environment EBIT increase reflects
Together with Kobe in Los Angeles, we introduced the KOBE 9 Elite, extending the benefits of our NIKE Flyknit technology to Basketball; JULY 25, 2014
 JULY 25, 2014 TO OUR SHAREHOLDERS, NIKE s success is grounded in our ability to stay true to our mission. By bringing inspiration and innovation to every athlete, NIKE has grown from selling running shoes
China Mengniu Dairy Company Limited 2014 Interim Results. Stock Code: 2319 August 2014
 China Mengniu Dairy Company Limited 2014 Interim Results Stock Code: 2319 August 2014 Disclaimer The presentation is prepared by China Mengniu Dairy Company Limited (the Company ) and is solely for the
FORWARD LOOKING STATEMENTS
 INVESTOR PRESENTATION AUGUST 2017 FORWARD LOOKING STATEMENTS Some information provided in this document will be forward-looking, and accordingly, is subject to the Safe Harbor provisions of the federal
Q Financial Results
 Q1 2017 Financial Results Safe Harbor The information presented herein may contain forward-looking statements. Such forward-looking statements include all statements other than statements of historical
Trends. Supporting Retailers & Consumers throughout the Shopping Journey
 Retail Industry Trends Retail performance Hong Kong s retail sales is contributed by the inbound tourism and mainland China s economy as well as the continued development of other Asian economies. Dynamic
Replenishment and Price Optimization at OTTO. How OTTO increases sales while rising to the challenge of growing customer expectations
 Replenishment and Price Optimization at OTTO How OTTO increases sales while rising to the challenge of growing customer expectations 02 How OTTO Improved the Customer Experience by Using Machine Learning
Third quarter and first nine months 2017 Results Release. October 19 th, 2017
 Third quarter and first nine months 2017 Results Release October 19 th, 2017 Safe harbor statement Any statements contained in this document that are not historical facts are forward-looking statements
SENETAS 2017 INTERIM RESULTS. 27 February 2017
 SENETAS 2017 INTERIM RESULTS 27 February 2017 AGENDA 1. HY17 HIGHLIGHTS 2. KEY FINANCIALS 3. OPERATIONAL REVIEW 4. OUTLOOK HY17 HIGHLIGHTS HY17 highlights Operating revenue up 8% Profit before tax down
UBS Media Conference Neil Berkett, Acting CEO 5 December 2007
 UBS Media Conference Neil Berkett, Acting CEO 5 December 2007 Forward-looking statements Safe Harbor Statement under the Private Securities Litigation Reform Act of 1995: Various statements contained in
Ross Stores, Inc. Investor Overview November 2017
 Ross Stores, Inc. Investor Overview Disclosure of Risk Factors Forward-Looking Statements: This presentation contains forward-looking statements regarding expected sales, earnings levels, and other financial
Investor Presentation Incl. Nine Month and Q Figures
 Investor Presentation Incl. Nine Month and Q3 2012 Figures 1 Strategy 2 Highlights 3 Financials 4 Outlook 2 Strategy ADLER: Unique Retail Concept, Harvesting Demographic Change Leading German fashion retailer
Implementation Challenges of Omni-channel Retailing. Derek Ng Oct 2015
 Implementation Challenges of Omni-channel Retailing Derek Ng Oct 2015 2 IMPORTANT This document (including any attachment) has been developed by PRICERITE GROUP LIMITED (PRICREITE) and is the confidential
Consolidated Financial Results
 Consolidated Financial Results for the Nine Months Ended September 30, 2017 Kao Corporation October 30, 2017 These presentation materials are available on our website in PDF format: http://www.kao.com/global/en/investor
Recommended acquisition of The BSS Group plc. 5 July 2010
 Recommended acquisition of The BSS Group plc 5 July 2010 Important information This document is being made available only to persons who fall within the exemptions contained in Article 19 and Article 49
HGL Limited. For personal use only. Annual General Meeting 16 February Computershare Offices 60 Carrington Street, Sydney
 HGL Limited Annual General Meeting 16 February 2017 Computershare Offices 60 Carrington Street, Sydney CEO Presentation Henrik Thorup 16 February 2017 AGENDA CORPORATE HIGHLIGHTS GPS STRATEGY PLAN FY16
Wholesale Distribution Economic Trends: Headwinds Slow Revenue Growth. in partnership with:
 2016 Wholesale Distribution Economic Trends: Headwinds Slow Revenue Growth from: in partnership with: Total revenues of wholesale distributors in 2015 fell by 4.3 percent to $5.3 trillion, reflecting a
Footwear. SAP Business One. Apparel & Footwear
 Footwear SAP Business One Apparel & Footwear Introduction SAP Business One for the Footwear Industry. Integrate and automate critical business processes with Apparel & Footwear for SAP Business One Due
China Nepstar Chain Drugstore Ltd.
 China Nepstar Chain Drugstore Ltd. NYSE:NPD Presentation to Investors November 2012 HK000NM6_Eng Safe Harbor This presentation contains forward-looking statements. These statements constitute forward-looking
Overview Strategic Highlights Business Review Financials Q&A
 1 Cautionary note This presentation may contain forward-looking statements relating to the forecasts, targets, outlook, estimates of financial performance, opportunities, challenges, business developments,
HAMBURGER HAFEN UND LOGISTIK AG COMPANY PRESENTATION
 HAMBURGER HAFEN UND LOGISTIK AG COMPANY PRESENTATION UNICREDIT GERMAN INVESTMENT CONFERENCE MUNICH, SEPTEMBER 2010 Hamburger Hafen und Logistik AG DISCLAIMER The facts and information contained herein
Content-aware Network Services
 Content-aware Network Services Investor Presentation (NASDAQ: CCIH) ChinaCache International Holdings Ltd. Disclaimer This presentation has been prepared by ChinaCache International Holdings Ltd. (the
Unilever Investor Event 2017 Graeme Pitkethly 29 th November 2017
 Unilever Investor Event 2017 Graeme Pitkethly 29 th November 2017 What you have heard so far Driving growth in each Category Fuelling growth and margin expansion Personal Care Home Care Foods & Refreshment
1H 2014 Results. July 31, Investor Relations
 1H 2014 Results July 31, 2014 Disclaimer This presentation contains statements that constitute forward-looking statements based on Il Sole 24 ORE S.p.A. s current expectations and projections about future
IDEX ASA. DNB SME Conference, April 2017 IDEX.NO
 IDEX ASA DNB SME Conference, April 2017 IDEX.NO DISCLAIMER This presentation includes and is based, inter alia, on forward-looking information and statements that are subject to risks and uncertainties
Organic revenue growth in H1 2018
 2 Preliminary results 2017 Continued delivery against strategy geographic expansion, product innovation and partnership development Completed Comapi acquisition - facilitating shift to omnichannel offering
YAVAPAI COLLEGE/PRESCOTT UNIFIED SCHOOL DISTRICT District Instructional Guide (DIG) Year-Long Semester Pacing Guide 2015/2016 School Year
 Year-Long Semester Pacing Guide 2015/2016 School Year") YAVAPAI COLLEGE/PRESCOTT UNIFIED SCHOOL DISTRICT District Instructional Guide (DIG) Year-Long Semester Pacing Guide 2015/2016 School Year School: Prescott High dual enrolled with Yavapai College Grade
YAVAPAI COLLEGE/PRESCOTT UNIFIED SCHOOL DISTRICT District Instructional Guide (DIG) Year-Long Semester Pacing Guide 2015/2016 School Year School: Prescott High dual enrolled with Yavapai College Grade
Summary of Business Results for the Fiscal Year ended March 31, 2014
 7483 TSE 1st Section DOSHISHA CORPORATION Summary of Business Results for the Fiscal Year ended March 31, 2014 DOSHISHA CORPORATION (hereinafter DOSHISHA or the Company) conducted its FY3/14 analyst briefing
Sonae SR - The Way to Success
 University of Muenster School of Business and Economics Title Sonae SR - The Way to Success Presenting to Francesco Pimente and Teresa Castro Project team Pascal Lange Christoph Kirchner Marie-Sophie Kilian
Ch. 1 and 2 Test Review, S. E. Marketing
 Ch. 1 and 2 Test Review, S. E. Marketing True/False Indicate whether the sentence or statement is true or false. 1. Marketing is an important business function that involves all individuals. 2. UPS is
Paddy Power Betfair plc Prelim Results
 Paddy Power Betfair plc 2017 Prelim Results Overview 2 Observations Solid financial performance in 2017 Many important competitive advantages Merger integration successfully completed Sportsbet has an
MAKING M&S SPECIAL HALF YEAR RESULTS 8 NOVEMBER 2017
 MAKING M&S SPECIAL HALF YEAR RESULTS 8 NOVEMBER 2017 FINANCIAL HEADLINES Group Revenue 5.1bn +2.6% Profit before tax 118.3m +371.3% Profit before tax & adjusted items 219.1m -5.3% Free cash flow before
For personal use only
 SmartTrans Holdings Limited (ASX:SMA) Annual General Meeting 2016 24 November 2016 Integration / Innovation / Inspiration / Information SmartTrans Board Hon. Mark Vaile AO Non-Executive Chairman Bryan
Forward-looking Statement
 1 Forward-looking Statement Certain statements contained in this document may be viewed as forwardlooking statements within the meaning of Section 27A of the U.S. Securities Act of 1933, as amended, and
REDBUBBLE INVESTMENT OVERVIEW
 REDBUBBLE INVESTMENT OVERVIEW 18 May 2016 RB: A creative marketplace As a marketplace RB has strong, reinforcing growth ARTISTS CUSTOMERS CONTENT 399,000 1.25M 1H FY16 9.8M 3 rd PARTY FULFILLERS 12 FULFILLERS,
Zhou Hei Ya International Holdings Company Limited 1H17 Interim Results Announcement. August 2017
 Zhou Hei Ya International Holdings Company Limited 1H17 Interim Results Announcement August 2017 Disclaimer This presentation and the accompanying slides (the Presentation ) have been prepared by Zhou
2014/2015 School Year. Unit / Theme Content (Nouns) Skills (Verbs) YC Learning Outcomes & Course Content/ADE Standards
 Skills (Verbs) YC Learning Outcomes & Course Content/ADE Standards") School : Prescott High dual enrolled with Yavapai College YAVAPAI COLLEGE/PRESCOTT UNIFIED SCHOOL DISTRICT District Instructional Guide (DIG) Year Long Semester Pacing Guide Subject: YC: ACC131 (Principles
School : Prescott High dual enrolled with Yavapai College YAVAPAI COLLEGE/PRESCOTT UNIFIED SCHOOL DISTRICT District Instructional Guide (DIG) Year Long Semester Pacing Guide Subject: YC: ACC131 (Principles
RECORDED ACROSS ALL SALES CHANNELS AND IN PARTICULAR IN THE MULTI-BRAND CHANNEL, UP 7.1%
 PRESS RELEASE REVENUES FOR THE FIRST QUARTER OF 2016 +4.7% INCREASE IN REVENUES THANKS TO POSITIVE PERFORMANCE RECORDED ACROSS ALL SALES CHANNELS AND IN PARTICULAR IN THE MULTI-BRAND CHANNEL, UP 7.1% +14%
Investor Presentation May 2017
 Investor Presentation May 2017 Safe Harbor This presentation contains forward-looking statements. All statements other than statements of historical fact contained in this presentation, including statements
CHINA INDUSTRIAL GROUP INC
 CHINA INDUSTRIAL GROUP INC FORM 10-Q (Quarterly Report) Filed 04/22/96 for the Period Ending 02/29/96 Address 599 LEXINGTON AVENUE 18TH FLOOR NEW YORK, NY, 10022 Telephone 2123088877 CIK 0000818726 Symbol
MICHAEL KORS JOHN IDOL, CHAIRMAN & CEO TOM EDWARDS, CFO & COO
 MICHAEL KORS JOHN IDOL, CHAIRMAN & CEO TOM EDWARDS, CFO & COO FORWARD LOOKING STATEMENTS This presentation contains forward-looking statements. You should not place undue reliance on such statements because
LIQUOR CHANNEL OVERVIEW. February 2018
 LIQUOR CHANNEL OVERVIEW February 2018 The liquor channel matters #1 IN TOTAL ALCOHOL EXPERIENCE $46 BILLION IN SALES +46K LIQUOR OUTLETS 85% sell beer 164M TOTAL TRIPS Sources: Nielsen TD Linx 2016; Nielsen
CB&I Investor Presentation March 2017
 A World of Solutions CB&I Investor Presentation March 2017 A Leading Provider of Technology and Infrastructure for the Energy Industry Safe Harbor Statement This presentation contains forward-looking statements
SWISS EQUITIES CONFERENCE
 SWISS EQUITIES CONFERENCE 12 th JANUARY 2018, Bad Ragaz Tobias Knechtle (CFO) Valora: Highlights 2017 - Well on track to achieve mid-term profitability targets - Acquisition and integration of Pretzel
Mengniu Maintains High Revenue Growth of 8.1% for Interim 2017 Operating Profit Notably Improves
 [Press Release] Mengniu Maintains High Revenue Growth of 8.1% for Interim 2017 Operating Profit Notably Improves 2017 Interim Results Highlights (Unaudited): For the six months ended 30 June Change 2017
HUGO BOSS Third Quarter Results 2017
 HUGO BOSS Third Quarter Results 2017 Metzingen, November 2, 2017 Mark Langer (Chief Executive Officer) - The spoken word shall prevail Good afternoon Ladies and Gentlemen, and welcome to our Third Quarter
For personal use only. TPW Revised Plan APR 2016
 TPW Revised Plan APR 2016 1 Executive Summary of the Revised Plan One of largest online retailers in category TPW is well positioned to capture a large share of the online homewares & furniture market
SILVERCORP REPORTS SILVER PRODUCTION OF 5.0 MILLION OUNCES, CASH FLOWS FROM OPERATIONS OF $31.9 MILLION, OR $0
 NEWS RELEASE Trading Symbol: TSX: SVM SILVERCORP REPORTS SILVER PRODUCTION OF 5.0 MILLION OUNCES, CASH FLOWS FROM OPERATIONS OF $31.9 MILLION, OR $0.19 PER SHARE, FOR FISCAL YEAR ENDED MARCH 31, 2016 VANCOUVER,
Prabhat Dairy NANYANG. To the Board of Prabhat Dairy From Nanyang Consulting
 Prabhat Dairy To the Board of Prabhat Dairy From Nanyang Consulting Nanyang Business School Deeksha Bajaj Bohao Zou Zeeshan Ashraf Wendell Shirley Agenda Problem Statement Analysis Recommendation Evaluation
1H FY2014 Consolidated Results
 1H FY2014 Consolidated Results Nov 6, 2014 Copyright 2014 Mitsubishi Logistics Corporation All Rights Reserved 1H FY2014 Consolidated Results Presentation 1H FY2014 Consolidated Results Contents 1.1H FY2014
Fresenius Investor News
 Analysts Meeting and Live video webcast today Fresenius Medical Care at 2.30 p.m. CET / 8.30 a.m. EDT Fresenius AG at 4.30 p.m. CET / 10.30 a.m. EDT health care worldwide May 4, 2005 Contact: Birgit Grund
The Collaborative Power of VMI 2.0
 WHITE PAPER The Collaborative Power of VMI 2.0 For more than a decade, out-of-stock rates have hovered at an average of 8 percent, according to a GMA/FMI Trading Partner Alliance report 1. More troubling
Thank you, and welcome to The New York Times Company s second-quarter 2015 earnings conference call.
 The New York Times Company Second-Quarter 2015 Earnings Conference Call August 6, 2015 Andrea Passalacqua Thank you, and welcome to The New York Times Company s second-quarter 2015 earnings conference
Furusato Earnings Presentation
 Furusato Earnings Presentation 2Q FY20 Ended September 0, 20 (April to September 0, 20) Friday, November, 20 Top of the Square UTAGE, Otemachi Consolidated Results Summary H FY0 H FY YoY YoY(%) Net sales
CHRISTIANA SHI: Good afternoon, everyone. I m Christiana Shi, President of Nike s Direct to Consumer Business.
 This transcript is provided by NIKE, Inc. only for reference purposes. Information presented was current only as of October 14, 2015, and may have subsequently changed materially. NIKE, Inc. does not update
To provide glamour, excitement and innovation through quality products at affordable prices.
 Revlon - 2007 Forest David: Francis Marion University A. Case Abstract Revlon (www.revlon.com) is a comprehensive business policy and strategic management case that includes the company's fiscal year-end
Unilever - CAGNY. Graeme Pitkethly / Richard Williams 22 nd February 2018
 Unilever - CAGNY Graeme Pitkethly / Richard Williams 22 nd February 2018 Richard Williams SAFE HARBOUR STATEMENT This announcement contains forward-looking statements, including 'forward-looking statements'