1 Although the relative export price on a contract currency basis should normally be used, the dollar-based
|
|
|
- Coleen Hines
- 6 years ago
- Views:
Transcription
1 Part II Strengthening Japan s competitiveness by taking advantage of its robustness Chapter 1 Analysis: Japan s competitive advantage in cross-border activities Section 1 Competitiveness in exports 1. Decomposition of the changes in Japan s goods exports In Part I, Chapter I, it was mentioned that Japan has continued to record a trade deficit since 2011 and that in 2014, the expansion of the trade deficit is starting to be arrested as the volume of exports resumed growing. Below, in light of this trend in Japan s trade in recent years, the causes of changes in the export volume of goods from Japan will be identified. (1) Price competitiveness and export volume Figure II shows a comparison between changes in Japan s relative export price (relative to export prices in the world and developed countries, dollar-based, year-on-year changes) and the real effective exchange rate (year-on-year changes). The relative export price refers to the ratio of Japan s export price (dollar-based) to the world export price (dollar-based), with a rise in the relative export price indicating a decline in the price competitiveness of Japanese export goods and a drop in the price indicating an improvement of the price competitiveness 1. The yen s real effective exchange rate is an indicator of the potential price competitiveness of Japan s export goods. When measuring Japan s international competitiveness, it is desirable to use the yen s real exchange rate, which takes account of changes in product prices in trading partner countries, rather than merely looking at nominal exchange rate movements. Also, in order to examine Japan s competitive relationship in the entire global market, it is necessary to use the yen s effective exchange rate, which takes account of its exchange rate movements relative to a basket of currencies, rather than against a single foreign currency. As the real effective exchange rate takes account of these two points, it is a better indicator of Japan s international competitiveness than the nominal exchange rate relative to a single foreign currency 2. When the yen s exchange rate rises relative to the basket of currencies, the real effective exchange rate rises accordingly if there is not any difference between the inflation rates in Japan and the trading partner countries. In this case, it can be said that the potential price competitiveness of Japan s export goods declines. Conversely, when the yen s exchanges rate drops, the real effective exchange rate falls accordingly. In this case, it can be said that the potential price competitiveness of Japan s export goods increases. Potential refers to a such situation that the actual price competitiveness does not change unless companies revise their sales prices. A closer look at the relationship between corporate price-setting 1 Although the relative export price on a contract currency basis should normally be used, the dollar-based relative export price is used here due to data constraints. In Japan s case, around 40 of export transactions are settled in yen in terms of value, so it should be kept in mind that the calculation of dollar-based export prices is directly affected by changes in the dollar-yen exchange rate. 2 From Ito et al. (2011). 91
2 behavior and exchange rate movements will be shown below. Figure II Changes in real effective exchange rate and relative export price (Year-on-year change, ) Relative export prices (in the world) Relative export prices (in developed countries) Real effective exchange rate Decline in price competitiveness Improvement of price competitiveness Notes: Relative export price = Japan s export price (dollar-based) / world (developed countries) export price (dollar-based) Source: BIS, IFS (IMF). (Year) Generally speaking, when the yen s real effective exchange rate is rising, Japanese companies suffer a drop in profits unless they raise their sales prices abroad. That is because when the yen strengthens relative to other currencies, the yen-based value of overseas sales prices declines. To mitigate the effects of the reduced margin, it is necessary to raise overseas sales prices 3. Consequently, when the yen s real effective exchange rate is rising, an increasing number of Japanese companies are expected to raise their overseas sales prices (which means a decline in their price competitiveness in the relevant countries). Conversely, when the real effective exchange rate is declining, there is room for lowering overseas sales prices while keeping the profit margin unchanged. Consequently, when the real effective exchange rate is declining, an increasing number of Japanese companies are expected to lower their overseas sales prices (which means an improvement in their price competitiveness in the relevant countries). Although there are analytical limits, such as the susceptibility of export prices in the world and in developed countries to the effects of international prices of crude oil and other commodities, Figure shows that Japan s real effective exchange rate has mostly been moving in parallel with the relative export price. 3 Cabinet Office (2004), Chapter 3, Section 2. 92
3 Other factors being equal, it is not until Japanese companies slash their overseas sales prices against the backdrop of an improvement in their potential price competitiveness (a decline in their real effective exchange rates) when their overseas sales volume increases, and consequently their export volume increases. However, the figure also shows that during periods of significant exchange rate movements, such as the yen s strengthening in 2009 and its weakening in 2013, there was temporarily a large disparity between the real effective exchange rate and the relative export price. Presumed factors behind the disparity include the presence of speculative trading in the exchange market and the diversification of corporate price-setting behavior in recent years. For example, when many exporting companies refrain from lowering overseas sales prices in order to secure profits, rather than sales volume, during a period of the yen s weakening, the change in the export price is small relative to the change in the real effective exchange rate. The same is also true when many countries refrain from raising overseas sales prices during a period of the yen s strengthening with priority placed on maintaining sales volume, rather than profits. Indeed, Figure II shows that when the yen s real effective exchange rate was declining from 2005 to 2007 and from late 2012 to 2013, the export price index on a contract currency basis dropped only slightly. Meanwhile, when the yen was appreciating from the middle of 2008 onwards, export prices did not rise much. 93
4 Figure II Real effective exchange rate and export price index Total products Contract currency basis Real effective exchange rate Source: Corporate Goods Price Index (Bank of Japan), BIS. (Month, year) Furthermore, corporate price-setting behavior varies depending on the type of goods that they export. Figure II is a comparison between the movements of the real effective exchange rate and the export price index (on a contract currency basis). This shows that against the backdrop of intensifying international price competition, the export prices of electric and electronic machinery on a contract currency basis have continued to decline with no regard to the movements of the real effective exchange rate. In contrast, the export price of textiles on a contract currency basis has been rising against the backdrop of a trend shift in export products to higher price ranges. The figure indicates that the export price of chemicals tends to move in line with the price of crude oil, which is a raw material of chemicals. Although the export price of transportation equipment, including motor vehicles, generally moved in line with the real effective exchange rate until around 2010, the link seems to have been weakening somewhat since Another factor that is weakening the link between the export price and the real effective exchange rate is growth in exports by companies in Japan to their overseas affiliates following an increase in the number of Japanese companies moving their business operations to other countries. Price-setting behavior concerning such intra-company transactions may be substantially different from that concerning export transactions in general. 94
5 Figure II Electric and electronic machinery Real effective exchange rate Real effective exchange rate and export price index Transportation Textiles equipment Real effective exchange rate Real effective exchange rate Contract currency basis (right scale) Contract currency basis (right scale) Contract currency basis (right scale) (Month, year) (Month, year) (Month, year) Source: Corporate Goods Price Source: Corporate Goods Price Source: Corporate Goods Price Index (Bank of Japan), BIS. Index (Bank of Japan), BIS. Index (Bank of Japan), BIS. Chemicals Chemicals Real effective exchange rate Crude oil prices Contract currency basis (right scale) Contract currency basis (right scale) (Month, year) Source: Corporate Goods Price Index (Bank of Japan), BIS. (Month, year) Source: Corporate Goods Price Index (Bank of Japan), BIS. To consider this matter, let us look at Figure II , which is a comparison between the movements of Japan s export volume (2010=100) and the yen s real effective exchange rate (2010=100). This figure shows that from around 2000 to 2007, the export volume continued to grow while the real effective exchange rate continued to decline. However, around the middle of 2007, when the subprime mortgage loan problem surfaced in the United States, the real effective exchange rate turned up sharply and subsequently stayed at a high level until late In the meantime, Japan s export volume has remained stagnant, failing to regain the level before the collapse of Lehman Brothers. Although the real effective exchange rate has 95
6 declined significantly since late 2012, Japan s export volume has stayed almost flat, rather than starting to grow again. In general, it takes a certain amount of time before companies revise their export prices following a change in the exchange rate 4. In addition, it presumably takes time before an export price revision is reflected in overseas sales prices and causes a sales volume change. Therefore, it may take a substantial period of time before the effects of a decline in the real effective exchange rate can be observed in the export volume change by way of a price revision 5. As more than two years have elapsed since the yen s real effective exchange rate started to decline significantly, attention is focusing on the future trend in Japan s export volume. Figure II Changes in real effective exchange rate and Japan's export volume Export volume index Real effective exchange rate Appreciation of yen Depreciation of yen Notes: Export volume index is seasonally adjusted. Source: Trade Statistics of Japan (MOF), BIS. (Year) Why has the export volume remained stagnant despite the improvement in Japan s price competitiveness? Factors other than corporate price-setting behavior that may affect the export volume will be shown below. (2) External demand and export volume Among other factors that may affect the export volume, the external demand trend must be mentioned first. Usually, the aggregate value of real GDP (dollar-based) of countries around the world 4 For example, Ito et al. (2010) conducted a questionnaire survey on 215 Japanese exporting companies, and regarding the frequency of reflecting exchange rate movements in sales prices, the survey found that around 80 of the 137 respondent companies made price revision within one year. 5 In cases where the yen is weakening, this is called the J-curve effect. 96
7 is adopted as an indicator of external demand. However, in order to identify external demand as seen from the standpoint of Japanese export industries, it is necessary to take into consideration the breakdown of goods export by export destination country. Figure II shows changes in the shares of exports to the United States, Europe (EU28) and China in Japan s overall exports. As an export destination for Japan, the United States has the largest share, around 20, followed by China with around 19 and Europe with around 12. The three main export destinations together account for half of overall Japanese exports. The figure indicates that while Europe-bound exports share has been on a long-term downtrend since the Collapse of Lehman Brothers, U.S.-bound exports share has been growing since 2012, whereas China-bound exports share has remained flat since Figure II Changes in Japan's export by destination country and region United States China Europe (EU28) Notes: Shares of the value of customs-cleared exports to destination countries and regions in Japan s overall exports (Yen basis) Source: Trade Statistics of Japan (MOF). (Year) Figure II shows the weighted average of changes in real GDPs of 26 trading partners of Japan 6 using each value of customs-cleared exports to them as the weight. According to this figure, Japan s export volume, which had previously increased almost in line with the real GDP growth of major export destination countries, has been growing at a much slower pace than the real GDP growth of those countries since This finding suggests that Japan s stagnant export volume in recent years is not attributable to the external demand trend. 6 The 26 countries and regions are: the United States, the United Kingdom, Belgium, Denmark, France, Germany, Italy, the Netherlands, Norway, Sweden, Canada, Finland, Portugal, Spain, Australia, New Zealand, Mexico, the Republic of Korea, Taiwan, India, Indonesia, Singapore, Malaysia, the Philippines, Thailand and China (including Hong Kong). The 26 countries and regions account for approximately 87 (the average between 1985 and 2014) of Japan s overall export value. 97
8 Figure II Changes in foreign real GDP and Japan's exports volume Export volume index Foreign real GDP (Year) Notes: 1. Foreign real GDPs is a weighted average of GDPs using each value of customs-cleared exports to trading partners of Japan as the weight (from the 1st quarter of 1985 to the 4th quarter of 2014). 2. Export volume index is seasonally adjusted. Source: Trade Statistics of Japan (MOF), Economic Outlook Database (OECD), Oxford Economics. (3) Value addition and export volume Value addition of export goods is another factor that may significantly affect the export volume. Here, the definition of value addition of export goods will be first clarified in relation to the export price index 7. In general, the export price index is computed by fixing products investigated, removing effects of both qualitative changes and changes in the product mix. Therefore, even if value addition to export goods which may imply either an increase in value-added of individual exported products or an increase in the share of higher value-added products in export, has occurred after the base year of the index, such changes do not affect the export price index. Value addition to individual export products may imply a shift in price range of passenger cars, for example, cars toward a higher range of cars with larger engine displacement. The export price index for ordinary passenger cars is produced by fixing a basket of cars of a specific category (in terms of engine displacement) as the survey subjects tracing their price changes. Therefore, even if the average export price of passenger cars may increase due to a shift in their price range toward a higher range of cars with larger engine displacement, such increase does not affect the export price index for ordinary passenger cars. An increase in the share of higher value-added products may imply, for example, such a case 7 The export price index is produced by the Bank of Japan using the methodology based on a fixed-weight Laspeyres formula. 98
9 that the share of large passenger cars increases where the price index for passenger cars is comprised of two sub-categories (ordinary passenger cars and large passenger cars). In this case, as the export price index makes the shares of sub-categories fixed in the reference period, the index for passenger cars does not change even if the average export price for passenger cars increases. Therefore, value addition to export goods may be regarded as a price increase that cannot be captured by the export price index. As for the relationship with export volume, the more value is added to an exported item, the less likely it is to increase its export volume even if the export price remains constant. Indeed, as value addition to Japanese export goods steadily proceeds, Japan s goods trade has become structurally biased against an export increase. (Figure II ). Figure II Value addition to Japanese export goods Value-added index Notes: value-added index = real exports / export volume; The index is seasonally adjusted. Source: Trade Statistics of Japan (MOF), Corporate Goods Price Index (BOJ). (Year) Figure II decomposes changes (year-on-year) in value addition to Japanese export goods into value addition to individual export products (product quality factor) and increases in high-value-added products shares among exports (product mix factor). The result shows that the product quality factor constantly contributes positively to value addition while the product mix factor tends to contribute negatively to value addition through an increase in low-value-added products shares. As demand for products with reduced prices usually grows, it is not easy to promote value addition by enhancing product mix. Indeed, Figure II indicates that between late 2004 and 2009, Japanese export industries, while promoting value addition to individual export items, expanded 99

10 production of low-value-added products at the same time, as they failed to increase high-value-added products shares. However, since 2010, whereas value addition to individual export products has continued, the rise in low-value-added products shares in the product mix, which had intermittently been observed until then, has all but disappeared. This suggests that the move to expand production of low-value-added products has been rolled back substantially. Furthermore, since 2013, the value addition to individual export products has slowed down significantly, indicating that the trend of value addition to Japanese export goods has remained stagnant. Figure II Decomposition of changes in value-added index (Year-on-year change, ) Product quality factor Product mix factor Value-added index Notes: For details of the decomposition, see Supplementary Note 1. Source: Trade Statistics of Japan (MOF), Corporate Goods Price Index (BOJ). (Year) (4) Export goods production capacity and export volume Export goods production capacity is also an important factor that may affect export volume. As is widely known, amid the rapid overseas expansion of the Japanese manufacturing industry, there are concerns over a possible hollowing out of the industry due to transfer of production facilities to foreign countries. If domestic production infrastructure continues to shrink, it would become difficult to increase exports from Japan by taking advantage of growing external demand in the future because of constraints imposed by the production capacity reduction. Therefore, it may be said that domestic production capacity is the most important element of Japan s competitiveness in export. In general, other conditions being equal, a country s export volume is proportionate to the scale of 100
11 its domestic export goods production capacity 8. Therefore, below, the relationship between the export goods production capacity and export volume will be shown. First, changes in the Japanese manufacturing industry s total domestic production capacity will be shown, including for domestic sales and exports (Figure II ). The figure shows that the production capacity of the entire manufacturing industry continued to grow until around 1997, when it started to decline. The production capacity continued to decline until around 2004 and resumed growing in 2005, with the uptrend continuing until In 2009, the year after the Collapse of Lehman Brothers, the production capacity started to decline again, and the downtrend continued until Next, production capacity by individual industry will be shown. The production capacity of the electric machinery industry (old classification) 9 (machinery manufacturing industry + information equipment and communication electronics industry + electronics parts and devices industry) remained on the path of recovery from the collapse of the IT bubble in 2001 until 2011, when it started to decline again following the Great East Japan Earthquake in March of the year. In particular, in the field of household electric appliances, where Japanese companies face severe competition from their counterparts in emerging countries, production capacity has been declining steeply over a long period of time since the latter half of the 1990s. In materials industries, including iron and steel, metal products, ceramics, stone and clay products and chemicals, production capacity has been on a long-lasting downtrend. In the transport equipment industry, which is the core of Japan s export industries, production capacity shrank significantly between 2000 and Although production capacity remained flat thereafter, it has been declining again since The production capacity of electronics parts and devices, which consistently continued to grow in the past, has been shrinking after peaking around As shown above, domestic production capacity has been declining in almost all industries in recent years. 8 Refer to Goldstein, M and Mohsin S. Khan (1978), pp276, for example. 9 The electric machinery industry as referred to here, which is an old classification of the Indices of Industrial Production, comprises the electric machinery manufacturing industry, the information equipment and communication electronics manufacturing industry and the electronics parts and devices manufacturing industry under the current 2010 classification. 101
12 Figure II Domestic production capacity index by industry (exports + domestic consumption) Manufacturing industry Electric machinery industry (old classification) Household electric appliances industry Iron and steel industry Metal products industry Ceramics, stone and clay products industry Chemical industry Information and communication electronics equipment industry Transportation equipment industry Electronic parts and devices industry Source: Indices of Production Capacity of Japan s Manufacturing Industry (METI) 102
13 Next, changes in the ratio of exports to overall shipments (export ratio) by industry will be shown. Figure II shows changes in the export ratio concerning materials industries and processing/assembly industries. According to this figure, the export ratio has been rising in recent years in many industries. The uptrend in the export ratio started in materials industries, including textile manufacturing, in the 1990s or so, and in processing/assembly industries such as transport equipment and general-purpose machinery manufacturing a little later, in the 2000s. However, since around 2008, the export ratio growth has remained stagnant in both materials and processing/assembly industries. In the information and communication electronics equipment industry, which is among the processing/assembly industries, the export ratio started to rise again in 2011 after a long period of decline. On the other hand, the export ratio has continued to decline steeply in the electronic parts and devices industry since Meanwhile, in the electrical machinery industry, the export ratio has remained almost flat. The figure shows that in 2014, the export ratio rose in most industries, including materials industries but excluding the electronic parts and devices and some other industries. In particular, the export ratio rose steeply in the information and communication electronics equipment industry. Figure II Changes in export share by industry I. Materials industries Iron and steel industry Chemical industry Textile industry Plastic products industry (Year) Notes: Export share = (index of shipments for export x export weight) / (index of shipments for exports x export weight + index of shipments for domestic sales x domestic shipment weight) x 100 Source: Breakdown List of Industrial Shipment (METI). 103
14 II. Processing/assembly industries. Electronic parts and devices industry Electric machinery industry Transportation equipment industry Information and communication electronics equipment industry General machinery industry (Year) Notes: Export share = (index of shipments for export x export weight) / (index of shipments for exports x export weight + index of shipments for domestic sales x domestic shipment weight) x 100 Source: Breakdown List of Industrial Shipment (METI). In general, there is presumably a positive correlation between the movements of the export goods production capacity and shipments for exports, so it may be assumed that when the export ratio (shipments for export / (shipments for exports + shipments for domestic sales)) is rising while domestic production capacity as a whole is declining, the export goods production capacity is growing. Below is predicted changes in the production capacity of exports goods in Japan using data concerning domestic production capacity and the export ratio. As there are no statistics directly concerning the export goods production capacity, a figure obtained by multiplying the domestic production capacity component of the Indices of Production Capacity prepared by METI by the export ratio calculated based on the breakdown list of industrial shipments (shipments for exports/(shipments for domestic sales + shipments for exports), also prepared by METI 10 is used as a proxy for the Japanese exporting industries export goods production 10 However, the operating rate of production facilities is not taken into consideration here. The production capacity obtained through shipment data reflects the effects of short-term fluctuations of the operating rate that accompany the economic cycle. In other words, in this case, a drop in shipments for export caused by a decline in the operating rate of export goods production facilities, rather than a decline in the export goods production capacity, is also treated as the effect of a decline in the export goods production capacity. Therefore, it should be kept in mind that the export goods production capacities calculated below reflect the effects of fluctuations of the operating rate. In recent years, the so-called mixed line production system, which refers to the production of products for export and those for domestic sales on a single production line, has become widespread, mainly in the motor vehicle and general machinery industries. A production system innovation like this makes it possible for companies to flexibly use existing production capacities for export and domestic sales in accordance with the demand trend. Consequently, when evaluating the trend in production capacity for export and domestic sales based on 104
15 capacity. Figure II shows the estimation results. Looking at the figure, the domestic consumption goods production capacity continued to decline for a long period of time from the late 1990s onwards, the export goods production capacity continued to grow until around early 2011 except for the temporary decline in the aftermath of the Collapse of Lehman Brothers. During this period, Japan s export goods production capacity stayed flat until around the middle of the 1990s before starting to grow rapidly around the middle of 1996 against the backdrop of the strong performance of the U.S. economy and the yen s weakening. Given that the yen started to weaken around the middle of 1995, it took around one year before the effects of the yen s weakening appeared in the form of growth in the export goods production capacity. Subsequently, the export goods production capacity generally remained flat until 2002, when it resumed growing after the collapse of the IT bubble. At that time, the yen started to weaken around the beginning of 2001, indicating that it took around one year before the effects of the yen s weakening appeared in the form of growth in the export goods production capacity. The yen remained weak until around the middle of 2007, and the export goods production capacity continued to grow over this period. The export goods production capacity has fallen steeply twice since The first plunge in the production capacity started in the fourth quarter of 2011, around three years after the Collapse of Lehman Brothers, and continued for five quarters, until the fourth quarter of The second plunge continued from the first quarter of 2014 to the third quarter of the same year (however, given that the production capacity declined only 0.4 year on year in the third quarter of 2014, the effective duration of the plunge was two quarters). As the yen s strengthening that started around the middle of 2007 continued until around the end of 2012, the first plunge took place amid the prolonged strong-yen trend. Given that the capacity continued to decline year on year for more than one year and that it has not yet recovered to the pre-plunge period 11, it can be presumed that Japanese companies made earnest efforts to curtail their export goods production capacity. On the other hand, the second plunge in the export goods production capacity is unlikely to be the result of earnest efforts to cut back on the capacity, given that it took place after the yen started to weaken around the end of 2012 and that the plunge continued just two quarters, with the capacity rebounding far above the pre-plunge level in the fourth quarter of 2014, just three quarters from the start of the plunge. Rather, these data strongly suggest that some special factor or other caused the export goods production capacity to drop temporarily. shipment data, it is necessary to closely watch other relevant economic statistics and the various underlying economic phenomena as well. 11 The export goods production capacity index immediately before the plunge was (in the third quarter of 2011). As of the fourth quarter of 2014, the index was lower than this level. 105
16 Figure II Changes in production capacity of export goods (Year-on-year change, ) Index of production capacity of export goods (right scale) Index of production capacity of export goods Index of production capacity of domestic consumption goods (Year) Notes: Production capacity of export goods = production capacity index x export share Export share = (index of shipments for export x export weight) / (index of shipments for exports x export weight + index of shipments for domestic sales x domestic shipment weight) x 100 Production capacity of domestic consumption goods = production capacity index x (1 - export share) Source: Indices of Production Capacity of Japan's Manufacturing Industry, Breakdown List of Industrial Shipment (METI). What special factor was there at that time? In April 2014, the consumption tax rate was raised, and in the first quarter of the year, there was a last-minute surge in demand before the tax hike. Indeed, the actual operating rate 12 of Japan s manufacturing industry started to rise in 2013, the year before the consumption tax hike, after continuing to decline from the second quarter of In the first quarter of 2014, the actual operating rate, which stood at 74.6 in the fourth quarter of 2012, climbed to 84.9, the highest level since the third quarter of 2008, the year of the Collapse of Lehman Brothers. Subsequently, the operating rate fell back to 78.6 in the third quarter of 2014, immediately after the consumption tax hike (Figure II ). In the meantime, the growth in shipments for export slowed down considerably, to 2.6 in the first quarter of 2014, followed by a decline of 1.2 in the second quarter of the same year. However, shipments for export started to grow again in the third quarter of the same year and posted a significant increase, 4.3, in the fourth quarter of the year. On the other hand, shipments for domestic sales grew significantly in the fourth quarter of 2013 and the first quarter of 2014, before starting to decline again in the third quarter of These data 12 Estimated by multiplying the published actual operating rate level in the base year (2010) by the operating rate index. 106
17 provide a strong indication that Japanese companies shifted some of their production capacity for export to production for domestic sales in order to meet the last-minute surge in demand before the consumption tax hike 13. As shown above, it is highly likely that the two phases of plunge in the export goods production capacity since 2011 are quite different in nature from each other. Figure II Changes in actual operating rate, shipments for exports, and shipments for domestic sales before and after the consumption tax hike (Year-on-year change, ) Shipments for exports Shipments for domestic sales Actual operating rate (exports + domestic consumption; right scale) (Year) Source: Indices of Production Capacity of Japan's Manufacturing Industry, Breakdown List of Industrial Shipment (METI). Finally, looking at recent developments, since the latter half of 2014, the export goods production capacity has been growing again. In the fourth quarter of the same year, it recovered to the level before the collapse of Lehman Brothers. The continuing decline in the domestic consumption goods production capacity is a cause for concern. However, regarding the export goods production capacity, there are indications that Japanese exporting industries started again to devote efforts to building up their production capacity in Japan against the backdrop of a recent improvement in the export environment, backed by a recovery in external demand and stable exchange rate movements. A comparison of the movements of the export goods production capacity thus identified and the 13 Regarding motor vehicle-related real exports, the Bank of Japan (2014) reported that supply constraints associated with a steep rise in domestic sales temporarily had an export volume-reducing effect. It was reported at a meeting in August 2014 of the Industrial Structure Council s Manufacturing Industry Committee (second meeting) that companies response to the last-minute surge in demand (production increase) continued after the consumption tax hike implemented in April 2014, mainly in the motor vehicle industry, as production did not catch up with demand. 107
18 movements of export volume shows a strong positive correlation between the two. However, it also shows that there was a large disparity between them during periods of short-term volatility of export volume, such as around the time of the Collapse of Lehman Brothers (Figure II ). Overseas inventory investment, which is explained below, is an important factor that may trigger short-term volatility of export volume. Figure II Changes in production capacity of export goods and export volume Export volume index Index of production capacity of exports goods (Year) Notes: 1. Index of production capacity of exports goods = production capacity index x export share; Export share = (index of shipments for export x export weight) / (index of shipments for export x export weight + index of shipments for domestic sales x domestic shipment weight) x Export volume index is seasonally adjusted. Source: Indices of Production Capacity of Japan's Manufacturing Industry, Breakdown List of Industrial Shipment (METI). (5) Overseas inventory investment and export volume In general, in the expansionary phase of the business cycle, companies increase their production and exports to accumulate their inventories, while in the recessionary phase, they reduce or suspend their production and export in order to cut back on excessive inventories. Consequently, corporate inventory investment activities, including inventory accumulation and adjustment, work to magnify the changes in production and export in the course of business cycle, rather than offset the changes 14. At this time, as a proxy variable for overseas inventory investment by Japanese export industries, the change in inventories is used, which consists one of demand components of GDP, as a share of 14 For example, the Economic Planning Agency (1992) stated as follows in Chapter 2, Section 5 concerning the characteristics of inventory investment: In reality, as inventory investment increases in the expansionary phase and declines in the recessionary phase, it magnifies, rather than offsets, the changes of production during the business cycle. This indicates that when inventory plays a buffer role, there is an appropriate amount of inventory which is broadly proportionate to the level of demand and that the inventory changes in parallel to the changes in demand. 108
19 the aggregate nominal GDPs of major trade partners of Japan (Figure II ). This makes it possible to explain a large part of the short-term volatility of Japan s export volume induced by overseas inventory investment. Indeed, Figure II shows that Japanese companies made rapid inventory adjustment and accumulation in such a short period of one year, from 2001 to 2002 immediately after the bursting of the IT bubble and from 2008 to 2009 immediately after the Collapse of Lehman Brothers. The more inventory investment volatile, the more export volume swings during a short period of time. Figure II Changes in overseas inventory investment Changes in overseas inventory as a share of the nominal GDP (Year) Notes: Figure shows the weighted average of SNA base changes in inventories as shares of the nominal GDPs of 24 major trading partners of Japan (US, UK, Belgium, Denmark, France, Germany, Italy, Netherlands, Norway, Sweden, Canada, Finland, Portugal, Spain, Australia, Mexico, ROK, Taiwan, India, Indonesia, Malaysia, Philippines, Thailand, and China excluding Hong Kong) using the customs-cleared values of export to those trade partners as the weight. The figure is seasonally adjusted. Source: Oxford Economics. A look at overseas inventory investment since 2012 indicates that the investment amount has been on a downtrend even though there has not been a significant change in overseas demand. In the fourth quarter of 2014, overseas inventory investment declined 0.2, marking the first drop since around the time of the Collapse of Lehman Brothers. A decomposition of overseas inventory investment by export partners shows that while inventory accumulation has continued in the United States, China and Indonesia because of favorable economic conditions there, inventory adjustment has intensified since around 2012 in some Asian countries, including the Republic of Korea, Thailand and the Philippines, and EU member countries (Figure II ). In particular, inventory investment in the Republic of Korea fell steeply in the fourth quarter of
 United States China ROK Thailand Taiwan (Year) Notes: Figure shows the weighted average of SNA base changes in inventories as shares of the nominal GDPs of 24 major")
20 Figure II Overseas inventory investment by export trading partners Canada Australia India Mexico EU Taiwan Malaysia Philippines Thailand Indonesia ROK United States China Overseas inventory investment (shares of nominal GDP) United States China ROK Thailand Taiwan (Year) Notes: Figure shows the weighted average of SNA base changes in inventories as shares of the nominal GDPs of 24 major trading partners of Japan (US, UK, Belgium, Denmark, France, Germany, Italy, Netherlands, Norway, Sweden, Canada, Finland, Portugal, Spain, Australia, Mexico, ROK, Taiwan, India, Indonesia, Malaysia, Philippines, Thailand, and China excluding Hong Kong) using each value of customs-cleared exports to them as the weight. The figure is seasonally adjusted. Source: Oxford Economics. (6) Estimation of the export volume function and decomposition of changes Above, five factors presumed to be closely linked with the movements of Japan s export volume price competitiveness, external demand, value addition to export goods, domestic production capacity for export goods and overseas inventory investment are examined in detail for their characteristics and their relationship with the export volume. Below, Japan s export function will be estimated using all these five factors. In addition, using the estimation results, decomposition of the changes in export volume will be exhibited to show to what extent each factor affects Japan s export volume 15. Figure II is a comparison between the estimated export volumes based on the export volume function and the actual export volumes. This figure indicates that the estimated figures accurately track the volatile changes in the export volume around the time of the bursting of the IT bubble in 2001 and the Collapse of Lehman Brothers in As for the details of methods for estimation and descriptions as well as their results, refer to Supplementary Note However, the estimated figures are slightly higher than the actual figures for 2011 and later. This suggests that some structural factor other than these five factors used in the export volume function at this time has been newly emerging since Replacement of domestic production with the expansion of overseas production, for example, may be the candidate. However, analysis in this respect was refrained 110
21 Figure II shows a decomposition of changes (year-on-year) in export volume into five factors price competitiveness, external demand, value addition to export goods and export goods production capacity using the estimated figures obtained through estimation based on the export function. First, an overview of the relationship between each factor and export volume will be shown. As was expected, the overseas inventory investment factor explains a large part of the high volatility of the export volume when foreign demand has showed high volatility in the aftermaths of the Asian currency crisis in , the bursting of the IT bubble in 2001 and the Collapse of Lehman Brothers in However, since 2012, overseas inventory investment made negative contributions to the export volume during most of the period despite a lack of significant changes in external demand. This was because inventory investment has been curbed or reduced since 2012 in some Asian countries, including the Republic of Korea, which is a major export destination for Japan, and some EU countries, as shown in 1. (5). Next will be the real effective exchange rate, which is an indicator of the price competitiveness factor. The real effective exchange rate affects export volume with a time lag of around four quarters (one year). The figure shows that the real effective exchange rate turned to a positive contributor to the export volume since the fourth quarter of 1996 that corresponds to the year elapsed around one year since the middle of 1995 when the yen started to weaken. Likewise, the real effective exchange turned to a positive contributor to the export volume since the first quarter of 2002 corresponding year that have elapsed around one year since the beginning of 2001 when the yen started to weaken. In addition, when the yen started to weaken at the end of 2012, the export volume-increasing effect started to appear around one year later, at the end of Conversely, at the time of the yen s strengthening, including 1993, , and 2008 and subsequent years, the real effective exchange rate began to appear as a negative contributor to the export volume around one year after the strong-yen trend started. When looking at the movements of overseas real GDP, an indicator of the external demand factor, it had been a steadily positive contributor to export volume throughout the estimation period except for the subsequent year to the Collapse of Lehman Brothers in the fourth quarter of Meanwhile, the value addition factor had been a negative contributor to export volume throughout most of the period, reflecting the trend of value addition to Japan s export goods. However, since 2013, the negative contributions made by the factor have become somewhat smaller. This reflects the trend of value addition to Japanese export goods has remained stagnant since 2013, as was described in 1. (3). The export goods production capacity factor had been a temporarily negative contributor when external demand slumped seriously in the aftermaths of the bursting of the IT bubble and the Collapse of Lehman Brothers. But at other times, this factor constantly had been a positive contributor through the expansion of production of low-value-added products. because the necessary numbers of data cannot be obtained due to the brevity of the period. 111
22 Following the Collapse of Lehman Brothers, the exports goods production capacity factor ceased to make positive contributions to export volume despite a lack of a significant decline in external demand, as the expansion of production of low-value-added products was rolled back. Between the end of 2011 and the fourth quarter of 2012, the factor had an export volume-reducing effect 17. The above findings indicate that Japan s export volume expanded steadily between 2002 and 2008, before the Collapse of Lehman Brothers, because the positive contribution from an increase in the export goods production capacity backed by external demand growth and the expansion of production of export goods, mainly low-value-added products, constantly outweighed the negative contribution from the value addition trend, except when export volume was affected by the short-term impact of the overseas inventory investment factor 18. Meanwhile, Japan s export volume has remained stagnant since 2011 because the positive contribution from an improvement in price competitiveness due to robust external demand and the yen s weakening failed to surpass the negative contribution from such factors as the trend of value addition to export goods, the reduction of the export goods production capacity that continued from the end of 2011 to 2012, a temporary decline in the export goods production capacity caused by the response to the consumption tax hike and the progress in inventory adjustment abroad. (7) Summary Japan s export volume resumed growing year on year in the fourth quarter of 2014 thanks to such factors as continued robust external demand, mainly in the United States, the ongoing recovery in the export goods production capacity after a temporary slump caused by the response to the consumption tax hike, and the improving price competitiveness due to the yen s weakening. However, as was already mentioned, Japan s goods trade has become structurally biased against an export increase because of the ongoing value addition trend. Besides, since the Collapse of Lehman Brothers, the expansion of production of low-value-added products, which presumably had led the growth in the export goods production capacity until then, has been rolled back significantly. As a result, if Japan is to maintain a certain degree of export volume growth in the future amid the rapidly evolving economic globalization, it is essential for the country to continue to promote the trend of value addition to export goods and maintain and expand the export goods production capacity. The key to maintaining and expanding the export goods production capacity will be whether Japanese export industries can grow their shares in the market for high-value-added products. 17 The export goods production capacity had a negative contribution in 2014 as well. However, this was probably because of a last-minute surge in demand before the consumption tax hike, rather than earnest efforts to reduce production capacity, as mentioned in 1. (4). 18 However, in 2005, export volume declined year on year because the negative contribution from the value addition factor temporarily surpassed the positive contribution from export the overseas demand and export goods production capacity factors. 112
23 Figure II Estimated export volume (not seasonally adjusted) and actual export volume Actual Estimated Notes: For details of the estimation method, see Supplementary Note 2(1). (Year) Source: Trade Statistics of Japan (MOF), Indices of Production Capacity of Japan's Manufacturing Industry, Breakdown List of Industrial Shipment (METI), Input-Output Tables for Japan (MIC), Corporate Goods Price Index (BOJ), Economic Outlook Database (OECD), IFS (IMF), BIS, Oxford Economics. 113
 Factors of production capacity of exports goods (indices of production capacity of exports goods) Higher value added content")
24 Figure II Decomposition of changes in export volume (not seasonally adjusted) (Year-on-year change, ) Asian Collapse of currency Bursting of Lehman crisis IT bubble Brothers Residuals Overseas inventory investment factors (changes in overseas inventories) Factors of production capacity of exports goods (indices of production capacity of exports goods) Higher value added content factors (value added index) Great East Price competitiveness factors (real effective exchange rates) Overseas demand factors (overseas real GDP) Japan Trend component Export volume (actual volume) Earthquake Consumption tax hike (Note 2) (Year) Source: Trade Statistics of Japan (MOF), Indices of Production Capacity of Japan's Manufacturing Industry, Breakdown List of Industrial Shipment (METI), Corporate Goods Price Index (BOJ), IFS (IMF), BIS, Oxford Economics, Economic Outlook Database (OECD). Notes: 1. For details of decomposition, see Supplementary Note 2(2). 2 The negative contribution by the production capacity of exports goods from the 1st quarter to the 2nd quarter of 2014 is considered to be caused mainly by the temporary shift of part of domestic production capacity from export sales to domestic sales in response to last-minute demand before the consumption tax hike, rather than by an intentional shift toward reduction of production capacity of export goods. For details, see Section 1 (4). 114
25 2. Overview of international comparison of competitiveness in export In this section, we will examine the force of Japan s competitiveness in export. Recently, signs of a recovery in Japan s export volume have started to appear at long last. However, while the export volume indexes for emerging countries and the United States have surpassed and remained above the level before the collapse of Lehman Brothers, the index for Japan has remained stagnant below the level before the collapse of Lehman Brothers (Figure II ). Here, we will look at the characteristics of Japanese exports through international comparison of traded goods classified by production process. Then, we will evaluate Japan s competitiveness in export by examining the export growth rates of major Japanese industries in terms of value and Japanese traded goods shares of imports by country/region (import value shares) based on Trade Statistics (Ministry of Finance). Figure II Changes in export volume indices of world and Japan Europe United States Emerging countries United States Japan Europe Emerging countries Japan World Europe Notes: Figures show annual equivalent of monthly data. Source: World Trade Monitor (Netherlands Bureau for Economic Policy Analysis (CPB)). (Year) (1) World trade and international comparison of traded goods classified by production process We will look at changes in the value of world trade and Japan s export trend and take an overview of the characteristics of Japan s exports through international comparison of traded goods classified by production process. (A) Changes in the value of world trade (export value) World trade has recorded high growth in terms of export value since 2000 (Figure II ). In the 2000s (2001 to 2010), world trade registered an average annual growth rate of 9.0, up sharply from 6.3 in the 1990s (1991 to 2000). So far in the 2010s (2011 to 2013), the average annual growth 115
26 rate slowed down to 6.9, which is still higher than the growth rate in the 1990s. In the 2000s, the world trade growth was led more by growth in emerging countries than by growth in developed countries (Table II ). (Trillion dollars) Figure II Changes in world trade (export value) World Developed countries Emerging countries Source: IFS (IMF). (Year) Table II Growth rates of world trade (export value) World Developed countries Source: IFS (IMF). Emerging countries (B) Exports by major exporting countries/regions in terms of value and their shares of world export value Exports by major exporting countries/regions 19 have generally been on an uptrend in terms of value since the latter half of the 2000s, with exports by China in particular growing considerably. Although the value of exports by Japan was higher than the values of exports by other Asian countries in the 1990s, its growth has been stagnant since the 2000s (Figure II ). 19 Here, major exporting countries/regions refers to the four largest exporting countries in 2014 (China, the United States, Germany and Japan) plus the Republic of Korea and ASEAN
27 As for major countries/regions shares of the world export value, whereas many countries/regions have been losing shares, China s share has been growing (Figure II ). Figure II Changes in export value of major export partners and regions (Billion dollars) Japan China United States ROK Germany ASEAN5 (Year) Notes: 1. Figures show data in and after 1991 for the U.S. and Germany and those in and after 1992 for China. 2. ASEAN5 consists of Indonesia, Malaysia, the Philippines, Singapore and Thailand. Figures from 1990 to 1994 exclude those for the Philippines and show those for the other four countries. Source: UN Comtrade. 117
28 Figure II Changes in shares of export value of major export partners and regions in world export value Japan China United States ROK Germany ASEAN5 (Year) Notes: 1. Figures show data in and after 1991 for the U.S. and Germany and those in and after 1992 for China. 2. ASEAN5 consists of Indonesia, Malaysia, the Philippines, Singapore and Thailand. Figures from 1990 to 1994 exclude those for the Philippines and show those the other four countries. Source: UN Comtrade. (C) Trend in exports of traded goods classified by production process Next, we will conduct international comparison of traded goods classified by production process (Figure II ) and look at changes 20. World trade (export value) in all types of traded goods classified by production process has been growing since the 2000s. Although it declined temporarily in 2009 due to the impact of the Collapse of Lehman Brothers, it has recovered moderately since then. World trade in raw materials increased by a factor of 6.8 (from billion dollars to 2,798.0 billion dollars) between 1990 and 2013 as it has gradually grown since the latter half of the 2000s. World trade in intermediate goods expanded by a factor of 5.3 (from 1,490.8 billion dollars to 7,950.6 billion dollars) between 1990 and 2013, while world trade in final goods grew by a factor of 4.5 (from 1,327.5 billion dollars to 6,011.1 billion dollars) (Figure II ). As for the shares of traded goods by production process in world trade (export value), intermediate goods share has stayed at around 50, but final goods share has been declining since peaking in 1999, falling to between 30 and 40 by now (Figure II ). 20 In this analysis, traded goods are classified by production process (raw materials, intermediate goods and final goods) with division of production in mind. As the basic data for the analysis, RIETI-TID2013, prepared by the Research Institute of Economy, Trade and Industry under the Ministry of Economy, Trade and Industry, is used. 118
29 Figure II Classification of trade goods by production process Raw materials Intermediate goods Final goods Raw materials Processed products. Iron and steel. Refined oil. Chemical products etc. Consumer goods Goods related to personal consumption:. Pharmaceuticals. Home appliances. Passenger cars etc.. Iron ore. Crude oil. Stone and clay etc. Parts. Machinery parts etc. Capital goods Goods as production capital:. Machine tools. Construction machinery. Trucks. Personal computers etc. Primary products Industrial products in particular Source: METI. 119
 Figure II-1-1-2-8 Changes in shares of trade goods by production process in world trade (export value) Intermediate goods Final goods Source: RIETI-TID 2013 database.")
30 Figure II (Billion dollars) Changes in trade goods by production process in world trade (export value) Raw materials Intermediate goods Final goods Source: RIETI-TID 2013 database. (Year) Figure II Changes in shares of trade goods by production process in world trade (export value) Intermediate goods Final goods Source: RIETI-TID 2013 database. (Year) 120
31 (a) International comparison concerning final goods Regarding the value of final goods exports (consumer goods and capital goods) by major countries/regions 21, the export value in 2013 came to 1,211.3 billion dollars for China, billion dollars for Germany and billion dollars for the United States. In particular, the value of exports by China has increased steeply, expanding by a factor of 22.1 between 1990 and Although the value of exports by Japan continued to grow until 2008, it dropped sharply in 2009 due to the impact of the Collapse of Lehman Brothers. The value of exports by Japan later recovered temporarily, but has been declining again since 2011, falling to billion dollars in 2013 (Figure II ). Figure II Changes in values of final goods export by major export partner and region (Billion dollars) Japan United States ASEAN Germany China ROK Source: RIETI-TID 2013 database. (Year) (b) International comparison concerning intermediate goods As for the value of intermediate goods exports (processed goods and parts) by major countries/regions, the export value in 2013 stood at billion dollars for China, billion dollars for the United States and billion dollars for Germany. In particular, the value of exports by China increased by a factor of 36.2 between 1990 and The trend in intermediate goods exports by Japan was similar to the trend in final goods exports by the country: while the value of intermediate exports continued to grow moderately until 2008, it fell in 2009 because of the impact of 21 Here, major exporting countries/regions refers to Japan, the United States, ASEAN, Germany, China and the Republic of Korea in accordance with the regional classification of RIETI-TID. ASEAN here refers to eight countries Brunei, Cambodia, Indonesia, Malaysia, the Philippines, Singapore, Thailand and Vietnam. However, relevant statistics are unavailable concerning some countries and some years due to data constraints. The same applies to figures based on RIETI-TID data unless otherwise specified. 121
32 the Collapse of Lehman Brothers. Although it temporarily recovered, it has been declining after peaking in 2011, falling to billion dollars in 2013 (Figure II ). Figure II Changes in values of intermediate goods export by major export partner and region (Billion dollars) Japan United States ASEAN Germany China ROK Source: RIETI-TID 2013 database. (Year) (c) Changes in the value of Japanese exports of traded goods by production process and in the value of Japanese exports of traded goods classified by production process and by export destination Regarding the value of Japanese exports of traded goods by production process, processing goods and parts, both of which are categorized as intermediate goods, account for the largest portions of the value, making it clear that intermediate goods are the country s mainstay export goods. As for final goods, although the value of capital goods exports recovered after falling steeply in 2009 due to the impact of the Collapse of Lehman Brothers, it has been declining significantly again since peaking in Likewise, the value of consumer goods exports recovered slightly in 2010 after falling steeply in 2009 but has remained flat since then (Figure II ). 122
33 Figure II Changes in values of Japanese trade goods export by production process (Billion dollars) Raw materials Processed products (intermediate goods) Parts (intermediate goods) Capital goods (final goods) Consumer goods (final goods) Source: RIETI-TID 2013 database. (Year) Next, we will look at changes in the value of Japanese exports of traded goods classified by production process and by export destination. The value of exports of processed goods (intermediate goods) to China increased by a factor of 15.0 (from 3.63 billion dollars to billion dollars) and the value of exports of parts (intermediate goods) to China expanded by a factor of 30.3 (from 1.63 billion dollars to billion dollars) over the same period. As for capital goods (final goods) and consumer goods (final goods), the value of exports to the United States, Japan s biggest export market, is the largest. Since 2000, the values of exports of capital goods and consumer goods to China have been growing. Between 1990 and 2013, the value of exports of capital goods (final goods) to China increased by a factor of 13.3 (from 2.81 billion dollars to 37.4 billion dollars), while the value of exports of consumer goods (final goods) to the country grew by a factor of 18.1 (from 0.6 billion dollars to billion dollars). The higher values of exports of intermediate goods to China and ASEAN than the values of exports of consumer goods thereto indicate that Asia is at the center of Japanese supply chains (Figure II ). 123
34 Figure II Changes in values of Japanese trade goods export by production process and by export destinations [Raw materials (Japan)] (100 million dollars) China ROK ASEAN United States EU28 Source: RIETI-TID 2013 database. (Year) (100 million dollars) [Processed products (Japan)] China ROK ASEAN United States EU28 Source: RIETI-TID 2013 database. (Year) 124
35 (100 million dollars) [Parts (Japan)] China ROK ASEAN United States EU28 Source: RIETI-TID 2013 database. (Year) (100 million dollars) [Capital goods (Japan)] China ROK ASEAN United States EU28 Source: RIETI-TID 2013 database. (Year) 125
36 (100 million dollars) [Consumer goods (Japan)] China ROK ASEAN United States EU28 Source: RIETI-TID 2013 database. (Year) The value of Japanese exports of capital goods has been on a downtrend since peaking 2011, with exports to China, EU28 and the Republic of Korea declining. In particular, exports to EU28 slumped sharply in 2009 because of the impact of the Collapse of Lehman Brothers and have remained sluggish since then without recovering to the level before the collapse of Lehman Brothers. A comparison of exports of final goods (capital goods and consumer goods) by Japan and the United States to EU28 shows that whereas the value of exports by the United States has been increasing, the value of exports by Japan has remained almost flat since the 1990s (Figure II ). Regarding final goods as classified into capital goods and consumer goods, the value of capital goods exports by Japan has remained flat, while the value of consumer goods exports has been declining. In contrast, the values of both capital goods and consumer goods exports by the United States have been increasing. 126
 [Changes in values of final goods exports by Japan to EU28] (100 million dollars) Consumer goods Capital goods Final goods Source: RIETI-TID 2013 database. (Year) 127")
37 Figure II Changes in values of final goods exports by Japan and the United States to (100 million dollars) EU28 Japan United States Source: RIETI-TID 2013 database. (Year) [Changes in values of final goods exports by Japan to EU28] (100 million dollars) Consumer goods Capital goods Final goods Source: RIETI-TID 2013 database. (Year) 127
![[Changes in values of final goods exports by the United States to EU28] (100 million dollars) Consumer goods Capital goods Final goods Source: RIETI-TID 2013 database.](/docs-images/78/77489604/images/38-0.jpg "(Year) Next, we will take a look at major exporting countries exports of traded goods classified by product process.")
38 [Changes in values of final goods exports by the United States to EU28] (100 million dollars) Consumer goods Capital goods Final goods Source: RIETI-TID 2013 database. (Year) Next, we will take a look at major exporting countries exports of traded goods classified by product process. In the case of the United States, the value of exports of intermediate goods (processed goods and parts) is higher than the value of final goods (capital goods and consumer goods) exports. In particular, the value of processed goods (intermediate goods) exports has been on an uptrend since the 2000s. Although the export value temporarily declined in 2009 due to the impact of the Collapse of Lehman Brothers, it resumed growing in The value of parts (intermediate goods) exports accounts for the second largest portion of overall U.S. exports, after the value of processed goods exports. The value of materials exports has also been on an uptrend, as the United States has an edge in exports of such materials as crude oil and natural gas (Figure II ). By export destination, the values of U.S. exports of intermediate goods (processed goods and parts) and final goods (capital goods and consumer goods) to China, ASEAN and EU28 have been increasing. In particular, parts (intermediate foods) exports to China expanded by a factor of 36.7 (from 0.81 billion dollars to billion dollars) between 1990 and 2013 and consumer goods (final goods) exports to the country increased by a factor of 39.1 (from 0.42 billion dollars to billion dollars) (Figure II ). 128
39 Figure II Changes in values of trade goods exports by production process in the United States (100 million dollars) Raw materials Processed products (intermediate goods) Parts (intermediate goods) Capital goods (final goods) Consumer goods (final goods) US main export destination countries (export values in 2014) 1. Canada (31,212.5 billion dollars) 2. Mexico (24,032.6 billion dollars) 3. China (12,402.4 billion dollars) 4. Japan (6,696.4 billion dollars) 5. U.K. (5,386.5 billion dollars) Source: RIETI-TID 2013 database, Global Trade Atlas. (Year) Figure II Changes in values of US trade goods exports by production process and by export destination (100 million dollars) [Raw materials (US)] Japan China ROK ASEAN EU28 Source: RIETI-TID 2013 database. (Year) 129
40 (100 million dollars) [Processed products (US)] Japan China ROK ASEAN EU28 Source: RIETI-TID 2013 database. (Year) (100 million dollars) [Parts (US)] Japan China ROK ASEAN EU28 Source: RIETI-TID 2013 database. (Year) 130
41 (100 million dollars) [Capital goods (US)] Japan China ROK ASEAN EU28 Source: RIETI-TID 2013 database. (Year) [Consumer goods (US)] (100 million dollars) Japan China ROK ASEAN EU28 Source: RIETI-TID 2013 database. (Year) In the case of Germany, the values of exports of most types of traded goods have surpassed and stayed above the level before the collapse of Lehman Brothers. Whereas the value of German exports of raw materials is small as in the case of Japan, the values of German exports of processed goods 131
42 (intermediate goods) and consumer goods (final goods) are large (Figure II ). By export destination, the values of German exports to the United States, the rest of the EU and China have been growing. Parts (intermediate goods) exports to China increased by a factor of 55.2 (from 0.5 billion dollars to billion dollars) between 1990 and 2013, while the value of consumer goods (final goods) exports to the country expanded by a factor of 60.7 (from 0.3 billion dollars to billion dollars) (Figure II ). Figure II Changes in values of Germany's trade goods exports by production process (100 million dollars) Germany s main export Raw materials destination countries (export values in 2014) 1. France (13,449.0 billion dollars) Processed products 2. U.S. (12,743.6 billion dollars) (intermediate goods) 3. U.K. (10,577.5 billion dollars) Parts (intermediate 4. China (9,891.2 billion dollars) goods) 5. Netherlands (9,355.3 billion Capital goods (final dollars) goods) Consumer goods (final goods) Source: RIETI-TID 2013 database, Global Trade Atlas. (Year) 132
43 Figure II Changes in values of Germany's trade goods exports by production process and by export destination [Raw materials (Germany)] (100 million dollars) (100 million dollars) Japan China ROK ASEAN United States EU28 (right scale) Source: RIETI-TID 2013 database. (Year) (100 million dollars) [Processed products (Germany)] (100 million dollars) Japan China ROK ASEAN United States EU28 (right scale) Source: RIETI-TID 2013 database. (Year) 133
44 (100 million dollars) [Parts (Germany)] (100 million dollars) Japan China ROK ASEAN United States EU28 (right scale) Source: RIETI-TID 2013 database. (Year) (100 million dollars) [Capital goods (Germany)] (100 million dollars) Japan China ROK ASEAN United States EU28 (right scale) Source: RIETI-TID 2013 database. (Year) 134
45 (100 million dollars) [Consumer goods (Germany)] (100 million dollars) Japan China ROK ASEAN United States EU28 (right scale) Source: RIETI-TID 2013 database. (Year) As for China, the value of final goods (capital goods and consumer goods) exports has been growing rapidly. Even though the value of exports declined in 2009 due to the impact of the Collapse of Lehman Brothers, it later grew rapidly (Figure II ). By export destination, the value of Chinese exports to ASEAN grew by a factor of (from 0.17 billion dollars to billion dollars) between 1990 and 2013 and the value of exports to Japan expanded by a factor of (from 0.12 billion dollars to billion dollars) over the same period. Chinese exports of capital goods (final goods) to Japan increased by a factor of (from 0.27 billion dollars to billion dollars) between 1990 and 2013, while exports to ASEAN grew by a factor of (from 0.41 billion dollars to billion dollars) over the same period (Figure II ). 135
46 Figure II (100 million dollars) Raw materials Processed products (intermediate goods) Parts (intermediate goods) Capital goods (final goods) Consumer goods (final goods) Changes in values of China's trade goods exports by production process China s main export destination countries (export values in 2014) 1. U.S. (39,606.3 billion dollars) 2. Hong Kong (36,322.3 billion dollars) 3. Japan (14,945.2 billion dollars) 4. ROK (10,040.2 billion dollars) 5. Germany (7,273.1 billion dollars) Source: RIETI-TID 2013 database, Global Trade Atlas. (Year) Figure II Changes in values of China's trade goods exports by production process and by export destination [Raw materials (China)] (100 million dollars) Japan ROK ASEAN United States EU28 Source: RIETI-TID 2013 database. (Year) 136
47 (100 million dollars) [Processed products (China)] Japan ROK ASEAN United States EU28 Source: RIETI-TID 2013 database. (Year) (100 million dollars) [Parts (China)] Japan ROK ASEAN United States EU28 Source: RIETI-TID 2013 database. (Year) 137
48 (100 million dollars) [Capital goods (China)] Japan ROK ASEAN United States EU28 Source: RIETI-TID 2013 database. (Year) (100 million dollars) [Consumer goods (China)] Japan ROK ASEAN United States EU28 Source: RIETI-TID 2013 database. (Year) In the case of ASEAN, the values of exports of processed goods (intermediate goods) and parts (intermediate goods) in particular have increased (Figure II ). 138
49 By export destination, ASEAN s exports of processed goods (intermediate goods) and parts (intermediate goods) have been growing. Exports of processed goods to China increased by a factor of 32.8 (from 1.76 billion dollars to billion dollars) between 1990 and 2013, while exports of parts expanded by a factor of (from 0.22 billion dollars to billion dollars) over the same period. Exports of raw materials to Japan have also been increasing, with the annual value of exports staying above 10 billion dollars since the latter half of the 2000s (Figure II ). Figure II Changes in values of ASEAN trade goods exports by production process (100 million dollars) Raw materials Processed products (intermediate goods) Parts (intermediate goods) Capital goods (final goods) Consumer goods (final goods) Source: RIETI-TID 2013 database. (Year) 139
50 Figure II (100 million dollars) Changes in values of ASEAN trade goods exports by production process and by export destination [Raw materials (ASEAN)] Japan China ROK United States EU28 Source: RIETI-TID 2013 database. (Year) (100 million dollars) [Processed products (ASEAN)] Japan China ROK United States EU28 Source: RIETI-TID 2013 database. (Year) 140
51 (100 million dollars) [Parts (ASEAN)] Japan China ROK United States EU28 Source: RIETI-TID 2013 database. (Year) (100 million dollars) [Capital goods (ASEAN)] Japan China ROK United States EU28 Source: RIETI-TID 2013 database. (Year) 141
52 (100 million dollars) [Consumer goods (ASEAN)] Japan China ROK United States EU28 Source: RIETI-TID 2013 database. (Year) (d) Summary of the trend in world trade and exports by type of goods Amid the stagnant growth in exports by developed countries, emerging countries have led the growth in world trade (export value). In particular, the value of exports by China has grown remarkably. The value of exports by Japan, which is low compared with other countries export values, has been declining after peaking in When we look at world trade (export value) by production process and by type of traded goods, we see that the values of exports of all of final goods, intermediate goods and raw materials have been growing. Whereas the share of intermediate goods in world trade has remained flat since the 1990s, the share of final goods has been on a downtrend since the 2000s. As for changes in major exporting countries exports of traded goods classified by production process, the values of exports of final goods and intermediate foods by China, the United States and Germany have been growing. In the case of Japan, the value of intermediate goods exports is higher than the value of consumer goods exports, indicating that the country mainly supplies intermediate goods with relatively high added value to China and other assembly locations. A breakdown of Japanese exports of traded goods classified by production process indicates that Japan s weakness in exports of final goods compared with other countries is a factor behind the stagnant growth in the value of Japanese exports. While Japan mainly exports intermediate goods, rather than final goods, the United States and Germany have been increasing exports of both intermediate goods and final goods. In the case of Japan in particular, exports of final goods to EU28 have been on a downtrend, an indication that Japanese exports of consumer goods (final goods) have not grown compared with U.S. exports. 142
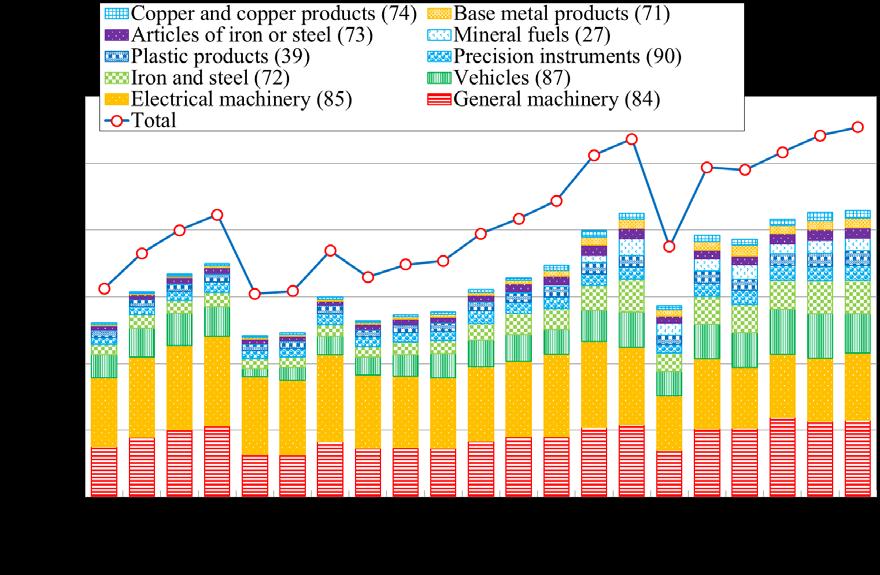
53 Below, we will evaluate Japan s competitiveness in export by comparing the export growth rates for major Japanese industries and examining individual Japanese product items import value shares in countries and regions in order to make clear in which products Japan has an export advantage. (2) Evaluation of Japan s competitiveness in export (A) Japan s main export destinations Japan s main export destinations are the United States and China. Although the United States was previously the largest export destination for Japan, the values of Japanese exports to the United States and China have been almost the same since As the value of Japanese exports to ASEAN10 has been increasing slightly, ASEAN 10 is also an important trading partner as the third major export destination after the United States and China. Japanese exports to EU28 declined after the Collapse of Lehman Brothers, and the value of exports to the region has remained flat without recovering to the level before the collapse of Lehman Brothers (Figure II ). Figure II Japan's main export destination countries (top 6 countries) (Trillion yen) ASEAN10 EU28 United States China ROK Taiwan Source: Global Trade Atlas. (Year) (B) Changes in the values of exports by major Japanese industries Next, we will look at changes in the values of Japanese exports by major industries as classified under Trade Statistics (HS Code). Exports by the motor vehicle, machinery and electrical machinery industries, which are the main drivers of Japanese exports, have been growing steadily. In addition, exports by the chemicals and plastic materials industry have also been increasing gradually, 143
 Vehicles (87) Transportation equipment (86, 88, 89) Electrical machinery (85) General machinery (84) Non-ferrous metal (74-81) Base metal products (82) Articles of iron or")
 5.8 Vehicles (87) 20.6 Electrical machinery (85) 15.1 Other 12.5 Chemicals and plastics (28-40) 13.3 General machinery (84) 19.2 Textiles and clothing (53-63) 1.")
54 accounting for 15 of the overall export value recently (Figure II Figure II (Trillion yen) Changes in Japan's export values by major industry and shares of major industries in 2014 Precision instruments (90) Vehicles (87) Transportation equipment (86, 88, 89) Electrical machinery (85) General machinery (84) Non-ferrous metal (74-81) Base metal products (82) Articles of iron or steel (73) Iron and steel (72) Glass (70) Textiles and clothing (53-63) Chemicals and plastics (28-40) Source: Global Trade Atlas. Transportation equipment (86, 88, 89) 2.8 Precision instruments (90) 5.8 Vehicles (87) 20.6 Electrical machinery (85) 15.1 Other 12.5 Chemicals and plastics (28-40) 13.3 General machinery (84) 19.2 Textiles and clothing (53-63) 1.1 Glass (70) 0.5 (Year) Iron and steel (72) 4.8 Articles of iron or steel (73) 1.9 Non-ferrous metal (74-81) 1.9 Base metal products (82) 0.6 Source: Global Trade Atlas. 22 The figures in parentheses after category names refer to their HS codes. Unless otherwise specified, the figures after category and product names refer to their HS codes hereinafter in this paragraph. 144
55 (C) Japan s major export items in the main export destinations According to the list of Japan s major export items in the main export destinations (the top 10 export items in each of the export destinations) (Figure II ), machinery, electrical machinery, motor vehicles and iron and steel products are among the top export items in Asia, including China, Taiwan, the Republic of Korea and ASEAN. In the United States, which is Japan s largest export market, machinery, electrical machinery, precision instruments as well as transport machinery such as motor vehicles and aircraft are among the top export items. In EU28, similar items, including machinery, electrical machinery, motor vehicles and precision instruments are among the top export items. 145


56 Figure II Japan s major export items in main export destination countries and regions [China] [Taiwan] 146
![[ROK]](/docs-images/78/77489604/images/57-0.jpg "[ASEAN]")
57 [ROK] [ASEAN] 147

![[EU28]](/docs-images/78/77489604/images/58-1.jpg "148")
58 [United States] [EU28] 148
59 (D) Comparison of growth in Japanese and world exports Next, we will compare the growth rates of the values of Japanese and world s exports by major industry using a figure in which the vertical axis represents the growth rate of the world s export value and the horizontal axis represents Japan s export value. The figure makes clear that there is not any industry regarding which Japan s export value has recorded higher growth than the world s export value. By sector 23, the growth rate of Japan s export value is relatively close to that of the world s export value in the materials sector 24 (red bubble). In the machinery sector 25 (blue bubble), while Japan s export value is large, the growth rate, ranging from around minus 2 to plus 2, is lower than the growth rate of the world s export value, which ranges from 4 to 8. In the transport machinery sector 26 (orange bubble), the growth rate of the world s export value ranges from 6 to 8, compared with the range of around 3 to 5 for Japan s export value (Figure II ). Figure II Growth rates of the world's and Japan's export values by major industry [Electrical machinery] [Precision instruments] [Transportation equipment] [Articles of iron or steel] Growth rate of world's export value [Textiles and clothing] [General machinery] [Vehicles] [Glass] [Base metal products] [Iron and steel] [Non-ferrous metal] [Chemical and plastic products] Growth rate of Japan s export value Notes: 1. Figures show geometric mean values of year-on-year changes of the world's export value and Japan s export value from 2000 to The size of a bubble shows the size of Japan s export value as of Source: UN Comtrade. (a) Comparison of growth rates in sub-sectors of the materials sector Next, we will look at the growth rates of Japan s and the world s export value regarding the middle 23 As for the details of individual sectors, refer to the list of analyzed products in individual sectors. 24 The raw materials sector refers to chemicals and plastics (28-40), textiles and clothing (53-63), iron and steel (72) and articles of iron or steel (73) and non-ferrous metals (74-81) (excluding scrap). 25 The machinery sector refers to general machinery (84), electrical machinery (85) and precision instruments (90). 26 The transport equipment sector refers to vehicles (87) and transport equipment (excluding vehicles (86, 88 and 89). 149
60 classification of individual sectors. As for plastic film, etc., Japan s export value has been growing at a higher rate than the world s export value. The growth rate of Japan s export value is close to that of the world s export value regarding iron and steel products, plastic materials and organic monomers, and the absolute level of Japan s export value is large (Figure II ). Growth rate of world export value Figure II Growth rate of sectors related to materials [Rubber and rubber products] [Articles of iron or steel] [Medicines] [Tires (new)] [Cosmetics] [Copper] [Inorganic chemicals] [Organic polymers] [Aluminum] [Man-made fibers] [Nickel] [Products related to paints and coloring materials] [Plastic films, etc.] [Iron and steel] [Glass] [Plastic products] [Organic monomers] [Tools and cutlery of base metal] [Carbon fibers] [Photographic materials] Japan s export value in 2013 Notes: 1. Figures show geometric mean values of year-on-year changes of the world's export value and Japan s export value from 2000 to The size of a bubble shows the size of Japan s export value as of Source: UN Comtrade. 150
61 Table II Intermediate-classification of product items by sector related to materials Middle classification Sectors Product items Chemical and plastic products Inorganic chemicals Organic monomers Medicines Products related to paints and coloring matter Cosmetics Photographic materials Plastic products Organic polymers Plastic films, etc. Rubber and rubber products excluding new tires Tires (new) Textiles and clothing Man-made fibers Carbon fibers Glass Iron and steel Iron and steel Articles of iron or steel Articles of iron or steel Non-ferrous metal Copper Nickel Aluminum Base metal products Tools and cutlery of base metal Exports of cosmetics A breakdown of the value of Japanese exports of cosmetics, which has been growing in recent years, shows that cosmetic foundations, cream cosmetics, etc. account for of overall exports of such products (Figure II ). Asian countries such as Taiwan, Hong Kong and China are the main export destinations (Figure II ). 151
 Powder cosmetics, etc. (330491) Cosmetics for eye make-up, etc. (330420) Cosmetic foundations, cream cosmetics, etc.")
 Figure II-1-1-2-29 Japan's main export destinations of cosmetics (top 5 countries) (Billion yen) Singapore ROK China Hong Kong Taiwan Total (world) Source: Global")
62 Figure II Changes in Japan's export values of cosmetics by product item (Billion yen) Manicures, etc. (330430) Cosmetics for lip make-up, etc. (330410) Powder cosmetics, etc. (330491) Cosmetics for eye make-up, etc. (330420) Cosmetic foundations, cream cosmetics, etc. (330499) Cosmetics (3304) Source: Global Trade Atlas. (Year) Figure II Japan's main export destinations of cosmetics (top 5 countries) (Billion yen) Singapore ROK China Hong Kong Taiwan Total (world) Source: Global Trade Atlas. (Year) (b) Comparison of growth rates in subsectors of the machinery sector Regarding the middle classification of the machinery sector, there is no product item for which 152
63 Japan s export value has been growing at a higher rate than the world s export value. However, both Japanese exports and world exports are growing with regard to printing machinery, bulldozers and electronic equipment for internal combustion engines. Japanese exports of machinery and machinery parts are growing in line with world demand as Japan s technological excellence concerning these products has a worldwide reputation (Figure II ). Figure II Growth rate of the machinery sector Growth rate of world export value [Ball bearings] [Optical microscopes] [Semiconductor devices] [Integrated circuits] [Semiconductor -manufacturing apparatus] [Condensers] [Transmission apparatus for radio-broadcasting or television, etc.] [Machine tools] [Medical equipment] [Gearboxes] [Cocks and valves] [Bulldozers] [Printing machines] [Electronic machinery for internal-combustion engines] [Electric furnaces for industrial and physical and chemical use] [Switches, etc.] [Testing and measuring Growth rate of Japan's export value instruments] Notes: 1. Figures show geometric mean values of year-on-year changes of the world's export value and Japan s export value from 2000 to The bubble for semiconductor-manufacturing apparatus represents geometric mean values from 2008 to The size of a bubble shows the size of Japan s export value as of Source: UN Comtrade. 153
64 Table II Intermediate-classification of product items in the machinery sector Middle classification Sectors Product items Bulldozers Printing machines Machine tool General machinery Cocks and valves Ball bearings Gearboxes Semiconductor-manufacturing apparatus Electronic machinery for internal-combustion engines Electric furnaces for industrial and physical and chemical use Transmission apparatus for radio-broadcasting or television, etc. Electrical machinery Condensers Switches, etc. (for switching of electrical circuits) Semiconductor devices Integrated circuits Optical microscopes Precision instruments Medical equipment Testing and measuring instruments (electronic, electric and industrial) (c) Growth rates in subsectors of the transport equipment sector Regarding the transport machinery sector, although the values of Japan s exports of buses and vessel parts as well as aircraft parts, for which demand is expected to expand mainly in the United States and the EU are small, they have been growing at a higher rate than the world s export values. Meanwhile, although the values of Japan s exports of passenger cars and motor vehicles parts are large, they have been growing at a lower rate than the world s export values (Figure II ). 154
65 Figure II Growth rate of the transport equipment sector Growth rate of world export value [Marine vessels] [Bicycle parts] [Passenger cars] [Tractors] [Railway parts] [Motor vehicle parts] [Cargo motor cars] [Marine vessel parts] [Buses] [Aircraft parts] Growth rate of Japan's export value Notes: 1. Bubbles show geometric mean values of year-on-year changes of the world's export value and Japan s export value from 2000 to The size of a bubble shows the size of Japan s export value as of Source: UN Comtrade. Table II Intermediate-classification of product items in the transport equipment Sectors Vehicles Transport equipment excluding vehicles sector Middle classification Product items Tractors Buses Passenger cars Cargo motor cars Motor vehicle parts Bicycle parts Railway parts Aircraft parts Marine vessels Marine vessel parts Exports of aircraft parts The value of Japanese exports of aircraft parts was billion yen in 2014, with exports of aircraft parts and aircraft engine parts on an uptrend. Between 2005 and 2014, the value of exports of aircraft parts increased by a factor of 3.6, while the value of exports of aircraft engine parts doubled (Figure II ). As for the main export destinations, exports to the United States account 155
 Figure II-1-1-2-34 Changes in Japan export values of aircraft parts Aircraft engine parts Aircraft engines (840710) Aircraft")

66 for around 80 of overall exports of such parts (Figure II ). (Billion yen) Figure II Changes in Japan export values of aircraft parts Aircraft engine parts Aircraft engines (840710) Aircraft parts (8803) Total (Year) Notes: Total values of the aircraft engine parts are the sum of , , , , , , and Source: Global Trade Atlas. Figure II Japan's main export destinations of aircraft parts (top 3 countries) (Billion yen) United Kingdom Germany United States Total Source: Global Trade Atlas. (Year) 156
67 (E) Japan s import shares in countries/regions (import value share) Japan s shares of imports in its main export destination countries/regions in terms of value (import value share) have been declining. In 2014, Japan s import value share in Taiwan was 15.3, larger than in any other country. Other countries/regions where Japan s import value share was large are Asian countries such as the Republic of Korea (10.2), ASEAN5 (9.0) and China (8.3). Japan s import value share in the United States, which is Japan s largest export market, was 5.7 (Figure II ). Figure II Shares of Japan's import values in countries and regions - import value shares- United States ROK EU28 China Taiwan ASEAN5 Notes: 1. Figures for EU28 show data in and after Japan s import values in countries and regions / World import values in countries and regions Source: Global Trade Atlas. (Year) (a) Import value share in the materials sector Next, we will look at Japanese products import value shares in countries/regions, mainly regarding the small classification of individual sectors (individual product items) 27 (the average between 2011 and ). Concerning the materials sector, many Japanese products have large import shares in the Republic of Korea. In particular, among Japanese plastics products, plastic film, 27 As for the small classification of individual sectors, refer to the list of analyzed products in the supplementary note. 28 Although Japanese exports slumped in 2009 due to the impact of the Collapse of Lehman Brothers, they temporarily recovered in However, as Japanese exports dropped again in 2011 due to the impact of the Great East Japan Earthquake, the import value share here is the average between 2011 and

68 etc. has a 75 share in the Republic of Korea, with polyethylene terephthalate, a product item in the plastic film, etc. category, holding an extremely large share, 81. Japanese paints, ink and daily necessities like pruning shears and saws also have import value shares of more than 50 in the Republic of Korea and Taiwan. The daily necessities industry generally continues to face a severe situation due to changes in consumers lifestyles and purchase consciousness and increased low-priced imports from Asian countries. However, the data indicates that superior Japanese products have a high reputation, mainly in the Republic of Korea, Taiwan and China 29 (Figure II ). Figure II Shares of Japan's import values in countries and regions - materials sector- (average between 2011 and 2014) EU28 United States China Taiwan ROK ASEAN5 Iodine Liquid luster, etc. Paints Ink Cosmetics Some rolled photographic film Developed photographic film Chemical preparations for photographic uses Materials of electronic parts Organic polymers Acrylic polymers Petroleum resin, etc. Plastic film, etc. Polyethylene terephthalate Tires Carbon fibers Flat rolled products of steel or non-alloyed steel (of a width of 600 mm or more) Flat rolled products of other non-alloyed steel (of a width of 600 mm or more) Iron or steel pipes and those with hollow profiles Refined copper Nickel alloy Pruning shears Saws Interchangeable tools for hand tools or machine tools Kitchen knives/knives Notes: Figures show the arithmetic average of the total shares (=Japan s import values in countries and regions / world import values in countries and regions) between 2011 to Source: Global Trade Atlas. (b) Import value share in the machinery sector As for the import value share in the machinery sector, bulldozers, industrial robots and machining centers, etc. for metal processing 30 imported from Japan hold shares of more than 50 in many countries/regions. 29 Both volume and price are increasing. As for the details. Refer to Part II, Chapter 1. Section Competitiveness in export by product. 30 Machining centers, etc. for metal processing are machines capable of automated metal processing. 158
69 Regarding industrial robots, it is expected that because of the advance of robot technology, the range of applications will expand to include work processes in clean rooms of pharmaceuticals factories and more sophisticated processes in automobile factories, including welding and handling work. Machining centers, etc. for metal processing is a major product item in the machine tool category, as such machinery enables stable production of high-quality products through numerically controlled automated operation. Japanese exports of such machinery products are expected to increase further thanks to the expansion of demand due to advanced research conducted in developed countries and the growth of emerging countries, mainly in Asia. Regarding polarizing sheets, which is a product item in the precision instrumentation category, Japan has import value shares of more than 80 in the United States (87.5) and the Republic of Korea (81.3), and regarding optical microscopes, Japan s import value share is around 50 in Asian countries, including Taiwan (49.6) and the Republic of Korea (46.3) (Figure II ). Figure II Shares of Japan's import values in countries and regions - machinery sector- (average between 2011 and 2014) EU28 United States China Taiwan ROK ASEAN5 Bulldozers Printing machines Processing machines using lasers, etc. Machining centers for metal processing, etc. Processing machines (grinding machines, etc.) Injection-molding machines for lubber and plastic Industrial robots Cocks and valves Ball bearings Gearboxes Semiconductor-manufacturin g apparatus Electronic machinery for internal-combustion engines Electric machines for industrial and physical and chemical use Transmission apparatus for radiobroadcasting or television, etc. Car navigation systems Condensers Switches, etc. (for switching of electrical circuits) Semiconductor devices Integrated circuits General machinery Electric machinery Notes: Figures show the arithmetic average of the total shares (= Japan s import values in countries and regions / world import values in countries and regions) between 2011 to Source: Global Trade Atlas. 159
70 EU28 United States China Taiwan ROK ASEAN5 Optical fibers Polarizing material sheets Optical microscopes Liquid crystal devices Ultrasonic scanning apparatus Medical sample testing instruments Endoscopes X-ray computer tomography apparatus X-ray apparatus for diagnostic use Devices for measuring semiconductors and ICs Product items listed on the APEC environmental goods Product items listed on the Information Technology Agreement (ITA) products Precision instruments Medical equipment Others Notes: Figures show the arithmetic average of the total shares (= Japan s import values in countries and regions / world import values in countries and regions) between 2011 to Source: Global Trade Atlas. (c) Import value share in the transport machinery sector In the transport machinery sector, Japan has large import value shares in Taiwan with regard to buses (84.4), railway vehicle parts (83.3), vessel parts (55.6), vessels (48.8) and motor vehicle parts (46.1). In ASEAN5, Japan has large import value shares concerning buses (52.4), motor vehicle parts (46.4) and vessel parts (42.6). Regarding the transport machinery sector, Japan exports transportation infrastructure-related items, such as buses, railway vehicle parts, vessel parts and road vehicle-related items, such as motor vehicles parts and cargo motor cars, mainly to Asian countries, capturing large import value shares there (Figure II ). 160
71 Figure II Shares of Japan's import values in countries and regions -transport equipment sector- (average between 2011 and 2014) EU28 United States China Taiwan ROK ASEAN5 Railway parts Tractors Buses Passenger cars Cargo motor cars Motor vehicle parts Notes: Figures show the arithmetic average of the total import shares (= Japan s import values in countries and regions / world import values in countries and regions) between 2011 to Source: Global Trade Atlas. Bicycle parts Aircraft parts Marine vessels Marine vessel parts (d) Import value shares in other sectors In other sectors, Japan holds import value shares of more than 50 concerning sanitary products in China (57.7) and Taiwan (57.8). Meanwhile, ballpoint pens, etc. imported from Japan have become increasingly popular in the United States and Europe in recent years, as products with multiple functions and resourceful ideas are stimulating consumers buying appetite (Figure II ). 161
72 Figure II Shares of Japan's import values in countries and regions -other sectors- (average between 2011 and 2014) EU28 United States China Taiwan ROK ASEAN5 Ball-point pens, etc. Pencils/crayons, etc. Typewriter ribbons, Sanitary products etc. (diapers, etc.) Notes: 1. Figures show the arithmetic average of the total import value shares (= Japan s import values in countries and regions / world import values in countries and regions) between 2011 to Figures for sanitary products show the average value between 2012 and Figures for sanitary products in Taiwan show the average value between 2013 and Source: Global Trade Atlas. (F) Summary of growth rates and import value shares (a) Materials sector In the materials sector, Japan s export value has been growing at a higher rate than the world s export value with regard to photographic materials 31 and plastic film, etc. Regarding plastic film, etc, Japan has large import value shares in Taiwan (68.4) and the Republic of Korea (74.4), with its share concerning polyethylene terephthalate, an individual product item in the plastic film, etc. category, reaching as high as 81.6 in the Republic of Korea. Japan also holds large import value shares in Asian countries, including China, Taiwan and the Republic of Korea, concerning pruning shears and saws, which are product items in the manual tools, blades, etc. made of base metal category (Table II ). 31 As for the import value share concerning major export products in the photographic materials category, Japan has a share of more than 50 concerning chemical preparations for photographic uses in all markets except for ASEAN5 and it also has a share of more than 50 concerning developed photographic film in Taiwan and the Republic of Korea. However, the market for photographic materials is shrinking as a trend due to the advance of digitization. 162
73 Sectors Chemical and plastic products Textiles and clothing material sector Middle classification Table II Overview of the materials sector Growth rate of export value (average between 2000 and 2013) Small classification Shares of Japan s import values in countries and regions (import value shares) ( ) Reference: Export value (in the world) (billion dollars) Product items World Japan Individual product items EU28 United States China Taiwan ROK ASEAN Inorganic chemicals Iodine Organic monomers Medicines Products related to Liquid luster, 50.3 paints and etc coloring matter Paints Ink Cosmetics Photographic materials Some rolled photographic film Developed photographic 39.9 film Chemical preparations for 68.5 photographic use Chemicals for materials 30.7 of electronic parts Plastic products Organic polymers Acrylic 26.9 polymers Petroleum 10.6 resin, etc Plastic films, etc Polyethylene terephthalate Rubber and rubber products excluding new tires Tires (new) Man-made fibers Carbon fibers Glass Glass Iron and Iron and steel
74 steel Articles of iron or steel Non-ferrous metal Base metal products Notes: Articles of iron or steel Flat rolled products of steel or non-alloyed steel (of a width of 600 mm or more) Flat rolled products of other non-alloyed steel (of a width of 600 mm or more) Iron and steel pipes and those with 18.4 hollow profiles Copper Refined copper Nickel Nickel alloy pipes and 12.9 pipe joints Aluminum Tools and cutlery of Pruning base metal shears Saws Interchangea ble tools for hand tools or machine tools Kitchen knives and knives Colored product items show that Japan s growth rate is larger than the world growth rate Colored product items show that the shares of the items account for more than 50 in the sector of the country and region. 3. Reference: The scale of the export values (in the world) is equivalent to the size of bubbles shown in Figure II , excluding those having excluded items. (b) Machinery sector In the machinery sector, although the growth rate of Japan s export value is not higher than that of the world export value concerning any product item, the growth gap is only around 1 percentage point with regard to bulldozers and printing machines. As for the import value share, Japan has large shares in most countries and regions excluding the Republic of Korea and ASEAN5 with regard to bulldozers, with its share in Taiwan particularly high at Concerning rubber and plastics injection molding machines and industrial robots, Japan has import value shares of around 50 to 70 mainly in Asian countries. Regarding machining centers, etc, for metal processing, which is a product item in the machine tool category, Japan holds 164
75 large import value shares in most countries/regions excluding EU28, with its share in Taiwan particularly high at With regard to polarizing sheets, which is a product item in the precision instrument category, Japan s import value share is higher than 80 in the United States (87.5) and the Republic of Korea (81.3) and is also high in Taiwan (53.8). Concerning optical microscopes, Japan has large import value shares, mainly in Asia, including Taiwan (49.6) and the Republic of Korea (46.3) (Table II ). Machinery sector Middle classification Table II Overview of the machinery sector Growth rate of export value (average between 2000 and 2013) Sectors Product items World Japan General machinery Electrical machinery Bulldozers Printing machines Small classification Individual product items Bulldozers Printing machines Injection-molding machines for rubber and plastic Industrial robots Processing machines using lasers, etc. Machining centers for Machine tool metal processing, etc. Cocks and valves Ball bearings Gearboxes Semiconductormanufacturing apparatus Electronic machinery for internal-combust ion engines Electric furnaces for industrial and physical and chemical use Processing machines (grinding machines, etc.) Cocks and valves Ball bearings Gearboxes Semiconductor -manufacturing apparatus Lithium ion storage batteries Electronic machinery for internal-combu stion engines Electric furnaces for industrial and physical and chemical use 165 Shares of Japan s import values in countries and regions (import value shares) ( ) Reference: Export value (in the world) (billion dollars) EU United 28 States China Taiwan ROK AN5 ASE Wireless base 2.4 stations* Transmission Transmission
76 Precision instruments apparatus for radio-broadcasting or television, etc. apparatus for radio-broadcas ting or television, etc. Car navigation systems -1.5 Condensers Condensers Switches, etc. Switches, etc. (or switching of electrical (or switching 9.2 of electrical circuits) circuits) Semiconductor devices Semiconductor 7.0 devices Integrated circuits Integrated 9.3 circuits Optical fibers Polarizing 20. material sheets Optical microscopes Optical 23. microscopes Liquid crystal 11. devices** Medical equipment Ultrasonic scanning 18. apparatus Testing and measuring instruments (electronic, electric and industrial) Notes Medical sample testing instruments Endoscopes X-ray computer tomography apparatus X-ray apparatus for diagnostic use Devices for measuring semiconductors and ICs* Product items listed on the APEC environmental goods Product items listed on the Information Technology Agreement (ITA) products Product items with three asterisks *** are the items listed both on the APEC environmental goods and the Information Technology Agreement (ITA) items. 166
77 2. Product items with one asterisk * are the items listed on the ITA products. 3. Figures for lithium ion batteries show the average values between 2012 and 2014 (for Taiwan only the average between 2013 and 2014). 4. Colored product items show that Japan s growth rate is larger than the world growth rate. 5. Colored product items show that the shares of the items account for more than 50 in the sector of country and region. 6. Reference: The scale of the export values (in the world) is equivalent to the size of bubbles shown in Figure II (c) Transport machinery sector In the transport machinery sector, Japan s export value has been growing at a higher rate than the world s export value with regard to buses, aircraft parts and vessel parts. As for the import value share, Japan has large shares in Taiwan (84.4) and ASEAN5 (52.4) concerning buses. With regard to aircraft parts, Japan s import value share is highest in the United States (17.2). In Taiwan, Japan also holds large import value shares concerning railway vehicle parts (83.3) and vessel parts (55.6) (Table II ). 167
78 Transport equipment sector Sectors Middle level classification (Detailed classification) Table II Overview of the transport equipment sector Growth rate of export value (average between 2000 and 2013) Product items World Japan EU28 United States 15.8 Tractors Shares of Japan s import values in countries and regions (import value shares) ( ) China Taiwan ROK ASE AN Reference: Export value (in the world) (billion dollars) Buses Vehicles Passenger cars Cargo motor cars Motor vehicle parts Bicycle parts Railway parts Transport Aircraft parts equipment Marine vessels Marine vessel parts Notes 1. Colored product items show that Japan s growth rate is larger than the world growth rate. 2. Colored product items show that the shares of the items account for more than 50 in the sector of country and region. 3. In the transport equipment sector, product items covered by the middle level classification are the same as those covered by the small classification. 4. Reference: The scale of the export values (in the world) is equivalent to the size of bubbles shown in Figure II
79 material sector Sectors Chemical and plastic products Textiles and clothing Iron and steel Table II HS codes Middle level classification List of analyzed products in the materials sector 169 Detailed classification Product items HS codes Individual product items HS codes Inorganic chemicals 28 Iodine Organic monomers 29 Medicines 30 Products related to paints and coloring matter, excluding paints 32 (excluding ) Liquid luster, etc Paints Ink 3215 Cosmetics 3304 Cosmetics 3304 Some rolled photographic film Photographic materials 37 Developed photographic film 3705 Chemical preparations for photographic uses 3707 Chemicals for materials of electronic parts 3818 Plastic products 39 Organic polymers Organic polymers Acrylic polymers 3906 Petroleum resin, etc Plastic film, etc Plastic film, etc Polyethylene terephthalate Rubber and rubber products excluding new tires 40 (excluding 4011) Tires (new) 4011 Tires (new) Man-made fibers Carbon fibers 6815 Carbon fibers 6815 Glass 70 Glass 70 Flat rolled products of steel or non-alloyed steel (of a 7208 width of 600 mm or more) Articles of iron or steel Non-ferrous metal, excluding scraps* Base metal products 72 Iron and steel, excluding scraps 72 (excluding 7204) 73 Articles of iron or steel Copper, excluding scraps Nickel, excluding scraps Aluminum, excluding scraps Tools and cutlery of base metal, excluding scraps 74, (excluding 7404) 75 (excluding 7503) 76 (excluding 7602) 82 (excluding 8207) Flat rolled products of other non-alloyed steel (of a width of 600 mm or more) Iron and steel pipes and those with hollow profiles Refined copper 7403 Nickel alloy pipes and pipe joints Pruning shears Saws 8202
80 Interchangeable tools for 8207 hand tools or machine tools Kitchen knives and knives 8211 Note: In this list, scraps* include: 7802, 7902, 8002, , , , , , , , , , , and
81 Machinery sector Sectors General machinery Electrical machinery Precision instruments Table II HS codes List of analyzed products in the machinery sector Middle level classification 171 Detailed classification Product items HS codes Individual product items HS codes Bulldozers 8429 Printing machines 8443 Processing machines using lasers, etc (Machine tools Machining centers for metal ) processing, etc Processing machines (grinding machines, etc.) 8460 Injection-molding machines for rubber and plastic Industrial robots Cocks and valves 8481 Ball bearings 8482 Gearboxes 8483 Semiconductor-manufactu ring apparatus Electronic machinery for internal-combustion engines Electric furnaces for industrial and physical and chemical use Transmission apparatus for radio-broadcasting or television, etc Condensers 8532 Switches, etc. (or switching of electrical 8536 circuits) Semiconductor devices 8541 Integrated circuits 8542 Optical microscopes 9011 Medical equipment Lithium ion storage batteries Wireless base stations * Car navigation systems Optical fibers Polarizing material sheets Liquid crystal devices ** * Ultrasonic scanning apparatus Medical sample testing instruments Endoscopes X-ray computer tomography apparatus
82 Testing and measuring instruments (electronic, electric and industrial) X-ray apparatus for diagnostic use Devices for measuring semiconductors and ICs Product items listed on the APEC environmental goods Product items listed on the Information Technology Agreement (ITA) products Notes: * * 1. Product items with three asterisks *** are the items listed both on the APEC environmental goods and the Information Technology Agreement (ITA) products. 2. Product Items with one asterisk * are the items listed on the ITA products. 172
83 Table II Transport equipment sector List of analyzed products in the transport equipment sector Middle level classification (Detailed classification) Sectors HS codes Product items HS codes Tractors 8701 Buses 8702 Passenger cars 8703 Cargo motor cars 8704 Vehicles 87 Motor vehicle parts Transport equipment excluding vehicles 86, 88, 89 Bicycle parts Railway parts Aircraft parts (Marine vessels 89) Marine vessel parts Note: In the transport equipment sector, product items covered by the middle level classification are the same as those covered by the detailed classification. (excluding floater, excluding 8907, 8918) Table II List of analyzed products in other sectors Product items HS codes Stationery goods Ball-point pens, etc Pencils/crayons, etc Other products Ink cartridges, etc Sanitary products (diapers, etc.)

84 Column 2 Export trend concerning agricultural, forestry and fishery products (1) Export trend concerning Japanese agricultural, forestry and fishery products (A) Changes in the export values of agricultural, forestry and fishery products At a time when the domestic market for Japanese agricultural, forestry and fishery products and foods is expected to shrink amid the ongoing aging of society coupled with the low birth rate, the government aims to expand sales of such products in overseas markets by setting the goal of increasing the value of exports of agricultural, forestry and fishery products and foods to 1 trillion yen by 2020 as a pillar of the Japan Revitalization Strategy. The export value of Japan s agricultural, forestry and fishery products and foods has been on an uptrend in recent years, increasing from billion yen in 2012 to billion yen in Of the total value, agricultural products account for billion yen, more than half, followed by fishery products with billion yen and forestry products with 21.1 billion yen (Column Figure 2-1). The export value of Japanese agricultural, forestry and fishery products and foods has been growing on the tailwind of the registration of traditional Japanese cuisine on the UNESCO Intangible Cultural Heritage list and the Japanese food boom abroad. Therefore, we will examine the export trend concerning Japanese agricultural, forestry and fishery products in this column. Column Figure 2-1 Changes in Japan's export values of agricultural, forestry and fishery products (100 million dollars) Fishery Products Forestry products Agricultural products Agricultural, forestry, and fishery products Source: Overview of Foreign Trade of Agricultural, Forestry, and Fishery Products 2014: Established values (MAFF). (Year) (B) Main export destinations for Japanese agricultural, forestry and fishery products and the export value of major export products (a) Export values concerning major export destinations (top 10 export destinations) 174
.")
85 For Japanese agricultural, forestry and fishery products, Hong Kong is the largest export destination, with the value of Japanese exports to the region at billion yen (accounting for 22 of overall exports of agricultural, forestry and fishery products). Also among the top export destinations are the United States and Asian countries/regions, including Taiwan and China (Figure Column 2-2). In particular, in Hong Kong, which is the largest export market for Japan, Japanese agricultural, forestry and fishery products have been consistently popular as Japanese foods have a reputation for being safe and delicious 32. Column Figure 2-2 Japan's main export destination countries of agricultural, forestry and fishery products (top 10 countries) [Canada] 7.4 billion yen (1.2) [Australia] 9.4 billion yen (1.5) [Singapore] 18.9 billion yen (3.1) [Vietnam] 29.2 billion yen (5.7) [Thailand] 34.8 billion yen (5.7) [Others in total] 97.7 billion yen (15.9) Total export value of agricultural, forestry, and fishery products in billion yen [Hong Kong] billion yen (22) [United States] 93.2 billion yen (15.2) [ROK] 40.9 billion yen (6.7) [China] 62.2 billion yen (10.2) [Taiwan] 83.7 billion yen (13.7) Source: Overview of Foreign Trade of Agricultural, Forestry, and Fishery Products 2014: Established values (MAFF). (b) Export values concerning major export products (the top 15 product) A breakdown of major Japanese export items among agricultural, forestry and fishery products shows that scallops, alcoholic beverage, pearls and sauce-based seasonings are among the top export items (Column Figure 2-3). In particular, the value of scallop exports is large, with the United States (31.4), China (29.9) and Vietnam (15.2) as the main export destinations Factors behind Japanese foods popularity in Hong Kong include the absence of tariffs on food imports there, the relatively few restrictions on imports compared with other countries, an environment that is willing to accept foreign culinary cultures and the presence of a relatively large number of Japanese nationals as consumers of Japanese foods. According to the Annual Report of Statistics on Japanese Nationals Overseas (Summary 2014) (Ministry of Foreign Affairs), the number of Japanese nationals living in Hong Kong is 25,000, while the number of Japanese companies with business footholds there is Although scallops are mainly eaten raw in Japan as sashimi or sushi, they are primarily grilled or used as 175
![Column Figure 2-3 [Scallops] 4.47 billion yen Total export value of agricultural, forestry, and fishery products in 2014 611.7 billion yen [Others in total] 347.8 billion yen [Apples] 8.](/docs-images/78/77489604/images/86-0.jpg "6 billion yen Japan's major export items among agricultural, forestry and fishery products in 2014 (top 15 items) [Alcoholic beverages] 29.4 billion yen [Dried sea cucumbers] 10.")
86 Column Figure 2-3 [Scallops] 4.47 billion yen Total export value of agricultural, forestry, and fishery products in billion yen [Others in total] billion yen [Apples] 8.6 billion yen Japan's major export items among agricultural, forestry and fishery products in 2014 (top 15 items) [Alcoholic beverages] 29.4 billion yen [Dried sea cucumbers] 10.4 billion yen [Yellowtails (fresh, chilled, frozen)] 1 billion yen [Pearls (wild, cultured)] 24.5 billion yen [Sauce-based seasonings] 23.0 billion yen [Tobacco] 19.5 billion yen Source: Overview of Foreign Trade of Agricultural, Forestry, and Fishery Products 2014: Established values (MAFF). [Refreshing beverages] 15.9 billion yen [Bonitos/tunas] 15.8 billion yen [Confectionery, excluding rice confectionery] 14.8 billion yen [Sowing seeds, etc.] 12.8 billion yen [Pig skins (raw skins)] 11.6 billion yen [Mackerels (fresh, chilled, frozen)] 11.5 billion yen [Salmons/trouts (fresh, chilled, frozen)] 11.4 billion yen (2) World market demand for Japanese foods (A) Processed foods as a driver of exports of Japanese agricultural products amid the Japanese food boom Processed foods (seasonings, alcoholic beverages, etc.), which account for the largest portion, around 50 (in 2014), of the value of overall agricultural product exports, has been leading exports of Japanese agricultural products on the back of the Japanese food boom 34 abroad in recent years. In particular, the export value of seasonings has grown from billion yen in 2012 to billion yen in Since 2012, sauce-based seasonings and soy sauce has led the export growth, with the export value increasing from billion yen (2012) to billion yen (2014) for the former and from 3.67 billion yen to 5.18 billion yen for the latter (Column Figure 2-4). ingredients in such heated dishes as clam chowder in the United States. In China, scallops are treasured as delicacies along with shark fin and dried abalone. In addition, scallops are food items not subject to religious constraints as exemplified by the halal requirement under Islam. As a result, scallops are called global food, with demand growing in various countries. 34 According to the results of the estimation made by the Ministry of Agriculture, Forestry and Fisheries with cooperation from the Ministry of Foreign Affairs and Japanese diplomatic missions abroad ( Popularity of Japanese Foods and Food Culture Abroad (June 2013) ( the number of Japanese food restaurants abroad increased from 24,000 in 2006 to around 55,000 in March
 (B) Rice and processed rice products as Japanese specialty Concerning rice and processed rice products, which is Japan s mainstay agricultural product item, the export value of processed rice")
87 (100 million yen) Column Figure 2-4 Changes in export values of seasonings Soy sauce ( ) Miso paste ( ) Sauce-based seasonings ( ) Seasonings (2103) Source: Global Trade Atlas. (Year) (B) Rice and processed rice products as Japanese specialty Concerning rice and processed rice products, which is Japan s mainstay agricultural product item, the export value of processed rice products (rice confectionery and sake) is growing more than the export value of rice (Column Figure 2-5). 177

88 Column Figure 2-5 (100 million yen) Changes in Japan's export values of rice and processed rice products Rice (1006) Rice confectionery ( ) Sake rice wine (refined sake) ( ) Source: Global Trade Atlas. (Year) (C) Main export destinations for sake rice wine The main export destinations for sake rice wine (refined sake), exports of which have risen to a record high, are the United States with an export value of 4.13 billion yen, Hong Kong with 1.83 billion yen and the Republic of Korea with 1.31 billion yen (Column Figure 2-6). 178

89 Column Figure 2-6 Export values of sake rice wine (refined sake) and main export destinations (D) Growing reputation of the quality of Japan s agricultural products As Japanese vegetables and fruits have a high reputation for their good quality in terms of safety, demand from wealthy people abroad is growing. The export value of Japanese fruits and vegetables in 2014 was 24.3 billion yen, accounting for 6.8 of overall exports of agricultural products. (a) Vegetable exports The export value of Japanese vegetables rose from 2.73 billion yen in 2012 to 4.26 billion yen in Of the export value, yams accounted for 2.81 billion yen, followed by mushrooms with 0.85 billion yen and dried vegetables with 0.34 billion yen. The main export destinations for Japanese vegetables are Taiwan, which took 45 of vegetables exported from Japan, followed by the United States with 22 and Hong Kong with 15 (Colum Figures 2-7 and 2-8). In particular, yams produced in Japan are used in Taiwan as ingredients in medicinal cuisine and Chinese drugs. 179


90 Column Figure 2-7 Changes in Japan's export values of vegetables Column Figure 2-8 Japan's main export destinations of vegetables Thailand, 2 Viet Nam, 2 Malaysia, 2 Others, 2 Singapore, 11 Hong Kong, 15 Total export value in billion yen Taiwan, 45 United States, 22 Source: Global Trade Atlas. 180
.")
91 (b) Fruits exports The export value of Japanese fruits increased steeply from 5.88 billion yen in 2012 to billion yen in Apples accounted for nearly 70 (69.4) of overall fruits exports. The main export destinations for Japanese fruits are Taiwan, which took 61 of vegetables exported from Japan, followed by Hong Kong with 24 and China with 5 (Column Figures 2-9 and 2-10). Column Figure 2-9 Changes in Japan's export values of fruits Apples, pears (0808) (100 million yen) Grapes including dried products (0806) Peaches (0809) Citrus fruits (0805) Strawberries, persimmons (0810) Fruits (08) Source: Global Trade Atlas. (Year) 181
92 Column Figure 2-10 Japan's main export destinations of fruits Singapore,1 Others, 2 Canada, 3 China, 5 Thailand, 3 Hong Kong, 25 Total export value in billion yen Taiwan, 61 Source: Global Trade Atlas. (3) Summary Exports of Japanese agricultural products have been growing year after year, with the United States and Asian countries such as Hong Kong, Taiwan and China as the main export destinations. In particular, markets for Japanese foods have been well established in Hong Kong and Taiwan, and they are attractive export markets. In addition, exports of sake rice wine to the United States have been increasing due to the Japanese food boom there. Japan s agricultural products have a high reputation for their quality in terms of deliciousness and safety, with fruits in particular consistently popular among wealthy people in Asian countries. If Japan is to increase the export value of agricultural, forestry and fishery products in the future, expanding consumption also among the middle class will be a challenge. To deal with the challenges Japan faces in expanding exports, the Ministry of Agriculture, Forestry and Fisheries (MAFF) formulated and announced the Comprehensive Export Strategy for Japan s Agricultural, Forestry and Fishery Products and Foods in August Moreover, in June 2014, the MAFF established the Export Strategy Executive Committee in order to review measures based on the strategy and hold discussions about the system for the whole of Japan, including the public and private sectors, to implement effective measures to expand exports, thereby promoting cooperation between producing regions and initiatives to establish the Japan Brand. Meanwhile, many countries/regions have imposed import restrictions on Japanese agricultural, forestry and fishery products and foods in recent years following the accident at Tokyo Electric Power Company s Fukushima Daiichi Nuclear Power Station. Japanese government ministries and agencies are working together to persuade the countries/regions to relax and remove the restrictions by 182
93 providing scientific data The Ministry of Agriculture, Forestry and Fisheries (2015) 183
94 3. Competitiveness in export by product item So far, we have looked at the trends concerning Japan s and the world s major export products. However, we can identify Japanese manufacturing industries competitiveness in export more specifically by examining in detail the state of products classified in more detail (export value, price, volume and these growth) in addition to looking at the overall export value. Therefore, we will take a look mainly at Japan s export trend concerning products classified by the six-digit HS coding system, which is the most detailed tariff number classification system that enables international comparison. (1) Products with growing export value (international comparison) First, we will conduct comparison between major countries in terms of the share of six-digit HS code items with growing export value (six-digit HS code items shall be hereinafter referred to as items ) in their overall export value. The major countries discussed here are the United States, the United Kingdom, Germany, France, China and the Republic of Korea, which are export competitors of Japan. The selection method of items with growing export value is as described in Figure II Figure II International comparison of shares of items with growing export value (selection method) 1. Identifying the items with growing export value *Items are determined as those with growing export value when they are at higher levels of recent export values than before the collapse of Lehman Brothers and their recent export value is growing. Items shown in the data of countries export value in the world between 2005 and 2014 are to be categorized into those with growing export value and other items by six-digit HS code according to the criteria of determining the growth.(*) (*) Criteria of determining the growth Export value of items is considered as growing when such value in either year of 2013 and 2014 is larger than in any two years between 2005 and 2008 and also when such value in the five years between 2010 and 2014 has grown on a year-on-year basis for three years or more. For details, see the footnote below (see the footnote) Calculating the shares of the countries total of items with growing export value, which are so identified in Step 1 above, in the world overall export value The share of items with growing export value in the overall export value is 47 for Japan, whereas the share is higher than 70 for Germany, the United States, the Republic of Korea, the United 70 For specific criteria, simpler methods might be considered, such as adopting the export values in 2014 exceeding those in However, as for specific items, their export value in a single year often changes depending on the individual circumstance, such as build-to-order manufacturing cases, apart from long-term trends. Thus, we decided to adopt the long-term outlook over years, described in the figure, so as to avoid such volatility in the statistics. 184
95 Kingdom and China (Figure II ). Given that Japan s exports have been stagnant in recent years compared with exports by other countries, it is natural that Japan s share of items with growing export value is small. However, the growth trends concerning the shares of items with growing export value and the overall export value are not necessarily consistent with each other, with some countries recording low growth in their overall export value despite their large share of items with growing export value (Figure II ). Figure II Shares of items with growing export value in overall export value in 2014 (Billion dollars) Japan France Germany United States ROK United Kingdom Other items Items with growing export value Share of items with growing export value (right scale) China Notes: Items with growing export value mean items whose export value to the world between 2005 and 2014 are increasing (six-digit HS items). Figures are dollar-based. Source: GTA. 185
96 Figure II Comparison of growth rates of export value to the world France Japan United Germany United Kingdom States ROK China Notes: Growth rates are calculated based on the sum of export values between 2011 and 2014 and those between 2005 and Source: Global Trade Atlas. Therefore, we will conduct comparision in terms of export value growth of items with growing export value and other items. The export growth of items with growing export value between 2005 and 2014 is outstandingly high for China and the Republic of Korea (Figure II ). As for the export value of other items, the United Kingdom and France are recording a steep decline. A comparison between Japan and Germany shows that the rate of export value growth of items with growing export value is higher for Japan than for Germany, while the rate of export value decline of other items is smaller for Japan than for Germany. Nevertheless, the rate of overall export value growth is higher for Germany than for Japan because the share of items with growing export value is larger in Germany, as was mentioned earlier. Meanwhile, a comparison between Germany and the United Kingdom shows that whereas the shares of items with growing export value (Figure II ) and the rates of export value growth (Figure II ) for the counries are similar, their trends in export value growth concerning items with growing export value and other items are quite different. That is presumably because the two countries are recording growth concerning different types of items and because the situations of the items are different. 186
97 Figure II Export value growth rates of items with growing export value and other items ( / ) Items with growing export value Other items Germany France Japan United Kingdom United States ROK China Notes: Items with growing export value mean items whose export value to the world between 2005 and 2014 have increased based on the criteria defined separately. Figures are dollar-based. ((sum of value between )-(sum of value between 2005 and 2008)) / (sum of value between 2005 and 2008) Source: GTA. Next, we will look at in which industries the share of items with growing export value is large in individual countries (Figure II ), with attention focused on eight major sectors: chemicals and plastics, textiles and textile articles, iron and steel products, nonferrous metals, general machinery, electrical machinery, precision machinery and transportation equipment 71. First, in the case of Japan, the share of items with growing export value is around except in the transportation equipment and precision machinery sectors. On the other hand, in the cases of China and Germany, the share of items with growing export value is large in all sectors, providing a contrast to Japan s situation. In the case of the United States, although the share of items with growing export value is small in some sectors, it is larger than 60 in major sectors such as transportation equipment, general machinery and chemicals and plastics. In the case of the United Kingdom, there is a significant disparity between major sectors: in the transportation equipment sector, which is the largest sector, the share of items with growing export value is larger than 80, whereas the share of such items is just over 50 in other major sectors like chemicals and plastics and electrical machinery. 71 As for the specifics of the eight major sectors and the customs tariff numbers of items examined here, see Figure II Iron and steel products and nonferrous metals do not include scraps. Major parts for transportation equipment are included in transportation equipment but not in general machinery, etc. 187
98 Figure II Share of items with growing export value in major countries in eight major sectors (Billion dollars) (Japan 2014) Transport equipment Precision instruments Electrical machinery General machinery Non-ferrous metal Articles of iron or steel Textiles and clothing Chemical and plastic products Notes: Export value of items to the world is considered as growing when such value in either year of 2013 and 2014 grows compared to those in any two years between 2005 and 2008 per six-digit HS code and also when such value in the five years between 2010 and 2014 grows on a year-on-year basis for three years or more.; Export value to the world; Figures are dollar-based. Source: Global Trade Atlas. Total export value Items with growing export value Share of items with growing export value (right scale) (Billion dollars) (Germany 2014) Transport equipment Precision instruments Electrical machinery General machinery Non-ferrous metal Articles of iron or steel Textiles and clothing Chemical and plastic products Notes: Export value of items to the world is considered as growing when such value in either year of 2013 and 2014 grows compared to those in any two years between 2005 and 2008 per six-digit HS code and also when such value in the five years between 2010 and 2014 grows on a year-on-year basis for three years or more.; Export value to the world; Figures are dollar-based. Source: Global Trade Atlas. Total export value Items with growing export value Share of items with growing export value (right scale) 188
99 (Billion dollars) (United States 2014) Transport equipment Precision instruments Electrical machinery General machinery Non-ferrous metal Articles of iron or steel Textiles and clothing Chemical and plastic products Notes: Export value of items to the world is considered as growing when such value in either year of 2013 and 2014 grows compared to those in any two years between 2005 and 2008 per six-digit HS code and also when such value in the five years between 2010 and 2014 grows on a year-on-year basis for three years or more.; Export value to the world; Figures are dollar-based. Source: Global Trade Atlas. Total export value Items with growing export value Share of items with growing export value (right scale) (Billion dollars) (China 2014) Transport equipment Precision instruments Electrical machinery General machinery Non-ferrous metal Articles of iron or steel Textiles and clothing Chemical and plastic products Notes: Export value of items to the world is considered as growing when such value in either year of 2013 and 2014 grows compared to those in any two years between 2005 and 2008 per six-digit HS code and also when such value in the five years between 2010 and 2014 grows on a year-on-year basis for three years or more.; Export value to the world; Figures are dollar-based. Source: Global Trade Atlas. Total export value Items with growing export value Share of items with growing export value (right scale) 189
100 (Billion dollars) (ROK 2014) Chemical and plastic products Textiles and clothing Articles of iron or steel Non-ferrous metal General machinery Electrical machinery Notes: Export value of items to the world is considered as growing when such value in either year of 2013 and 2014 grows compared to those in any two years between 2005 and 2008 per six-digit HS code and also when such value in the five years between 2010 and 2014 grows on a year-on-year basis for three years or more.; Export value to the world; Figures are dollar-based. Source: Global Trade Atlas. Precision instruments Transport equipment Total export value Items with growing export value Share of items with growing export value (right scale) (Billion dollars) (United Kingdom 2014) Transport equipment Precision instruments Electrical machinery General machinery Non-ferrous metal Articles of iron or steel Textiles and clothing Chemical and plastic products Notes: Export value of items to the world is considered as growing when such value in either year of 2013 and 2014 grows compared to those in any two years between 2005 and 2008 per six-digit HS code and also when such value in the five years between 2010 and 2014 grows on a year-on-year basis for three years or more.; Export value to the world; Figures are dollar-based. Source: Global Trade Atlas. Total export value Items with growing export value Share of items with growing export value (right scale) 190
101 (Billion dollars) (France 2014) Chemical and plastic products Textiles and clothing Articles of iron or steel Non-ferrous metal General machinery Electrical machinery Notes: Export value of items to the world is considered as growing when such value in either year of 2013 and 2014 grows compared to those in any two years between 2005 and 2008 per six-digit HS code and also when such value in the five years between 2010 and 2014 grows on a year-on-year basis for three years or more.; Export value to the world; Figures are dollar-based. Source: Global Trade Atlas. Precision instruments Transport equipment Total export value Items with growing export value Share of items with growing export value (right scale) (2) Export volume and price (international comparison) The export values that we looked at in (1) reflect the effects of exchange rate fluctuations. Below ((2), (3) and (5)), we will look at export volume in order to exclude the effects of exchange rate fluctuations. At the same time, we will examine the volume-price combination trend, as the possibility of Japanese exports shifting to high-value-added products has been pointed out. Examining both the volume and price trends will make clear whether the export value growth is attributable to volume growth, price increase or both. Through such examination, we will also identify the strengths and characteristics of individual countries. The analysis methods of the volume and price trends are as described in II Figure II Volume-price analysis (calculation method) <1> Export volume categorization Categorization is decided based on import volume data for from the export country available from the importing country (based on export volume data available from the exporting country in the case of total exports) at the six-digit HS code level. - is a category of items whose volume was higher in either 2013 or 2014 than in at least two years between 2005 and 2008 and whose volume recorded year-on-year growth in at least three years during the five-year period between 2010 and Volume is a category of items which are not included in volume + and whose volume was lower in both 2013 and 2014 than in at least two years between 2005 and Volume ± is a category of items which are not included in either volume + or volume. 191
 at the six-digit HS code level.")
102 <2> Export price categorization Categorization is decided based on import price data for from the export country available from the importing country (based on export price data available from the exporting country) at the six-digit HS code level. - Price++ and price+ are categories of items whose price was higher in either 2013 or 2014 than in at least two years between 2005 and 2008 (whose price increased at a rate higher than the overall import price growth rate (or the consumer price growth rate) in the importing country in the case of price ++ ) and whose price recorded year-on-year growth in at least three years between 2010 and 2014 (whose price recorded a higher growth rate than the import price growth rate (or the consumer growth rate) in the importing country in the case of price ++ ). ( does not include volume ++. The volume ++ category is not used in relation to export to the world.) - Price is a category of items which are not included in either price + or price ++ and whose price was lower in both 2013 and 2014 than in at least two years between 2005 and Price ± is a category of items which are not included in any of price ++, price + and price. <3> Export volume-export price categorization Items are grouped into 12 categories (nine categories in relation to export to the world), namely the three export volume categories multiplied by the four export price categories. <4> Calculation of the export growth rate In order to even out yearly fluctuations, the export growth rate used here represents the growth rate (a) of the total export value in (b) compared with the total export value in (c) ((a)=((b)-(c)) (c)). <5> Item shares and export values do not include those of items whose volumes and prices have not been published. <6> On a dollar basis. Data from the Global Trade Atlas was used. Figure II (Reference) Guide to the volume-price combination analysis table Item share Export growth rate Item share Export growth rate Item share Export growth rate Volume+ Volume+ Volume± Volume± Volume Volume Each volume category was subdivided into four price categories Price++ Price+ Price± Price <1> The four left columns (item share) of each volume category The share of each volume-price category concerning a relevant export item (on a 2014 export 192
 in the volume +/price category of the chemicals and plastics sector in the export value in 2014")
103 value basis). The higher the share, the darker the green color. Example: The share of items (six-digit HS code items) in the volume +/price category of the chemicals and plastics sector in the export value in 2014 was <2> The four right columns (export value growth rate) of each volume category The growth rate of each export item by volume-price category (total value in total value in ) total value in Dark orange indicates that the export growth rate was higher than 100, while pale orange indicates that the growth rate was between 0 and 100. Pale blue indicates a decline between 0 and 100 and the dark blue indicates a decline higher than 100. Example: The export growth rate of items (six-digit HS code items) in the volume+/price- category of the chemicals and plastics sector (others) was minus Volume+ four price categories Export growth rate Item share (2014) ( / ) Volume+Volume+Volume+Volume+Volume+Volume+Volume+ Volume+ Price++ Price+ Price± Price Price++ Price+ Price± Price Chemicals and plastics (others) Inorganic chemicals Organic chemicals First, in relation to the export value to the world, we will compare the volume and price trends for individual countries. As shown in Table II , in the case of Japan, the shares of items with growing export volume and items with rising export price are the lowest among the major countries compared at this time. As for the volume-price combination trend, China has the largest share of items with both growing volume and rising price (growing volume/rising price category = volume+/ price+), followed by the Republic of Korea and Germany in that order. We will also look at the share of items with declining volume and rising price (declining volume/rising price category = volume-/unit price+) because a price rise may increase export value despite a volume decline. The share of the declining volume/rising price category in Japan, at 33, is the largest among the countries compared, but the export value of this category for Japan is declining. The share of this category is relatively large and the export value is growing in the United Kingdom (share: 31; growth rate: 4) and the United States (share: 21; growth rate: 22). 193
Effects of China s Auto/Home Appliance Subsidies on Production in Japan
 Japan's Economy 13 July 212 (No. of pages: 8) Japanese report: 1 Jul 12 Effects of China s Auto/Home Appliance Subsidies on Production in Japan Two perspectives of production in Japan and by Japanese companies
Mizuho Economic Outlook & Analysis The 16 th Questionnaire Survey of Japanese Corporate Enterprises Regarding Business in Asia (February 2016)
") Mizuho Economic Outlook & Analysis The 16 th Questionnaire Survey of Japanese Corporate Enterprises Regarding Business in Asia (February 16) May 16 Copyright Mizuho Research Institute Ltd. All Rights Reserved.
Mizuho Economic Outlook & Analysis The 16 th Questionnaire Survey of Japanese Corporate Enterprises Regarding Business in Asia (February 16) May 16 Copyright Mizuho Research Institute Ltd. All Rights Reserved.
Figure I Comparison of trade balance by principal commodity (,, ) Figure I Trends in trade balance from to 56
 Figure I Trends in trade balance from to 56") Section 2 Changes in Japan s trade structure 1. Changes in the trade structure as viewed from the trade balance by major commodity This section looks at trends in the trade structure by comparing the trade
Section 2 Changes in Japan s trade structure 1. Changes in the trade structure as viewed from the trade balance by major commodity This section looks at trends in the trade structure by comparing the trade
Gross Domestic Product
 Gross Domestic Product ICT output declined... For the first time in the entire analyzed period (2002-2008), Canada's ICT sector output declined (-0.5%) at the end of 2008. However, this decline was at
A GATïà ^ GÉNÉRAL SUR LES TARIFS DOUA RS ET LE COMMEM
 Press Relea ommuniqu iepr< GENERAL AGREEMENT ON TARIFFS AND TRADE A GATïà ^ GÉNÉRAL SUR LES TARIFS DOUA RS ET LE COMMEM >ntre William Rappard, Rue de Lausanne 154, 1211 Genève 21 M W Tél. (022M 31 02 31
Overview of the manufacturing sector
 Overview of the manufacturing sector Jane Turner, Economics Department This article examines recent trends in New Zealand s manufacturing sector. It finds that sales to the domestic market have been reasonably
DAIRY AND DAIRY PRODUCTS
 3. COMMODITY SNAPSHOTS Market situation DAIRY AND DAIRY PRODUCTS International dairy prices started to increase in the last half of 2016, with butter and whole milk powder (WMP) accounting for most of
2008 Annual Report on Lead Market
 2008 Annual Report on Lead Market With global lead ingot supply and demand balance converting the deficit in 2007 to a surplus in 2008, lead price retreated gradually in 2008 after rocketing greatly in
International Monetary and Financial Committee
 International Monetary and Financial Committee Thirty-Eighth Meeting October 12 13, 2018 Statement No. 38-5 Statement by Mr. Barkindo OPEC Statement by H.E. Mohammad Sanusi Barkindo Secretary General
JAPANESE ECONOMY Is the level sinking?... 1
 調査レポート 04/102 2005 年 2 月 8 日 JAPANESE ECONOMY Is the level sinking?... 1 US ECONOMY The economy continues to expand, but at a slower pace.. 3 December retail sales rose by 1.2% mom.... 3 CHINESE ECONOMY
OPEC Statement to the Spring Meetings of the IMF/World Bank, April Copyright 2019 OPEC
 Statement by H.E. Mohammad Sanusi Barkindo Secretary General Organization of the Petroleum Exporting Countries (OPEC) to the Intergovernmental Group of Twenty Four (G-24) Meeting of Ministers and Governors
Why Export? Mitigating Risk by Diversifying Your Market Portfolio
 Why Export? Mitigating Risk by Diversifying Your Market Portfolio Dr. Ivan Eastin Director, CINTRAFOR College of Forest Resources, UW Presented at the: National Indian Forestry and Wildland Fire Management
GLOBAL VALUE CHAINS INTRODUCTION AND SUMMARY DIRECT AND INDIRECT EXPORTS
 GLOBAL VALUE CHAINS Peter Beck Nellemann and Karoline Garm Nissen, Economics INTRODUCTION AND SUMMARY A final product is created through a chain of activities such as design, production, marketing and
U.S. Trade Deficit and the Impact of Changing Oil Prices
 U.S. Trade Deficit and the Impact of Changing Oil Prices James K. Jackson Specialist in International Trade and Finance 16, 2016 Congressional Research Service 7-5700 www.crs.gov RS22204 Summary Imported
Quarterly Survey of Overseas Subsidiaries (Survey from July to September 2017) ~ Summary of the Results ~
 ~ Summary of the Results ~") Quarterly Survey of Overseas Subsidiaries (Survey from July to September 2017) ~ Summary of the Results ~ December 27, 2017 Research and Statistics Department Ministry of Economy, Trade and Industry 1
Quarterly Survey of Overseas Subsidiaries (Survey from July to September 2017) ~ Summary of the Results ~ December 27, 2017 Research and Statistics Department Ministry of Economy, Trade and Industry 1
POULTRYMEAT - PER CAPITA CONSUMPTION - SELECTED COUNTRIES
 GENERAL AGREEMENT ON TARIFFS AND TRADE RESTRICTED IMC/W/77/Add.1 7 December Special Distribution International Meat Council Twenty-Third Meeting 14 December SITUATION AND OUTLOOK IN THE INTERNATIONAL MEAT
Stability in Prices PRICES INDUSTRIAL PRICES IN CURRENT EXPANSION. January 1962
 Stability in Prices INDUSTRIAL COMMODITY MARKETS were more competitive in 1961 than in earlier postwar periods of business expansion. Prices of some commodities advanced, but prices of others declined
Statement by H.E. Mohammad Sanusi Barkindo Secretary General Organization of the Petroleum Exporting Countries (OPEC) to the Intergovernmental Group
 to the Intergovernmental Group") Statement by H.E. Mohammad Sanusi Barkindo Secretary General Organization of the Petroleum Exporting Countries (OPEC) to the Intergovernmental Group of Twenty Four (G-24) Meeting of Ministers and Governors
Statement by H.E. Mohammad Sanusi Barkindo Secretary General Organization of the Petroleum Exporting Countries (OPEC) to the Intergovernmental Group of Twenty Four (G-24) Meeting of Ministers and Governors
10 ECB HOW HAVE GLOBAL VALUE CHAINS AFFECTED WORLD TRADE PATTERNS?
 Box 1 HOW HAVE GLOBAL VALUE CHAINS AFFECTED WORLD TRADE PATTERNS? In recent decades, global trade has undergone profound changes. Relative to global output, trade has risen sharply and cross-country linkages
A decade of oil demand
 A decade of oil demand World oil demand Eni has recently published the thirteenth edition of the 2014 World Oil and Gas Review, the annual statistical review on the world oil and gas market and the refining
EU Steel Market Situation and Challenges
 78th Session of the OECD Steel Committee Paris, 11-12 May 2015 EU Steel Market Situation and Challenges EU steel-using sectors: gradual further rise activity 2015-2016 SWIP: Steel Weighted Industrial Production
Money Does Grow on Trees as U.S. Forest Product Exports Set Record
 Billion $ Foreign Agricultural Service United States Department of Agriculture International Agricultural Trade Report April 16, 2015 Money Does Grow on Trees as U.S. Forest Product Exports Set Record
The East Asian Economic Crisis: It's not All Bad News
 Purdue University Purdue e-pubs GTAP Working Papers Agricultural Economics 1-1-1999 The East Asian Economic Crisis: It's not All Bad News Elena Ianchovichina World Bank Thomas Hertel Purdue University
The Great Synchronisation: what do high-frequency statistics tell us about the trade collapse?
 The Great Synchronisation: what do high-frequency statistics tell us about the trade collapse? WPTGS, 16-18 November 2009 Sónia Araújo and Eric Gonnard OECD Statistics Directorate Objectives: Analysis
CURRENT SITUATION AND MEDIUM-TERM OUTLOOK FOR TROPICAL FRUITS
 CURRENT SITUATION AND MEDIUM-TERM OUTLOOK FOR TROPICAL FRUITS Prepared by the Sugar and Beverages Group Raw Materials, Tropical and Horticultural Products Service Commodities and Trade Division Food and
Strong growth Activity and Performance in line with ALMA 2015 objectives
 Paris, April 26, 2011 2011 first quarter revenue Strong growth Activity and Performance in line with ALMA 2015 objectives Q1 2010 Q1 2011 11/10 11/10 comparable* Gas and Services 2,760 3,185 +15.4% +11.4%
International Index of Energy Security Risk
 International Index of Energy Security Risk Assessing Risk in a Global Energy Market 2013 Edition Highlights Institute for 21st Century Energy U.S. Chamber of Commerce www.energyxxi.org Highlights This
Global Markets Group. Trade Performance: Narrowing Surplus Author: Juniman Chief Economist. Economic Research. Trade Outlook Monthly Report
 Global Markets Group Trade Outlook Monthly Report Economic Research May 2018 Trade Performance: Narrowing Surplus Author: Juniman Chief Economist Trade Highlights Exports in March 2018 rose to US$ 15.58
Machinery Trade in East Asia and Global Financial Crisis. Mitsuyo Ando * Faculty of Business and Commerce, Keio University
 Machinery Trade in East Asia and Global Financial Crisis Mitsuyo Ando * Faculty of Business and Commerce, Keio University Abstract The global financial crisis since the fall 2008 has influenced the world
OECD FAO Agricultural Outlook
 OECD FAO Agricultural Outlook 2018 ca 7. DAIRY AND DAIRY PRODUCTS Chapter 7. Dairy and dairy products This chapter describes the market situation and highlights the latest set of quantitative medium-term
Durable goods hamper personal consumption growth - A full-scale stock adjustment has been triggered by the front-loading of future demand -
 Mizuho Economic Outlook & Analysis January 5, 1 Durable goods hamper personal consumption growth - A full-scale stock adjustment has been triggered by the front-loading of future demand - < Summary > Personal
China: growth, urbanisation and mineral resource demand
 : growth, urbanisation and mineral resource demand Jin Liu and Tony McDonald 1 Over recent decades, has experienced rapid economic growth and a related sharp increase in its rate of urbanisation. The speed
World Pork Map Trade will continue to grow, become more complicated and experience more competition
 July 2018 World Pork Map 2018 World Pork Trade Is Becoming Increasingly Complex and Competitive RaboResearch Food & Agribusiness far.rabobank.com Jan Peter van Ferneij Senior Analyst Animal Protein +31
Perception of the Business Environment in Japan among Foreign-affiliated Companies
 Ⅳ Perception of the Business Environment in Japan among Foreign-affiliated Companies From May to June 2017, JETRO conducted the Survey on Japan s Investment Climate designed for present data analysis to
Sturdy Exports Growth Improves Trade Balance to RM8.75 Billion
 5 June ECONOMIC REVIEW April External Trade Sturdy Exports Growth Improves Trade Balance to RM8.75 Billion Trade balance improved to RM8.75 billion in surplus. Trade balance recorded the highest value
The Taiwanese Economy
 The Taiwanese Economy 215 CCIFT General Assembly April 9, 215 1 The Taiwanese economy in a few words Key figures A DYNAMIC ECONOMY TAIWAN, 5 th ECONOMIC POWER IN ASIA 214 GDP Growth: +3,74% World s 14
Highlights. Figure 1. World Marketed Energy Consumption by Region,
 Highlights World energy consumption is projected to increase by 71 percent from 3 to 23. Fossil fuels continue to supply much of the energy used worldwide, and oil remains the dominant energy source. In
Argus Ethylene Annual 2017
 Argus Ethylene Annual 2017 Market Reporting Petrochemicals illuminating the markets Consulting Events Argus Ethylene Annual 2017 Summary Progress to the next peak of the economic cycle, now expected by
Trading patterns: Global and regional perspectives
 Chapter V Trading patterns: Global and regional perspectives World merchandise trade in value terms fell by 3 per cent in 2016 following a 13 per cent slump recorded in 2015, with trade growth remaining
ACP2005:World Trade Outlook 6 Countries
 _ ACP2005:World Trade Outlook 6 Countries GLOBAL MACROECONOMIC SCENARIOS AND WORLD TRADE STATISTICS AND FORECAST FOR THE PANAMA CANAL AUTHORITY Contract SAA-146531 World Sea Trade Outlook World Sea Trade
OECD Information Technology Outlook 2008 Highlights
 OECD Information Technology Outlook 28 Highlights The ICT industry has slowed with the world economic slowdown but growth continues in some markets and products The outlook for the ICT sector has weakened
Global Markets Group. Trade Performance: Still Surplus Author: Juniman Chief Economist. Economic Research. Trade Outlook Monthly Report
 Global Markets Group Trade Outlook Monthly Report Economic Research September 2016 Trade Performance: Still Surplus Author: Juniman Chief Economist Trade Highlights Exports in July 2016 fell to US$ 9.51
Export Breached RM80 billion, Highest on Record
 5 May ECONOMIC REVIEW March External Trade Export Breached RM80 billion, Highest on Record Exports continued to expand by double-digit growth in March. For the first time, exports value reached the highest
Net sales of the Konica Minolta Group for the fiscal year ended March 31, 2011, declined 26.5 billion, or 3%, year on year, and operating income fell
 0 Net sales of the Konica Minolta Group for the fiscal year ended March 31, 2011, declined 26.5 billion, or 3%, year on year, and operating income fell 4.0 billion, or 9%, reflecting the significant adverse
Evolution of Production Network: Measuring Trade in value-added (TiVA)
") Evolution of Production Network: Measuring Trade in value-added (TiVA) Norihiko YAMANO Directorate for Science Technology and Industry, OECD Working Party on Globalisation of Industry Committee on Industry,
Evolution of Production Network: Measuring Trade in value-added (TiVA) Norihiko YAMANO Directorate for Science Technology and Industry, OECD Working Party on Globalisation of Industry Committee on Industry,
Trade in Intermediate Goods, Armington Elasticity and Exchange Rate Pass-through. Fumihide TAKEUCHI Tokai University (Japan)
") Trade in Intermediate Goods, Armington Elasticity and Exchange Rate Pass-through Fumihide TAKEUCHI Tokai University (Japan) 1 What is an exchange rate pass-through (ERPT)? Effect of exchange rate changes
Trade in Intermediate Goods, Armington Elasticity and Exchange Rate Pass-through Fumihide TAKEUCHI Tokai University (Japan) 1 What is an exchange rate pass-through (ERPT)? Effect of exchange rate changes
Section 3 Rising productivity and the role of human capital and organization
 Section 3 Rising productivity and the role of human capital and organization 1. Productivity trends since the 1990s Since the late 1990s, labor productivity and total factor productivity (TFP)
World Manufacturing Production
 World Manufacturing Production Statistics for Quarter IV, 2017 Report on world manufacturing production This report presents the observed growth rates and growth estimates of world manufacturing production
U.S. Trade Deficit and the Impact of Changing Oil Prices
 U.S. Trade Deficit and the Impact of Changing Oil Prices James K. Jackson Specialist in International Trade and Finance 1, 2015 Congressional Research Service 7-5700 www.crs.gov RS22204 Summary Imported
Analysis of Indian engineering exports during July 2015: August 18, 2015
 Analysis of Indian engineering exports during July 2015: August 18, 2015 Trend in overall trade India's merchandise exports during 2015 were valued at US $23.14 billion which was 10.3 cent lower in Dollar
International Monetary and Financial Committee
 International Monetary and Financial Committee Thirty-First Meeting April 18, 2015 IMFC Statement by H.E. Abdalla Salem El-Badri Secretary-General The Organization of the Petroleum Exporting Countries
Short Term Energy Outlook March 2011 March 8, 2011 Release
 Short Term Energy Outlook March 2011 March 8, 2011 Release Highlights West Texas Intermediate (WTI) and other crude oil spot prices have risen about $15 per barrel since mid February partly in response
Country Trade View: South Korea. Trends in global trade
 Country Trade View: South Korea Trends in global trade General Markets Analysis / September 2016 Summary The Korean economy is heavily reliant on foreign supply of raw materials and fuel imports. Fuels
1. Foreign Trade Figures in the Czech Republic in 2010
 1. Foreign Trade Figures in the Czech Republic in 2010 Foreign trade in the Czech Republic ended 2010 with a surplus of CZK 121.2 billion. Although this is CZK 28.4 billion less than in 2009, it is still
Indonesia Cotton and Products Annual Report 2014
 THIS REPORT CONTAINS ASSESSMENTS OF COMMODITY AND TRADE ISSUES MADE BY USDA STAFF AND NOT NECESSARILY STATEMENTS OF OFFICIAL U.S. GOVERNMENT POLICY Required Report - public distribution Date: GAIN Report
Fresh Deciduous Fruit: World Markets and Trade (Apples, Grapes, & Pears)
") United States Department of Agriculture Foreign Agricultural Service December 2017 Fresh Deciduous Fruit: World Markets and Trade (Apples, Grapes, & Pears) FRESH APPLES World production for 2017/18 is
United States Department of Agriculture Foreign Agricultural Service December 2017 Fresh Deciduous Fruit: World Markets and Trade (Apples, Grapes, & Pears) FRESH APPLES World production for 2017/18 is
The First Quarter of 2013 Analysis of All Industrial Activities Summary Contents
 The First Quarter of 13 Analysis of All Industrial Activities Summary Contents [Topics] Relation between Exchange Rate and Export Value/Export Prices Consideration of Trends of the Tourism Industry after
Preface. Table 1 distinguishes domestic exports from re-exports while other export tables give total exports, which is the sum of the two.
 Preface This International Merchandise Trade Statistics (IMTS) Monthly Digest presents statistics on Botswana s total imports and exports of goods as at the end of October 2013. Data for imports and exports
THE ECONOMIC IMPACT OF IT, SOFTWARE, AND THE MICROSOFT ECOSYSTEM ON THE GLOBAL ECONOMY
 Addendum THE ECONOMIC IMPACT OF IT, SOFTWARE, AND THE MICROSOFT ECOSYSTEM ON THE GLOBAL ECONOMY METHODOLOGY AND DEFINITIONS Global Headquarters: 5 Speen Street Framingham, MA 01701 USA P.508.872.8200 F.508.935.4015
SITUATION AND OUTLOOK IN THE INTERNATIONAL MEAT MARKETS. Note by the Secretariat. Addendum
 GENERAL AGREEMENT ON TARIFFS AND TRADE RESTRICTED IMC /W/ 74/ Add. 1 1 June Special Distribution International Meat Council Twenty-Second Meeting 22 June SITUATION AND OUTLOOK IN THE INTERNATIONAL MEAT
 http://e-asia.uoregon.edu THE ROLE OF SMALL & MEDIUM-SIZED ENTERPRISES IN EXPORTS TO CHINA: A STATISTICAL PROFILE Results from the 2003 Exporter Data Base International Trade Administration Manufacturing
COMMITTEE ON COMMODITY PROBLEMS
 November 215 CCP:HF/JU 15/CRS 1 E COMMITTEE ON COMMODITY PROBLEMS JOINT MEETING OF THE THIRTY-EIGHTH SESSION OF THE INTERGOVERNMENTAL GROUP ON HARD FIBRES AND THE FORTIETH SESSION OF THE INTERGOVERNMENTAL
Analysis of Indian engineering exports during November 2015: December 16, 2015
 Analysis of Indian engineering exports during 2015: December 16, 2015 Trend in overall trade India's merchandise exports registered a decline for the twelfth consecutive month falling as much as 24.43
TRADE STRUCTURE OF INDIA AND CHINA
 CHAPTER - IV TRADE STRUCTURE OF INDIA AND CHINA 4.1 Introduction : As noted in the discussion in chapter-3, highlights the fact that trade liberalization journey has been quite diverse in India and China.
In 2013, global production
 48 th Census of World Casting Production Steady Growth in Global Output Worldwide casting production continued to grow in 2013, up more than 3.4 million metric tons, an increase of 3.4% in comparison to
Overview of Chinese Casting and Foundry Equipment Import and Export in 2007
 May 009 Overview of Chinese Casting and Foundry Equipment and in 00 China Foundry Association Chinese casting production increased to 31,0,000 tons in 00, with an increase of.3% compared to 8,090,000 tons
Export performance after depreciation
 Export performance after depreciation By Leo Bonato, Sean Comber and John McDermott, Economics Department Many commentators have been disappointed by the recent performance of the export sector. The New
Details about profit from operating activities and other categories of profit will be provided later in the presentation.
 Our financial results for the full 2017 fiscal year are summarized here. Revenue was 1,102.1 billion, up 77.2 billion year on year. Business profit was 74.7 billion, up 8.9 billion. Profit for the period
Regional Trade Statistics Third Quarter 2011
 Regional Trade Statistics Third Quarter 2011 Coverage: United Kingdom Theme: Business and Energy Released: 08 December 2011 Next Release: 08 March 2012 Frequency of release: Quarterly Media contact: HMRC
Disclosure of FY2015 financial results
 0 Disclosure of FY2015 financial results 1 2 FY2015 first half financial highlights Revenue was 542.9 billion, up 30.1 billion compared to the same period last year. Business profit was 40.2 billion, down
The Taiwanese Economy
 The Taiwanese Economy A new dynamic after the Economic Crisis March 22, 2012 1 The Taiwanese economy in a few words Important figures TAIWAN, 5 th ECONOMIC POWER IN ASIA A DYNAMIC ECONOMY 2011 GDP Growth:
Global slowdown and rising inflation
 Global slowdown and rising inflation International Monetary Fund Washington, D.C. 20431 USA The global economy is in a tough spot, caught between sharply slowing demand in many advanced economies and rising
2013 Jan-Jun. US hardwood lumber exports to Europe fall 4% but market is poised for growth. Notes
 US hardwood lumber exports to Europe fall 4% but market is poised for growth Total US hardwood lumber exports to Europe in the first six months of were 178,800 m 3, down 4% compared to the same period
Analysis of Indian engineering exports during February 2015: March 17, 2015
 Analysis of Indian engineering exports during February : March 17, Trend in overall trade India's merchandise trade deficit narrowed to a 17-month low of US $6.85 billion in February as compared to US
Steelmaking raw materials: Market and Policy Developments
 Steelmaking raw materials: Market and Policy Developments DSTI/SU/SC(2010)16 69 th Steel Committee Meeting Paris 3-4 December 2010 Summary Recovery in world output of steel has raised the demand for raw
Emissions Intensity CHAPTER 5 EMISSIONS INTENSITY 25
 C H A P T E R 5 Emissions Intensity Emissions intensity is the level of GHG emissions per unit of economic activity, usually measured at the national level as GDP. 25 Intensities vary widely across countries,
Surface freight volumes, measured in tonne-kilometres of goods transported, show signs of a slowing down in China and Russia.
 Statistics Brief Global Trade and Transport October 2015 Air Freight Volumes Indicate Slowing Growth in the Second Quarter 2015 The latest update of global freight data collected by the International Transport
2007 Annual Report on Chinese Tin Market
 2007 Annual Report on Chinese Tin Market When copper and zinc had a bullish performance in 2005 and 2006, tin was cast in the shade. However, the metal took the rocketing road and became shining on the
Chapter 2 Energy Consumption by End-Use Sector
 Chapter 2 Energy Consumption by End-Use Sector In the IEO26 projections, end-use energy consumption in the residential, commercial, industrial, and transportation sectors varies widely among regions and
Kyocera Corporation Telephone Conference Call (January 29, 2009)
") Kyocera Corporation Telephone Conference Call (January 29, 2009) Executive Officer and General Manager of Corporate Financial & Accounting Group, Shoichi Aoki I will explain consolidated financial
Kyocera Corporation Telephone Conference Call (January 29, 2009) Executive Officer and General Manager of Corporate Financial & Accounting Group, Shoichi Aoki I will explain consolidated financial
Mizuho Economic Outlook & Analysis
 Mizuho Economic Outlook & Analysis October 4, 18 How a rise in crude oil prices may affect Asian countries The key factor is whether these countries can absorb the negative impact from a decline in terms
Nielsen: Q Hong Kong Consumer Confidence Drops Four Index Points to 85
 News Release FOR IMMEDIATE RELEASE CONTACT: Susanne Tong, susanne.tong@nielsen.com, 852.2856.7337 Nielsen: Q4 2012 Hong Kong Consumer Confidence Drops Four Index Points to 85 More than half of Hong Kong
Air freight volumes in tonnes of goods moved, considered as a lead indicator, have recovered above pre-crisis peak in the United States and EU-28.
 Statistics Brief Global Trade and Transport February 2015 Air freight volumes indicate a potential improvement of the near-term outlook The latest update of global freight data collected by the International
Rice price relationships are becoming distorted again this year. The relatively thin rice market compared to other agricultural commodities and concen
 Rice Rice price relationships are becoming distorted again this year. The relatively thin rice market compared to other agricultural commodities and concentration of trade in Asia are factors that are
Oral Statement before the United States Senate Committee on Agriculture, Nutrition, and Forestry. Hearing on the trade section of the farm bill
 Oral Statement before the United States Senate Committee on Agriculture, Nutrition, and Forestry Hearing on the trade section of the farm bill April 25, 2001 Bruce A. Babcock Center for Agricultural and
Agricultural Outlook Forum For Release: Tuesday, February 24, 1998 POTENTIAL FOR DAIRY PRODUCT EXPORTS
 Agricultural Outlook Forum For Release: Tuesday, February 24, 1998 POTENTIAL FOR DAIRY PRODUCT EXPORTS Tom Suber Executive Director, U.S. Dairy Export Council Good afternoon. The title of this presentation
gas 2O18 Analysis and Forecasts to 2O23
 Market Report Series gas 2O18 Analysis and Forecasts to 2O23 executive summary INTERNATIONAL ENERGY AGENCY The IEA examines the full spectrum of energy issues including oil, gas and coal supply and demand,
Managing T&E Indirect Contracts in Asia Pacific. Issa Isaac Director, Global Service, Asia Pacific
 Managing T&E Indirect Contracts in Asia Pacific Issa Isaac Director, Global Service, Asia Pacific Asia Pacific East vs. West Opinion A A B B Contacts Traveling Handling of Problems The Boss Pakistan China
Analysis of Trade Development between China and Association of Southeast Asian Nations
 Journal of Behavioural Economics, Finance, Entrepreneurship, Accounting and Transport, 2013, Vol. 1, No. 1, 15-20 Available online at http://pubs.sciepub.com/jbe/1/1/3 Science and Education Publishing
U.S Department of Agriculture. Agricultural Outlook Forum February 22 & 23, 2001 NEW DEVELOPMENTS IN FOREIGN COTTON PRODUCTION AND CONSUMPTION
 U.S Department of Agriculture Agricultural Outlook Forum 2001 February 22 & 23, 2001 NEW DEVELOPMENTS IN FOREIGN COTTON PRODUCTION AND CONSUMPTION Terry Townsend Executive Director International Cotton
David Coady, Stefania Fabrizio, Mumtaz Hussain, Baoping Shang, and Younes Zouhar
 ENERGY SUBSIDY REFORM: LESSONS AND IMPLICATIONS CHAPTER 2. DEFINING AND MEASURING ENERGY SUBSIDIES David Coady, Stefania Fabrizio, Mumtaz Hussain, Baoping Shang, and Younes Zouhar Definition and Measurement
ANNUAL PUBLICATION: detailed data. VOLUME OF EXPORTS FELL BY 4,7 PER CENT IN 2015 Export prices rose 0,7 per cent. 24 March 2016
 ANNUAL PUBLICATION: detailed data 2 March 216 VOLUME OF EXPORTS FELL BY,7 PER CENT IN 21 Export prices rose,7 per cent According to Finnish Customs preliminary data, the value of Finland s goods exports
Case Assumption Case (A): without electricity restriction Nuclear power generation will decrease gradually before reaching zero in May From July
: without electricity restriction Nuclear power generation will decrease gradually before reaching zero in May From July") The 408th Forum on Research Work December 22, 2011 Short-Term Energy Supply/Demand Outlook --Analysis on Scenario through FY2012 Background Shigeru Suehiro, Manager Energy Demand, Supply and Forecast Analysis
The 408th Forum on Research Work December 22, 2011 Short-Term Energy Supply/Demand Outlook --Analysis on Scenario through FY2012 Background Shigeru Suehiro, Manager Energy Demand, Supply and Forecast Analysis
Automakers and Auto Parts manufacturers
 Last updated: July 13, 2011 Rating Methodology by Sector Automakers and Auto Parts manufacturers 1. Business base Susceptible as it is to business fluctuations, the demand for new automobiles is relatively
UNITED ARROWS LTD. First Quarter Fiscal 2014 Earnings Announcement Q&A
 UNITED ARROWS LTD. First Quarter Fiscal 2014 Earnings Announcement Q&A UNITED ARROWS LTD. held an earnings announcement presentation attended by the mass media, analysts, and institutional investors on
India s Export Performance Analysis An Analysis
 India s Export Performance Analysis An Analysis Rashmi Taneja Assistant Professor, Shri Aurobindo College, University of Delhi, Delhi Abstract Merchandise exports from India have exhibited a perceptible
World steel outlook and challenges ahead. Steel Markets Asia Conference, 9 November 2017
 World steel outlook 2017-2018 and challenges ahead Steel Markets Asia Conference, 9 November 2017 Disclaimer text This document is protected by copyright. Distribution to third parties or reproduction
 2 ENERGY TECHNOLOGY RD&D BUDGETS: OVERVIEW (2017 edition) Released in October 2017. The IEA energy RD&D data collection and the analysis presented in this paper were performed by Remi Gigoux under the
NATIONAL COMPETITIVENESS: A NINE-FACTOR APPROACH AND ITS EMPIRICAL APPLICATION
 NATIONAL COMPETITIVENESS: A NINE-FACTOR APPROACH AND ITS EMPIRICAL APPLICATION Hwy-Chang Moon and Dong-Sung Cho Seoul National University ABSTRACT There exist some reports on national competitiveness,
The state of global energy efficiency
 CIS =1 The state of global energy efficiency 1. Global and sectoral energy efficiency trends 1.1 Global trends In 2010, total energy consumption per unit of GDP (primary energy intensity 1 ), measured