Business cycle fluctuations Part I
|
|
|
- Bartholomew Cross
- 6 years ago
- Views:
Transcription
1 Understanding the World Economy Master in Economics and Business Business cycle fluctuations Part I Lecture 6 Nicolas Coeurdacier nicolas.coeurdacier@sciencespo.fr
2 Lecture 6 : Business cycle fluctuations Part I 1. Definitions 2. Business cycle facts 3.Whatisdrivingthecycle?
3 Whatisthe business cycle? Two slightly different views: A) Conventional view is that the business cycle describes medium term fluctuations in the level of economic activity (GDP) around a long term trend. B) An alternative view is that the business cycle refers to the way in which activity is bunched over time, whereby the economy oscillates between periods of high and low production. The second definition is more general as it does not define business cycles as relative to a trend.
4 US Real GDP level: do you see the business cycle? Real GDP(Billions of 2009 dollars) Potential Real GDP Source: BEA
5 Output gap The output gap is the difference between the trend level of output and actual output: Some problems: GDP level = GDP trend + (GDP level GDP trend) (GDP level GDP trend) = Output Gap 1. get your definition of the trend wrong then also get business cycle wrong. 2. timing of booms and recessions sensitive to exact choice of trend. 3. trend output itself may fluctuate(technology).
6 Output gap and trend output How to compute the trend? (GDP level GDP trend) = Output Gap Parametric trend Linear trend or linear + quadratic trend, eventually with breaks. Filtering For instance, keep medium(and high) frequencies for business cycle fluctuations. Low frequencies for trend fluctuations. Issue: what if the business cycle is the trend? Long-run fluctuations with highly persistent shocks.
 Source: Federal Reserve Economic")
7 US business cycle fluctuations (% deviations from trend) Source: Federal Reserve Economic Data
 Source: Federal Reserve Economic")
8 US business cycle fluctuations (Annual% Change Real GDP) Source: Federal Reserve Economic Data
9 2014 Output gaps across countries ( ) deviation of actual GDP from potential GDP (% of potential GDP) France Japan United Kingdom United States Source: OECD
10 Business cycle vocabulary
11 Business cycle vocabulary Pro/counter cyclical (a): pro-cyclical variable x = positive correlation between x and y (output gap) along the business cycle (a): counter-cyclical variable x = negative correlation between x and y (output gap) along the business cycle
12 Datingbusiness cycles Classical approach (Burns and Mitchell, 1946, adopted by NBER and CEPR) Identify local max and min of selected series and then use judgement to determine peaks and troughs of unobserved ``state of the economy. Duration: number of quarter from peak to trough in a recession or fromtroughtothenextpeakinanexpansion. Amplitude: the % change in real GDP from peak to trough in a recession,orfromtroughtothenextpeakinanexpansion.
13 Datingbusiness cycles GDP measured with error and large revisions. Other variables co-move with GDP (see later): joint analysis should give accurate estimate of state of the economy. NBER uses monthly variables beside GDP: industrial production, sales, income, employment. CEPR does the same, but more emphasis on quarterly variables. NBER and CEPR do not define a recession in terms of two consecutive quarters of decline in real GDP. Rather, a recession is a significant decline in economic activity spread across the economy, lasting more than a few months, normally visible in real GDP, real income, employment, industrial production, and wholesale-retail sales.
14 US recession EU recession Recession in both US GDP EU GDP Datingrecessions CEPR and NBER dating ( )
15 Lecture 6 : Business cycle fluctuations Part I 1. Definitions 2. Business cycle facts 3.Whatisdrivingthecycle?
16 Comovements The business cycle is an aggregate phenomena. Key thing about the business cycle is comovement. The business cycle is reflected in all of the major macroeconomic variables i.e GDP, consumption, investment, unemployment, etc. The majority of sectors are doing well/badly simultaneously. Comovements across regions in a given country (and across countries as shown in the next lecture) of main aggregate variables.
17 Business cycle and employment Employment co-move positively with the business cycle. US correlation of employment(hours) and output gap 0.9 In demand driven expansions, labour demand increases and so does employment. What about wages? In supply driven (think productivity) expansions, if wages increase, so does labour supply (if upward sloping). Employment should increase. What happens if wages and prices do not adjust immediately?
18 Real Wage w/p Employment and business cycles (short run) Employment If labour supply upward sloping in the short-run, increase in labour demand triggers an increase in employment.
19 U.S. Output Gap and unemployment ( ) % Unemployment Rate Output Gap
20 Output gap and unemployment: Okun slaw Unemploymentrate=c-d*(outputgap)withc>0andd>0 Unemployment when output gap > 0 (i.e when output potential > actual output) Ifoutputgap=0,unemploymentrate=c=naturalrate Or: %changeunemployment=c-d*%changeoutput US :c=1.30,d=0.39
21 Okun s Law in the U.S. (1949Q1-2009Q4) Cyclical unemployment(%) If output gap = 0, unemployment at its natural rate. When output gap increases, unemployment falls.
22 Annual percentage change in employment across selected sectors during the last U.S. recessions 10 July March 1991 March Nov Dec June Construction Manufacturing Retail trade Professional & business services Financial activities Education and health services Source: BLS
23 US Annual% Change of GDP (Expenditure Components) % Gross domestic product Personal consumption expenditures Gross private domestic investment Government consumption expenditures and gross investment
24 Fluctuations in real consumption and real GDP in the U.S. ( ) 6% 4% Real annual growth rate of consumption 2% 0% -2% -4% -6% Real annual growth rate ofgdp 2015q1 2014q1 2013q1 2012q1 2011q1 2010q1 2009q1 2008q1 2007q1 2006q1 2005q1 2004q1 2003q1 2002q1 2001q1 2000q1 6% 4% 2% Real annual growth rate of consumption 20% 15% 10% 5% 0% 0% -2% -4% -6% Real growth rate of non-durable consumption Real growth rate of consumption of services Real growth rate of durable consumption [right-scale] -5% -10% -15% Source: BEA -20%
25 Business cycle moments U.S. business cycle moments. Quarterly data 1948Q1-2010Q4. HP filtered series Source: Eric Sims, 2011
26 1,0 0,8 0,6 0,4 0,2 0,0 Output correlation across U.S States Alabama Alaska Arizona California Colorada Connecticut Delaware District of Colombia Florida Georgia Hawaii Idaho Illinois Indiana Iowa Kansas Kentucky Louisana Maine Maryland Massachussets Michigan Minneapolis Mississippi Missouri Montana Nebraska Nevada New Hampshire New Jersey New Mexico New York North Carolina North Dakota Ohio Oklahoma Oregon Pennsylvania Rhodes Island South Carolina South Dakota Tennessee Texas Utah Vermont Virginia Washington West Virginia Wisconsin Wyoming
27 Business cycle factsi Describe what typically happens but every recession/expansion tend to be slightly different. 1.Consumption varies less than GDP. High in expansions and low in recessions. Durable consumption often very volatile while non-durable and service goods consumption (which dominate) are smooth. Why? Savings and dis-savings allow to smooth consumption. 2. Investment is very volatile (2/3 times more volatile than output) and highly procyclical. Why? If consumption less volatile than GDP, investment must be more volatile! Savings are procyclical (and so is investment) 3. Total input of labour almost as volatile as output and very procyclical. High in expansion and low in recessions as explained previously. Note that fluctuations in hours are due more to fluctuations in (un)employment than to fluctuations in average hours/person.
28 Business cycle factsii 4. Real wages typically much smoother than output (and employment). Wage rigidities? Or strong response of labour supply? 5. All domestic expenditures variables very procyclical except government spendings (especially so if government runs contracyclical policies). In the data G is nearly acyclical. 6. Sectors differ in their exposure to the business cycle. The construction industry is heavily exposed to the investment cycle. Manufacturing industry is exposed to fluctuations in trade, investment and productivity. Services are more stable than manufacturing and construction with public services the least cyclical as they are not exposed to the market.
29 The business cycle in real time Identifying business cycles is important information for the public. However, high quality data become available only with a delay nobody knows exactly what current GDP is due both to revisions and to delay in data collection. For that reason leading and co-incident indicators are valuable: Leading indicators: Indicators that have predictive power for business cycle turning points and phases. Co-incident indicators: Indicators that have predictive power for current state of the economy.
30 What are the U.S. Leading Indicators? Labor market Production Investment Monetary conditions 1. Average weekly hours, manufacturing 2. Average weekly initial claims for unemployment insurance 3. Manufacturers' new orders, cons goods and materials 4. Vendor performance, slower deliveries diffusion index 5. Manufacturers' new orders, nondefense capital goods 6. Building permits, new private housing units 7. Stock prices, 500 common stocks 8. Money supply, M2 9. Interest rate spread, 10-year Treasury bonds less federal funds Expectations 10. Index of consumer expectations
 Source:")
31 Leading Economic Index ( ) Source: Conference-Board
32 Lecture 6 : Business cycle fluctuations Part I 1. Definitions 2. Business cycle facts 3.Whatisdrivingthecycle?
33 Understanding the business cycle Acoremacroeconomicmodelisthatofaggregatesupplyand demand with dynamically optimizing agents and firms. Here offersa simplistic&static view of the businesscycle in terms of fluctuations in supply and demand. Health warning : this is a very simple model which immediately provides some analytical insights into the business cycle. Treat with care - In reality supply and demand very interconnected and business cycle crucially driven not just by current prices but expectations of future events. Here, for simplicity, we keep the future as given, in particular future prices.
34 Whatisaggregatedemand? Aggregate demand is the expenditure on goods and services produced in an economy Itismadeupof(remindlecture1): - Consumers expenditure - Investment(business, government and housing) - Government consumption of goods and services - Exports less imports(net trade) Y = C + I + G + X -M
35 Aggregatedemandshocks Aggregate Demand can therefore increase because: People want to spend more of given income (e.g conspicuous consumption of 1920s and 1980s). Also when they feel wealthier due to booming asset prices. Entrepreneurs feel more buoyant and want to invest more without changes in interest rates( animal spirits ) Government increases expenditure or announces tax cuts. Overseas demand increases for domestically produced goods. Supply of money increases. Why?
36 Aggregate Demand Price Demand Shock = for a given price consumer can buy more and Aggregate Demand Curve shifts out. Output
37 Whatisaggregatesupply? In our analysis of output in the growth model, we showed that what mattered for supply was the capital stock (human and physical), the labour force, technology and various socio-cultural factors. Therefore output did not depend on the price level but real factors and so the long run aggregate supply curve is vertical- output does not change with prices. Then, in the long run increases in aggregate demand justproducehigherpricesandnochangeinoutput-not a good business cycle model.
38 Long-run effect of a shift in aggregate demand Prices Long Run Aggregate Supply Aggregate Demand increases Output
39 Whatisaggregatesupply? When firms face rise in demand they can either increase output and salesorraiseprices.raisestheissue-howdofirmssetprices? Standard theory says that prices are set as a mark up over marginal costs(cost of producing extra unit of output). Economists propose two sets of arguments over why prices may not rise in response to stronger demand (or at least only partially such that output fluctuates) - Real rigidities - the idea here is that marginal costs do not change much over the business cycle and nor does the mark up firms wish to charge - Nominal rigidities - firms have to pay costs (reprinting menus, catalogues, etc)
40 Price Constant marginal cost and mark up mean price does not change over cycle. Price Rising costs (overtime, etc) or means upward sloping supply curve. Output Price Output No scope for higher output. Prices adjust fully. Only prices change. Output
41 Frequency of Price Changes per Year More than Source: Survey of U.K. firms
42 Initial Response to demand increase Overtime More Workers Increase Prices Increase Capacity Increase Sub-contractors Increase delivery lags Other Source: Survey of U.K. firms
43 Theshortrunequilibrium Prices Aggregate Demand Curve Short Run Supply Curve Output
44 Demanddrivencycles Prices Aggregate Demand Curve Expansion Short Run Supply Curve Recession Output
45 Fromshorttolongrunequilibrium Prices Long Run Supply Curve Long run equilibrium Short Run Supply Curve Short run equilibrium Dynamics after a permanent shock to aggregate demand [eg. permanent increase in the money supply] Aggregate Demand Curve Output
46 Demanddrivencycles Changes in demand lead to higher output as firms change output rather than prices to meet demand. In the very short run the increase in demand is met by lowering inventories rather than increasing output. However in the short run firms start to hire more workers/overtime to meet demand. Employment and output increase. Eventually the firm cannot expand output further - capacity constraints, rising overtime/wages, etc and so raises prices to restrain demand. Demand begins to fall and eventually prices rises sufficiently for output to return to level determined by long run aggregate supply curve. Note if the demand shock is only transitory, output goes back to long run equilibrium without further rise in prices.
47 Aggregatesupplyshocks Have focused on aggregate demand as a cause of business cycles but business cycles maybe generated by aggregate supply changes. Supply may not increase smoothly, because the process of capital accumulation is uneven or because technological progress is subject to shocks. Supply can also vary due to other changes in marginal costs of producing (pressure on wags by unions, costs of intermediary inputs such as energy ). A typical example is an increase in oil prices. Note that there may be shocks to the short-term aggregate supply curve as well as to aggregate demand(e.g pressure on wages, tax increases).
48 Supplydrivencycles Prices Aggregate Demand Curve Recession Short Run Supply Curve Expansion Output
49 Oilshockandaggregatesupply Aggregate Demand Curve Prices Recession Rising oil prices Short Run Supply Curve Output An increase in the price of oil means firm is making less profit per unit of output and so will wish to supply less (rising marginal costs). In other words an increase in oil prices shifts the aggregate supply curve to the left.
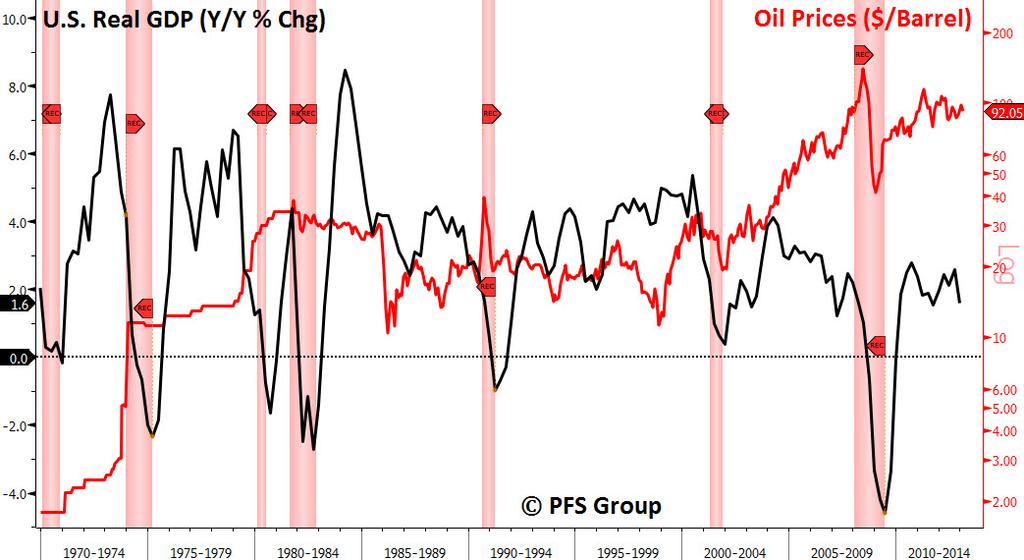
50 Oilandthebusinesscycle
51 Oilandthebusinesscycle Jim Hamilton, Univ. Of California: Beforelastrecession,evidenceisthatnineoutoftenofpostWWIIrecessionsin theushavebeenprecededbyincreaseinoilprices Butbecareful!priceofoilisnot exogenous/drivenbyglobaldemand difficult to identify an exogenous oil shock Need to look at exogenous disruption of supply to identify the impact of the shock.
52 The business cycle and oil
53 Oilandthe(last) Greatrecession Whereas historical oil price shocks were primarily caused by physical disruptions of supply, the price run-up of was caused by strong demand confronting stagnating world production. Hamilton: although the causes were different, the consequences for the economy appear to have been very similar to those observed in earlier episodes, with significant effects on overall consumption spending and purchases of domestic automobiles in particular. In the absence of those declines, it is unlikely that we would have characterized the period 2007:Q4 to 2008:Q3 as one of economic recession for the U.S. The experience of shouldthusbeaddedto the listofrecessionstowhichoilpricesappeartohave made a material contribution.
54 Summary Business cycles are medium term fluctuations in the economy between expansions and recessions. Business cycles last around 6-10 years. Business cycle characterised by co-movements across sectors and aggregate variables. Employment and investment and investment are very exposed to the business cycle. Business cycle fluctuations in output can be caused by demand and supply shocks. Shocks to aggregate demand affect output due to sticky prices and a non-vertical short-run supply curve.
Knowledge Exchange Report. Economic Impact of Mandatory Overtime on New York State Agriculture
 Farm Credit East Knowledge Exchange Report September, 2014 Economic Impact of Mandatory Overtime on New York State Agriculture The New York State Legislature and Governor Andrew Cuomo are considering legislation
Trends in. U.S. Delivered Coal Costs: July 2012
 Trends in U.S. Delivered Coal Costs: 2004-2011 July 2012 By Teresa Foster, William Briggs and Leslie Glustrom Version 1.1 Inquiries or corrections to info@cleanenergyaction.org 1 2 Table of Contents INTRODUCTION...
Asphalt Pavement Mix Production Survey On Reclaimed Asphalt Pavement, Reclaimed Asphalt Shingles, And Warm-mix Asphalt Usage:
 Asphalt Pavement Mix Production Survey On Reclaimed Asphalt Pavement, Reclaimed Asphalt Shingles, And Warm-mix Asphalt Usage: 2009-2010 Appendix A Purpose The National Asphalt Pavement Association is working
Other examples: tourism (lodging, car rental, etc.), tobacco and alcoholic beverage excise, real estate transfer
, tobacco and alcoholic beverage excise, real estate transfer") Local Option Taes Local option taes are taes levied with state approval by municipalities, county, and special district governments including school districts. Forty-three states authorize local option
Local Option Taes Local option taes are taes levied with state approval by municipalities, county, and special district governments including school districts. Forty-three states authorize local option
Milk Production. January Milk Production up 2.7 Percent
 Milk Production ISSN: 9-557 Released February, 07, by the National Agricultural Statistics Service (NASS), Agricultural Statistics Board, United States Department of Agriculture (USDA). January Milk Production
CALCULATING THE SUPPLEMENTAL NUTRITION ASSISTANCE PROGRAM (SNAP) PROGRAM ACCESS INDEX: A STEP-BY-STEP GUIDE FOR 2013
 PROGRAM ACCESS INDEX: A STEP-BY-STEP GUIDE FOR 2013") Food and Nutrition Service January 2015 CALCULATING THE SUPPLEMENTAL NUTRITION ASSISTANCE PROGRAM (SNAP) PROGRAM ACCESS INDEX: A STEP-BY-STEP GUIDE FOR 2013 Introduction The Program Access Index (PAI)
Food and Nutrition Service January 2015 CALCULATING THE SUPPLEMENTAL NUTRITION ASSISTANCE PROGRAM (SNAP) PROGRAM ACCESS INDEX: A STEP-BY-STEP GUIDE FOR 2013 Introduction The Program Access Index (PAI)
Q October-December. Jobs Outlook Survey Report. Published by the Society for Human Resource Management
 Q4 2013 October-December Jobs Outlook Survey Report Published by the Society for Human Resource Management JOBS OUTLOOK SURVEY REPORT Q4 2013 (October-December) OPTIMISM ABOUT JOB GROWTH IN Q4 2013 (OCTOBER-DECEMBER)
Industrial Energy Efficiency as a Resource by Region
 Industrial Energy Efficiency as a Resource by Region Garrett Shields and Robert D. Naranjo, BCS Incorporated Sandy Glatt, U.S. Department of Energy ABSTRACT The energy intensity of specific manufacturing
The Denver Water System
 The Denver Water System Established in 1918 Unique structure Serves 1.3 million people 25% of Colorado s population System footprint - 4,000 square miles (2.5 million acres) 19 raw water reservoirs Critical
NEAUPG Annual Fall Meeting
 NEAUPG Annual Fall Meeting 1 Presentation Overview What does it mean to be Sustainable? What asphalt technologies are considered Sustainable and why? Why do we need to quantify our impact? What tools are
Steers weighing 500 pounds and over, as of January 1, 2018, totaled 16.4 million head, down slightly from January 1, 2017.
 Cattle ISSN: 1948-90 Released January 31, 2018, by the National Agricultural Statistics Service (NASS), Agricultural Statistics Board, United States Department of Agriculture (USDA). January 1 Cattle Inventory
U.S. Political Activity & Public Policy Report 2012
 U.S. Political Activity & Public Policy Report 2012 Best Buy Co., Inc. 2012 Best Buy engages in the political process by developing and advocating public policy positions that directly impact our employees,
U.S. Political Activity & Public Policy Report 2011
 U.S. Political Activity & Public Policy Report 2011 Best Buy Co., Inc. 2011 Best Buy engages in the political process by developing and advocating public policy positions which directly impact our employees,
Internet Appendix for The Impact of Bank Credit on Labor Reallocation and Aggregate Industry Productivity
 Internet Appendix for The Impact of Bank Credit on Labor Reallocation and Aggregate Industry Productivity John (Jianqiu) Bai, Daniel Carvalho and Gordon Phillips * June 4, 2017 This appendix contains three
Electronic Check Service Quick Reference Guide
 Electronic Check Service Quick Reference Guide VeriFone Omni & Vx Series Using the RDM EC6000i VeriFone Omni & Vx Series Using the RDM EC6000i Image Settlement/Upload Check images are settled/uploaded
Legislative Trends: Upcoming Increases to Minimum Wage Round-up 2018
 Legislative Trends: Upcoming Increases to Minimum Wage Round-up 2018 While the last federal minimum wage increase was on July 24, 2009, when it rose from $6.55 to $7.25 per hour, many state and local governments
Facts on Direct-to-Consumer Food Marketing
 United States Department of Agriculture Agricultural Marketing Service May 2009 Facts on Direct-to-Consumer Food Marketing Incorporating Data from the 2007 Census of Agriculture Written by: Adam Diamond
Updated State-level Greenhouse Gas Emission Coefficients for Electricity Generation
 Updated State-level Greenhouse Gas Emission Coefficients for Electricity Generation 1998-2000 Energy Information Administration Office of Integrated Analysis and Forecasting Energy Information Administration
Trends in. U.S. Delivered Coal Costs: October 2013
 Trends in U.S. Delivered Coal Costs: 2004-2012 October 2013 By Teresa Foster and Leslie Glustrom Inquiries or corrections to info@cleanenergyaction.org 1 2 TABLE OF CONTENTS Introduction... 5 UNITED STATES
Q October-December. Jobs Outlook Survey Report. Published by the Society for Human Resource Management
 Q4 2012 October-December Jobs Outlook Survey Report Published by the Society for Human Resource Management JOBS OUTLOOK SURVEY REPORT Q4 2012 (October-December) OPTIMISM ABOUT JOB GROWTH IN Q4 2012 (OCTOBER-DECEMBER)
Potential Impacts to Texas of EPA s Clean Power Plan. Brian Tulloh Austin Electricity Conference April 9, 2015
 Potential Impacts to Texas of EPA s Clean Power Plan Brian Tulloh Austin Electricity Conference April 9, 2015 Luminant Is Texas Largest Competitive Power Generator 15.4 GW of generation capacity: 8.0 GW
Methodology. Respondents. Survey Process
 Methodology The 2011 ABA Compensation & Benefits Survey was designed to meet the needs of banks across the nation. The survey was administered by enetrix, A Division of Gallup, Inc., and an invitation
TABLE OF CONTENTS ONLY
 TABLE OF CONTENTS ONLY Business Continuity Compensation Report - United States of America Compensation Review May 2017 Benchmarking. Plan Ahead. Be Ahead. Data collected between January March 2017 with
130 Million Reasons to Develop a Green Workforce
 130 Million Reasons to Develop a Green Workforce An Overview of the BPI Credentialing Process Larry Zarker Building Performance Institute Home Performance Contracting is the Low Hanging Fruit in the Clean
States Use Gentle Hand in Taxing Timberland
 March 2009 No. 164 FISCAL FACT States Use Gentle Hand in Taxing Timberland By Travis Greaves In the realm of real property taxation, the best-known tax is on residential property. Every U.S. homeowner
Fatal Occupational Injuries in Maine, 2008
 MAINE DEPARTMENT OF LABOR Fatal Occupational Injuries in Maine, 2008 An Annual Report September 2009 By: Ann Beaulieu D EPARTMENT OF L ABOR B UREAU OF L ABOR STANDARDS 45 STATE HOUSE STATION AUGUSTA, MAINE
Survey of Mineral Admixtures and Blended Cements in Ready Mixed Concrete
 Survey of Mineral Admixtures and Blended Cements in Ready Mixed Concrete A survey of concrete producers to quantify the use of cement, admixtures and blended cements in ready mixed concrete. October 2000
FREIGHT POLICY TRANSPORTATION INSTITUTE. Spatial Patterns in Household Demand for Ethanol Hayk Khachatryan, Ken Casavant and Eric Jessup
 FREIGHT POLICY TRANSPORTATION INSTITUTE Spatial Patterns in Household Demand for Ethanol Hayk Khachatryan, Ken Casavant and Eric Jessup Spatial Patterns in Household Demand for Ethanol Hayk Khachatryan,
THE VALUE OF DATA CONSEQUENCES FOR INSIGHT, INNOVATION & EFFICIENCY IN THE US ECONOMY DECEMBER 2015 COMMISSIONED BY. John Deighton
 THE VALUE OF DATA // 2015 CONSEQUENCES FOR INSIGHT, INNOVATION & EFFICIENCY IN THE US ECONOMY DECEMBER 2015 John Deighton Baker Foundation Professor of Business Administration Harvard Business School and
A HYPOTHETICAL US SPORTS GAMBLING MARKET. Richard A. McGowan & John F. Mahon
 A HYPOTHETICAL US SPORTS GAMBLING MARKET Richard A. McGowan & John F. Mahon Recap: Why this topic? I believe that sports betting should be brought out of the underground and into the sunlight where it
This document was posted with the permission of the Committee on Women in Society and in the Church United States Conference of Catholic Bishops
 This document was posted with the permission of the Committee on Women in Society and in the Church United States Conference of Catholic Bishops WOMEN IN DIOCESAN LEADERSHIP POSITIONS: PROGRESS REPORT,
Pocket Planners :00am - 4:30pm Eastern Time
 CUSTOMIZED Calendars GORDON BERNARD COMPANY, LLC SINCE 1949 Gordon Bernard Company Customer Service 1.800.531.1484 8:00am - 4:30pm Eastern Time Pocket Planners A Gordon Bernard Company Pocket Planner is
TABLE OF CONTENTS ONLY
 TABLE OF CONTENTS ONLY Business Continuity Compensation Report - United States of America Compensation Review July 2015 Benchmarking. Plan Ahead. Be Ahead. Data collected between February May 2015 with
The Clean Power Plan NJ Clean Air Council Meeting
 M.J. Bradley & Associates The Clean Power Plan NJ Clean Air Council Meeting D E C E M B E R 9, 2 0 1 5 DRAFT FOR DISCUSSION PURPOSES ONLY Chris Van Atten vanatten@mjbradley.com (978) 369 5533 / www.mjbradley.com
A Model Modernization: Edith Green-Wendell Wyatt Federal Building and GSA s Mid-Century Inventory
 A Model Modernization: Edith Green-Wendell Wyatt Federal Building and GSA s Mid-Century Inventory Leslie Shepherd, Chief Architect, General Services Administration Les Shepherd, FAIA Chief Architect General
LESSON 9. Economic Fluctuations: Balancing Aggregate Demand and Supply
 LESSON 9 Economic Fluctuations: Balancing Aggregate Demand and Supply Assigned Reading 1. Mankiw, N. Gregory, et al. 2011. Principles of Macroeconomics (5 th Canadian Edition). Toronto: Thomson Nelson.
Research Brief. Participation in Out-Of- School-Time Activities and Programs. MARCH 2014 Publication # OVERVIEW KEY FINDINGS. childtrends.
 MARCH 2014 Publication #2014-13 Participation in Out-Of- School-Time Activities and Programs OVERVIEW Kristin Anderson Moore, Ph.D., David Murphey, Ph.D., Tawana Bandy, M.S., and P. Mae Cooper, B.A. Children
Interstate Movement Of Municipal Solid Waste
 1.S: P'E C I A L R E P 0 R T: 2 Interstate Movement Of Municipal Solid Waste February 1992 The United States has an intricate web of beneficial interstate movements of municipal solid waste. Where interstate
Climate Regulation in the United States
 Climate Regulation in the United States Karen Palmer IAEE/USAEE International Conference Plenary: Climate Change and Carbon Policies -International Lessons and Perspectives June 17, 2014 A Little History
A Study of United States Hydroelectric Plant Ownership
 INL/EXT-06-11519 A Study of United States Hydroelectric Plant Ownership Douglas G. Hall, INL Project Manager Kelly S. Reeves, NPS June 2006 The INL is a U.S. Department of Energy National Laboratory operated
GUIDE TO STATE VOTING LAWS
 Alabama Up to one hour specified by employer to vote in municipal, county, state, or federal primary or election. Employee must give reasonable notice to employer; leave requirement does not apply if employee's
PHMSA Update on Public Awareness
 PHMSA Update on Public Awareness 2010 Western Regional Gas Conference August 24, 2010 Tom Finch PHMSA - Western Region CATS Manager Overview PHMSA Mission and Scope Why Public Awareness Public Awareness
MARKETING AND POLICY BRIEFING PAPER
 MARKETING AND POLICY BRIEFING PAPER Department of Agricultural and Applied Economics, College of Agricultural and Life Sciences, University of Wisconsin-Madison Cooperative Extension, University of Wisconsin-Extension
EXECUTIVE SUMMARY The 2016 State Energy Efficiency Scorecard
 EXECUTIVE SUMMARY The 2016 State Energy Efficiency Scorecard The past year has been an exciting time for energy efficiency, with several states strengthening efficiency policies and programs, and policymakers
GUIDELINE FOR SELECTING AND MODIFYING THE OZONE MONITORING SEASON BASED ON AN 8-HOUR OZONE STANDARD
 United States Office of Air Quality EPA-454/R-98-00 Environmental Protection Planning and Standards June 998 Agency Research Triangle Park, NC 277 Air GUIDELINE FOR SELECTING AND MODIFYING THE OZONE MONITORING
Ross Stores, Inc. Investor Overview November 2017
 Ross Stores, Inc. Investor Overview Disclosure of Risk Factors Forward-Looking Statements: This presentation contains forward-looking statements regarding expected sales, earnings levels, and other financial
JAN-SAN MRO DATA ESTIMATED END-USER DEMAND BY REGION & END-MARKET
 $1,995.00 2014 U.S. MARKET ANALYSIS: JAN-SAN MRO DATA ESTIMATED END-USER DEMAND BY REGION & END-MARKET e l p m a S researched & produced by: www.imidata.com www.mdm.com 2014 by Gale Media Inc. All rights
DFARS Procedures, Guidance, and Information
 (Revised November 4, 2016) PGI F, PART 2--CONTRACT QUALITY ASSURANCE ON SHIPMENTS BETWEEN CONTRACTORS PGI F-201 Procedures. (1) Use the supplier's commercial shipping document/packing list to enter performance
Size and Distribution of Contract Hog Production in Iowa
 Economic Staff Paper Series Economics 9-1991 Size and Distribution of Contract Hog Production in Iowa Michele Rummens Iowa State University James B. Kliebenstein Iowa State University, jklieben@iastate.edu
Franchise.Org IFA Franchisor Member Packages
 Average Monthly Unique Visitors: 150,000 Average Page Views Per Visitor: 14 Total Annual Page Views: 25,200,000 Average Time Spent on Franchise.org: 8 minutes Average Number of Leads Processed Per Month:
Farm Radio Habits Wave 1, Winter Conducted by Millennium Research, Inc.
 Farm Radio Habits Wave 1, Winter 2015 Conducted by Millennium Research, Inc. TAKE A PICTURE OF THE RADIO YOU LISTEN TO THE MOST OFTEN? 2 Radio Is An Important Part Of Farmers And Ranchers Day I started
BRAND REPORT FOR THE 6 MONTH PERIOD ENDED JUNE 2016
 BRAND REPORT FOR THE 6 MONTH PERIOD ENDED JUNE 2016 No attempt has been made to rank the information contained in this report in order of importance, since BPA Worldwide believes this is a judgment which
GUIDE TO STATE VOTING LAWS
 Alabama One hour specified by employer to vote in municipal, county, state, or federal primary or election. Employee must give reasonable notice to employer; leave requirement does not apply if employee's
John F. Kennedy Adminisitration Collection: Records of the U.S. Office of Emergency Planning, Author Index
 All Regional Offices Called and Alerted, Senior Watch Duty Began, Octcber 21, 1962, 8:20 p.m. Briefing of Agencies Having Support Functions under Department of the Treasury. Committee on Civil Defense
U.S. Census Bureau Lumber Production and Mill Stocks MA321T(07) Issued May 2008
 Issued May 2008") U.S. Census Bureau Lumber Production and Mill Stocks - 2007 MA321T(07) Issued May 2008 Address inquiries concerning these data to Primary Goods Industries Branch, U.S. Department of Commerce, Census Bureau,
U.S. Census Bureau Lumber Production and Mill Stocks - 2007 MA321T(07) Issued May 2008 Address inquiries concerning these data to Primary Goods Industries Branch, U.S. Department of Commerce, Census Bureau,
Clean and Secure Energy Actions Report 2010 Update. GHG Policies
 Alabama Alaska Arizona Arkansas California Colorado Connecticut Delaware Florida Georgia Participant in Climate Registry; climate action plan: Policy Planning to Reduce Greenhouse Gas Emissions in Alabama
Forecasting motor gasoline consumption in the United States
 Forecasting motor gasoline consumption in the United States Melissa Lynes* Industry Economist U.S. Energy Information Administration 1000 Independence Ave., S.W. Washington, DC 20585 Melissa.Lynes@EIA.gov
NCAT Pavement Test Track. Buzz Powell Pavement Preservation Research
 NCAT Pavement Test Track Buzz Powell Pavement Preservation Research NCAT Pavement Test Track Washington Montana Oregon Idaho Wyoming Nevada Utah Colorado California New Mexico Arizona Pre-2015, 2015 North
Customer Information Sheet
 Customer Information Sheet General Information Billing Name Ship to location City State/Zip City State/Zip Telephone Website URL Account Type (Circle one) Retail Store Residential Designer To-The-Trade
ENERGY STAR Oil Furnaces Product List
 ENERGY STAR Oil Furnaces Product List Below are currently qualified ENERGY STAR models available for sale in the U.S. and Canada * Air Leakage data was not collected under the Version 3.0 ENERGY STAR Program
Land Values and Cash Rents
 United States Department of Agriculture National Agricultural Statistics Service Land Values and Cash Rents 2009 Summary August 2009 ISSN: 19491867 Contents Agricultural Land Values Highlights... 4 U.
SUBJECT: Request for Input from Livestock Producer Groups
 United States Department of Agriculture Farm and Foreign Agricultural Services Risk Management Agency May 14, 2001 INFORMATIONAL MEMORANDUM: R&D-01-023 TO: FROM: Livestock Producer Groups All Risk Management
The Contributions of Insulation to the U.S. Economy in 2016
 The Contributions of Insulation to the U.S. Economy in 2016 Economics & Statistics Department American Chemistry Council February 2017 TABLE OF CONTENTS EXECUTIVE SUMMARY... 2 THE INSULATION INDUSTRY IN
Crop Production ISSN:
 Crop Production ISSN: 1936-3737 Released August 12, 2014, by the National Agricultural Statistics Service (NASS), Agricultural Statistics Board, United States Department of Agriculture (USDA). Corn Production
Radiology Staffing Survey 2010
 Radiology Staffing Survey 2010 A Nationwide Survey of Registered Radiologic Technologists Conducted by the American Society of Radiologic Technologists Reported June 2010 2010 ASRT. All rights reserved.
December 7, Dear Member of Congress:
 December 7, 2015 Dear Member of Congress: On behalf of the Partnership to Protect Workplace Opportunity (the Partnership) and the undersigned 164 state, local, and national organizations, we write to ask
Franchise.Org IFA Supplier Member Packages
 Average Monthly Unique Visitors: 150,000 Average Page Views Per Visitor: 14 Average Time Spent on Franchise.org: 8 minutes Average Monthly Supplier Profile Searches: 22,000 Total Direct Visits Delivered
Copyright 2017 by the UBC Real Estate Division
 DISCLAIMER: This publication is intended for EDUCATIONAL purposes only. The information contained herein is subject to change with no notice, and while a great deal of care has been taken to provide accurate
LOW-LEVEL RADIOACTIVE WASTE FORUM, INC.
 LOW-LEVEL RADIOACTIVE WASTE FORUM, INC. 2657 Bayview Drive Ft. Lauderdale, FL 33306 (754) 779-7551 * (754) 223-7452 FAX Prepared by the Disused Sources Working Group of the Low-Level Radioactive Waste
BioCycle is pleased to produce the
 Curbside Programs 10,000 15th NATIONWIDE SURVEY OF MUNICIPAL SOLID WASTE MANAGEMENT IN THE UNITED STATES 8,000 6,000 4,000 2004 7,689 THE STATE OF GARBAGE 2,000 Yard Trimmings Facilities 4,000 3,000 2,000
1/te,. I FARM INCOME SITUATION
 April 1961 1/te,. I FARM INCOME SITUATION FIS-182 FOR RELEASE APR. 25, P.M. I j h c: I I j i FARM INCOME IN 1961 Farm operators' realized net income in 1961 will be up from 1960, by a billion dollars or
Forest Resources of the United States, 2017: A Technical Document Supporting the Forest Service Update of the 2010 RPA Assessment
 Forest Resources of the United States, 2017: A Technical Document Supporting the Forest Service Update of the 2010 RPA Assessment Abstract Oswalt, Sonja N.; Miles, Patrick D.; Pugh, Scott A.; Smith, W.
SOYBEANS: LARGE SUPPLIES CONFIRMED, BUT WHAT ABOUT 2005 PRODUCTION?
 SOYBEANS: LARGE SUPPLIES CONFIRMED, BUT WHAT ABOUT 2005 PRODUCTION? JANUARY 2005 Darrel Good 2005 NO. 2 Summary USDA s January reports confirmed a record large 2004 U.S. crop, prospects for large year-ending
n. Explanation of a Divergency in Regional Cyclical Variability
 DETERMINANTS OF DIFFERENCES IN REGIONAL CYCLICAL VARIABILITY Stefan C. Norrbin I. Introduction The cyclical movement of macroeconomic variables indicates a relatively smooth process of adjusunent to external
Fiscal Year 2010 Drinking Water and Ground Water Statistics
 Fiscal Year 2010 Drinking Water and Ground Water Statistics U.S. Environmental Protection Agency Office of Ground Water and Drinking Water EPA 817K11001 June 2011 Table of Contents Introduction... 4 Acronyms
Farm to Table: A look into who supports it and its significance in America today
 University of New Hampshire University of New Hampshire Scholars' Repository Honors Theses and Capstones Student Scholarship Spring 2013 Farm to Table: A look into who supports it and its significance
REINFORCING TABLES INSTALLATION MANUAL
 REINFORCING TABLES 201 REINFORCING TABLES Design Limitations Introduction The structural wall reinforcing and lintel design tables contained within the Appendix of NUDURA s Installation Manual have been
Intrepid Potash New Capital Investments Support Future Opportunities
 Intrepid Potash New Capital Investments Support Future Opportunities MMSA Colorado Section September 7, 2012 Presentation Overview Company Overview Capital Investment Overview Presentation of Select Capital
PASS-THROUGH ADJUSTMENTS (NON-DSIC)
") STATE Alabama Alaska Arizona Arkansas PASS-THROUGH ADJUSTMENTS (NON-DSIC) Yes, rate riders are allowed, to recover costs related to the environmental tests required by the Alabama Department of Environmental
STATE Alabama Alaska Arizona Arkansas PASS-THROUGH ADJUSTMENTS (NON-DSIC) Yes, rate riders are allowed, to recover costs related to the environmental tests required by the Alabama Department of Environmental
Digital, Branch, Drive-Through or ATM? Yes, Please! Say Bank Customers in J.D. Power Study
 Digital, Branch, Drive-Through or ATM? Yes, Please! Say Bank Customers in J.D. Power Study Among Millennials, Highest Satisfaction Achieved When Combining Mobile and Branch Banking COSTA MESA, Calif.:
NCAT Pavement Test Track. Buzz Powell
 NCAT Pavement Test Track Buzz Powell NCAT Pavement Test Track Washington Montana Oregon Idaho Wyoming Nevada Utah Colorado California New Mexico Arizona Pre-2015, 2015 North Dakota South Dakota Nebraska
Flour Milling Products
 Flour Milling Products ISSN: 2378-2498 Released February 1, 2018, by the National Agricultural Statistics Service (NASS), Agricultural Statistics Board, United States Department of Agriculture (USDA).
Grain Stocks. Corn Stocks Up 32 Percent from September 2016 Soybean Stocks Up 53 Percent All Wheat Stocks Down 11 Percent
 Grain Stocks ISSN: 949-095 Released September 9, 07, by the National Agricultural Statistics Service (NASS), Agricultural Statistics Board, United s Department of Agriculture (USDA). Corn Stocks Up 3 Percent
Solutions in Steel for Plate
 ArcelorMittal USA Solutions in Steel for Plate Company and product overview ArcelorMittal Who we are The world s leading steel company ArcelorMittal is the world s leading steel company with operations
CHAPTER NINE. Operations Management (Production) Manufacturing. Service
 Manufacturing. Service") CHAPTER NINE Operations Management (Production) Manufacturing Service What s Had The Biggest Effect on Productivity? Downsizing Hiring Part-Time Workers Empowering Workers Quality & Customer Satisfaction
CHAPTER NINE Operations Management (Production) Manufacturing Service What s Had The Biggest Effect on Productivity? Downsizing Hiring Part-Time Workers Empowering Workers Quality & Customer Satisfaction
U.S. DEPARTMENT OF LABOR DAVIS-BACON RESOURCE BOOK 11/2002 DB WAGE DETERMINATIONS DAVIS-BACON WAGE DETERMINATIONS
 DAVIS-BACON WAGE DETERMINATIONS DAVIS-BACON ACT, AS AMENDED, AUGUST 30, 1935 (EXCERPT FROM SECTION 1) PHYSICAL INCLUSION OF DAVIS-BACON WAGE DETERMI- NATION(S) IN BID SPECIFICATIONS AND CONTRACT MAJOR
NCAT Pavement Test Track
 NCAT Pavement Test Track Lee Road 159 Buzz Powell Research Update at ND Asphalt Conference US-280 NCAT Pavement Test Track Washington Montana Oregon Idaho Wyoming Nevada Utah Colorado California New Mexico
Unions/Collective Bargaining
 Unions/Collective Bargaining Education Commission of the States 700 Broadway, Suite 1200 Denver, CO 80203-3460 303.299.3600 Fax: 303.296.8332 www.ecs.org State Collective Bargaining Policies for Teachers
August 4, The Honorable Donald J. Trump President 1600 Pennsylvania Avenue, NW Washington, DC Dear Mr. President:
 August 4, 2017 The Honorable Donald J. Trump President 1600 Pennsylvania Avenue, NW Washington, DC 20500 Dear Mr. President: On behalf of the more than 200 organizations representing rural communities,
Collaborative Forest Landscape Restoration Program
 Collaborative Forest Landscape Restoration Program Meg Roessing U.S.D.A. Forest Service Forest Management Staff Washington Office mroessing@fs.fed.us Background: Department and Agency Priority Our shared
Aftermath of Harvey and Irma: Oil Industry Perspective. Southern States Energy Board Charleston, SC September 24, 2017
 Aftermath of Harvey and Irma: Oil Industry Perspective Southern States Energy Board Charleston, SC September 24, 2017 API plays two primary roles for the industry in preparing for hurricanes. First, API
SOYBEANS: FOCUS ON SOUTH AMERICAN AND U.S. SUPPLY AND CHINESE DEMAND
 SOYBEANS: FOCUS ON SOUTH AMERICAN AND U.S. SUPPLY AND CHINESE DEMAND APRIL 2002 Darrel Good 2002-NO.4 Summary Soybean prices during the first half of the 2001-02 marketing year were well below the prices
Michigan Competitiveness: Creating an Economic Strategy in a Time of Austerity
 Michigan Competitiveness: Creating an Economic Strategy in a Time of Austerity Professor Michael E. Porter Harvard Business School Mackinac Policy Conference June 2, 2011 For further materials on the competitiveness
Apples had the highest total value of pollination of crops reported in Region 5 during in The price per colony
 Cost of Pollination ISSN: 475-435 Released December, 07, by the National Agricultural Statistics Service (NASS), Agricultural Statistics Board, United States Department of Agriculture (USDA). Cost per
IZAAK WALTON LEAGUE OF AMERICA
 IZAAK WALTON LEAGUE OF AMERICA ACKNOWLEDGEMENTS The Izaak Walton League of America gratefully acknowledges the generous financial support of long-time member Carl Keeler. Carl s support made this report
Lecture 10: THE AD-AS MODEL Reference: Chapter 8
 Lecture 10: THE AD-AS MODEL Reference: Chapter 8 LEARNING OBJECTIVES 1.What determines the shape of the aggregate demand (AD) curve and what factors shift the entire curve. 2.What determines the shape
Asphalt Pavement Industry Survey on
 Asphalt Pavement Industry Survey on Recycled Materials and Warm-Mix Asphalt Usage 2016 Information Series 138 7th Annual Survey This document is disseminated under the sponsorship of the U.S. Department
Whoa Tornado just hit my DC! Now what do I do???
 Whoa Tornado just hit my DC! Now what do I do??? Gerry Greenleaf Vice President Distribution & Transportation & Lou DeLorenzo Regional Director of Distribution TPA Supply Chain Conference January 23, 2012
ARGUABLY the most important entity
 The Environmental Protection Agency ARGUABLY the most important entity in the United States in terms of environmental health is the Environmental Protection Agency. The work of the EPA ensures a healthy
2007 EXECUTIVE SUMMARY
 SHRM Human Capital Benchmarking Study 2007 EXECUTIVE SUMMARY Also available: SHRM Customized Benchmarking Service o Database of more than 3,000 organizations o To order a complete analysis of the results