CHAPTER INTRODUCTION TO MANAGERIAL ACCOUNTING-OVERVIEW OF COST ACCOUNTING
|
|
|
- Homer Golden
- 5 years ago
- Views:
Transcription
1 CHAPTER 1 INTRODUCTION TO MANAGERIAL ACCOUNTING-OVERVIEW OF COST ACCOUNTING
2 Definition of Management Accounting: The Managerial Accounting is another name of Management Accounting so we have been using Management Accounting in our discussion throughout. Management Accounting may be defined as the Process of identification, measurement, accumulation, analysis, preparation, interpretation and communication of information (both financial & operating) used by the management to plan, evaluate and control within an organization and to assure use of and accountability for its resources. (IMAP by FMAC pg: 37) Management accounting, therefore, is an integral part of organization process. It provides information essential for: Controlling the current activities of an organization Planning its future strategies, tactics and operations Optimizing the use of its resources Measuring and evaluating performance Reducing subjectivity in the decision making process and Improving internal and external communication The Concept: Accountability: Management accounting presents information measuring the achievement of the objectives of an organization and appraising the conduct of its internal affairs in that process. In order that further action necessary can be taken, based on this information, it is necessary at all times to identify the responsibilities and key result areas of the individuals within the organization. Controllability: Management accounting identifies the elements of activities which management can or cannot influence, and seeks to assess the risk and sensitivity factors. This facilitates the proper monitoring, analysis, comparison and interpretation of information which can be used constructively in the control, evaluation and corrective functions of management. Reliability: Management accounting information must be of such quality that confidence can be placed in it. Its reliability to the user is dependent on its source, integrity and comprehensiveness. Interdependency: Management accounting, in recognition of the increasing complexity of business, must access both external and internal information sources from interactive functions such as marketing, production, personnel, procurement, finance, etc. This assists in ensuring that the information is adequately balanced
3 Relevancy: Management accounting must ensure that flexibility is maintained in assembling and interpreting information. This facilitates the exploration and presentation, in a clear, understandable and timely manner, of as many alternatives as are necessary for impartial and confident decisions to be taken. The process is essentially forward looking and dynamic. Therefore, the information must satisfy the criteria of being applicable and appropriate. Evolution of Management Accounting: (IMAP by FMAC pg: 37) The field of organizational activity encompassed by management accounting has developed through four recognizable stages. Stage 1 Prior to 1950, the focus was on cost determination and financial control, through the use of budgeting and cost accounting technologies. Stage 2 By 1965 the focus have been shifted to the provision of information for management planning and control, through the use of such technologies as decision analysis and responsibility accounting: Stage 3 By 1985, attention was focused on the reduction of waste in resources used in business processes, through the use process analysis and cost management technologies. Stage 4 By 1995, attention had shifted to the generation or creation of value, through the use of technologies which examine the drivers of customer value, shareholder value, and organizational innovation. While these four stages are recognizable, the process of change from one to another has been evolutionary. Cost determination and financial control Information for management Planning and control Reduction of waste of resources in business processes Creation of value through effective resource use (IMAP by FMAC pg: 29)
4 Comparison of Financial Accounting with Managerial Accounting:- Financial Accounting 1- Origin Since Double Entry book keeping System. 2. Purpose The main purpose of Financial Accounting is to prepare profit and loss account and balance sheet. Management Accounting From 19 th century. The main purpose of management accounting is to provide detailed information. 3. Target Group 4. Statutory Requirements 5. Analysis of Cost and Profit 6. Period of reporting 7. Control Aspect Reporting to owner and outside agencies These accounts have to be prepared according to the legal requirements of Companies Acts. Financial account reveal the profit or loss of the business as a whole during a particular period. It does not show the figure of cost and profit for individual products, departments and processes. Financial Statements are prepared periodically, usually on an annual basis. It lays emphasis on the recording of financial transactions and does not attach any importance to control aspect. Mainly to management Maintenance of these accounts is voluntary. Managerial accounts show the detailed cost and profit data for each product line,department, process etc. Management Reporting is a continuous process that may be daily, monthly, as required by management. It provides for a detailed system of controls with the help of certain special techniques like standard costing and budgetary control. 8. Nature It is concenrned almost exclusively with historical records. The historical nature of financial accounting can be easily understood in the context of the purposes for which it was designed. It is concenrned not only with historical costs but also with predetermined costs. This is because management accounting does not end with what has happened in the past. 9-Audit 10. International Standards There is an audit requirement of financial statements. There are international accounting standards to be followed. There is no such audit requirements.cost audit concept is getting importance in some countries. There are few guidelines issued by MAC(Management Accounting Committee).
5 Role of a Management Accountant:- Traditional Role: In a traditional role, the Management Accountant is primarily concerned with the application of accounting techniques and to the provision of information designed to assist all levels of management in planning, reporting and controlling the activities of the organization. Dynamic Role: In today s business environment, role of a Management Accountant is much more dynamic than his traditional role. This is to create and enhance value of the organization through stakeholders. This concept of value creation gives Management Accountant a more dominant position in the organization. It includes: Suggesting ways and means to add more value Involvement in facilitating change processes in the organization Being a business advisor and not just a corporate policeman. Complete understanding of organizational strategy, helping to solve problems and functioning as an effective member of cross-functional teams. Being pro-active by following Feedforward control (i.e. forecasting of differences between actual and planned outcomes, and the implementation of action, before the event, to avoid such differences. Being able to address not only real concerns but also the perceived concerns, described to include timeliness and trustworthiness. Fully participating in members of the Management team, playing pivotal role in achievement of business objectives by expertise and diversified knowledge. Playing effective role in Project Management Preparing cashflow on the basis of realistic assumptions to determine debt-servicing capability. Monitoring of growth initiatives and planning Conducting SWOT Analysis Strengthening the role as Cost auditor Assisting the government in developing audit process for income tax and sales tax. (Management Accountant Executive Summary by Ali Imran Siddiqui Pg: 34) Management Audit in a dynamic business environment: A systematic assessment of methods and policies of an organization s management in the administration and the use of resources, tactical and strategic planning, and employee and organizational improvement The objectives of a management audit are to 1. Establish the current level of effectiveness 2. Suggest improvements 3. Lay down standards for future performance
6 Management auditors (employees of the company or independent consultants) do not appraise individual performance, but may crtitically evaluate the senior executives as a management team.
7 CHAPTER 2 COST CLASSIFICATION IN MANAGEMENT ACCOUNTING PERSPECTIVE
8 1. Classification according to function: Manufacturing cost Administration cost Selling and distribution costs Financial costs Research and development costs 2. Classification according to variability Fixed Cost Variable Cost Semi-variable or semi-fixed costs 3. Classification according to identifiability with cost units: Direct costs Indirect costs 4. Classification according to controllability Controllable costs Uncontrollable Costs 5. Classification on the basis of time. Historical costs Predetermined Costs 6. By department 7. Budgeted Cost and Standard Costs 8. For Analytical Process 1. Functional Classification:- This is a traditional classification. A business has to perform a number of functions like manufacturing, administration, selling, distribution and research. Cost may have to be ascertained for each of these functions. On this basis, costs are classified into the following groups: a) Manufacturing Cost: Also named Production Cost or factory cost. This is the cost of the sequence of operations which begins with supplying materials, labour and services and ends with completion of production.
9 b) Administration Cost: This is general administrative cost and includes all expenditure incurred in formulating the policy, directing the organization and controlling the operations of an undertaking, which is not directly related to production, selling and distributions, research and development activity of function. c) Selling & distribution costs: Selling cost is the cost of seeking to create and stimulating demand and securing orders. Distribution cost is the cost of sequence of operations which begins with making the packed product available for despatch and ends with making the re-conditioned returned empty package for re-use. d) Financial Cost: It includes Interest/mark-up, bank charges and various fees paid to lenders for borrowing funds. e) Research and development cost: Research cost is the cost of searching new or improved products or methods. It includes the cost incurred at Pre-production stage which is the core focus of Life Cycle Costing. 2. Behavioural Classification:- Costs sometimes have a definite relationship to volume of production. They behave differently when volume of production rises or falls. As such they are described as fixed, variable and semi-variable or semi-fixed. a) Fixed Cost: These cost remain fixed in total amount and do not increase or decrease when the volume of production changes. But the fixed cost per unit decreases when volume of production increases and vice versa. (a) (b) Total Fixed Cost (Rs.) Unit Fixed Cost (Rs.) FIGURE 2.1 Fixed Costs (a) total; (b) unit Activity Level Activity Level (Colin Drury Cost & Management Accounting 7 th edition, pg: 38)
10 The characteristics of fixed cost are: 1. Fixed in total amount within a relevant output range 2. Increase or decrease in per unit fixed cost when quantity of production changes 3. Apportioned to departments on some arbitrary basis 4. Controllable by top management 5. Over a long period of time fixed cost is also variable. b) Variable Cost: These costs tend to vary in direct proportion to the volume of output. In other words, when the volume of output increases, the total variable cost will increase and when volume of output decreases, total variable cost also decreases. But the variable cost per unit remains fixed. (a) (b) Total Variable Cost (Rs.) Unit variable Cost (Rs.) Activity Level Activity Level FIGURE 2.2 Variable Costs (a) total; (b) unit The characteristics of variable cost are: (Colin Drury Cost & Management Accounting 7th edition, pg:38) 1. Variability in total amount in direct proportion to the volume of output 2. Fixed amount per unit in the face of changing volume 3. Easy and reasonably accurate allocation and apportionment to departments 4. Controllable by functional managers c) Semi-variable or semi-fixed costs: These costs are partly fixed and partly variable. A semi-variable cost has often a fixed element below which it will not fall at any level of output. The variable element in semi-variable costs changes either at a constant rate or in lumps. For example, introduction of an additional shift in the factory will require
11 additional supervisors and certain costs will increase in lumps. In the case of telephone, there is a minimum rent and after a specified number of calls, the changes are according to the number of calls made. Thus, there is no fixed pattern of behaviour of semi-variable cost. 3. Classification according to identifiability with cost units:- Costs are classified into direct and indirect on the basis of their identifiability with cost units or jobs processes; a) Direct Costs: Those costs that can be specifically and exclusively identified with a particular cost object. b) Indirect Costs: In contrast, those costs which cannot be identified specifically and exclusively with a given cost object. Example: Let us assume that our cost object is a product, or to be more specific a particular type of desk that is manufactured by an organization. In this situation the wood that is used to manufacture the desk can be exclusively and specifically identified with a particular desk and can thus be classified as a direct cost. Similarly, the wages of workers whose time can be traced to the specific desk are a direct cost. In contrast, the salaries of factory supervisors or the rent of the factory cannot be specifically and exclusively traced to a particular desk and these costs are therefore classified as indirect. More examples of indirect costs are repairs, depreciation, managerial salaries. Sometimes, however, direct costs are treated as indirect because tracing costs directly to the cost object is not cost effective. For example, the nails used in manufacturing the desk can be identified specifically with the desk, but, because the cost is likely to be insignificant, the expense of tracing such items does not justify the possible benefits from calculating more accurate product costs. (Colin Drury Cost & Management Accounting 7 th edition, pg: 34) 4. Classification according to Controllability:- Costs can also be classified into controllable and uncontrollable. a) Controllable Costs: is a cost which can be controlled, typically by a cost, profit or investment centre manager. CIMA official Terminology These are the cost which may be directly regulated at a given level of management authority. b) Uncontrollable Costs: These are those costs which cannot be influenced by the action of a specified member of an enterprise.
12 Variable costs are generally controllable by department heads. For example, cost of raw material may be controlled by purchasing in larger quantities. In contrast, fixed costs are generally uncontrollable. For example, it is very difficult to control costs like factory rent, managerial salaries etc. Two important points should be noted regarding this classification. A cost which is not controllable by a junior manager might be controllable by a senior manager. For example, due to excessive overtime working there may be high direct labour costs in a department. The junior manager may feel obliged to continue with the overtime to meet production schedules, but his senior may be able to reduce costs by hiring extra fulltime staff, thereby reducing the requirements for overtime. (CIMA performance Management 3rd edition, pg: 413) A cost which is not controllable by a manager in one department may be controllable by a manager in another department. For example, an increase in material costs may be caused by buying at higher prices than expected (controllable by purchasing department) or by excessive wastage (controllable by production department) or by a faulty machine producing rejects (controllable by the maintenance department). (CIMA performance Management 3rd edition, pg: 413) 5. Classification on the basis of Time:- a) Historical Costs: These are the costs which are ascertained after these have been incurred. Historical costs are thus nothing but actual costs. These costs are not available until after the completion of the manufacturing operations. b) Pre-determined costs: These are future costs which are ascertained in advance of production on the basis of the specification of all the factors affecting cost. 6. Classification by departments:- An organization can be divided into two main departments. Manufacturing departments, which directly engage in the process of production of goods and services and Service departments, which indirectly help the production department in providing services to facilitate production process. 7. Budgeted Cost and standard Costs:- These are predetermined total costs or unit costs of good and service used for control purpose. 8. For analytical process:- Management decisions involve a selection between alternative courses of action and costs play a very prominent role in decision-making. For analytical process, costs are classified as under:
13 a) Differential or Incremental Costs: Differential cost is the increase or decrease in total cost which results from an alternative course of action. It is ascertained by subtracting the cost of one alternative from the cost of another alternative. The alternative choice may arise because of change in method of production, changes in sales volume, change in product mix, make or buy decisions, accept or reject order. Example: Current manufacturing cost of XYZ Co. is Rs.100,000. Due to expansion operations, costs increase by 25%. So this incremental cost of Rs.(100,000*.25 = 25000) is the differential or incremental cost. b) Imputed Costs: These are hypothetical costs which are specifically computed for the purpose of decision making. Interest on capital is a common type of imputed cost. The failure to consider imputed interest cost may result in an erroneous decision. For example, project A requires a capital investment of Rs. 50,000 and project B Rs.40,000. Both the projects are expected to yield Rs. 10,000 as additional profit. Obviously, these two projects are not equally desirable since project B requires less investment and thus should be preferred. c) Opportunity Costs: The value of a benefit sacrificed when one course of action is chosen, in preference to an alternative. The opportunity cost is represented by the foregone potential benefit from the best rejected course of action. CIMA official Terminology Example: Assume a company owns a building which has been fully depreciated in the books of accounts. Yet, it has a rental value of Rs.5000 per annum. Now, if the company is considering the use of this building in a special project a change in lieu of rent of 5000 (opportunity cost) should be included in evaluating the desirability of the project despite the fact that books of accounts show it at nil value. Opportunity cost is a pure decision-making cost and is not entered in the books of accounts. c) Replacement Cost: This is the cost at which there could be purchased an asset identical to that which is being replaced. In simple words, replacement cost is the current market cost of replacing an asset. When the management considers the replacement of an asset, it has to keep in mind its replacement cost and not the cost at which it was purchased earlier. d) Sunk Cost: A sunk cost is cost that has been irreversibly incurred or committed and cannot therefore be considered relevant to a decision. Sunk cost costs may also be deemed irrecoverable costs. CIMA official Terminology Example: An example of a sunk cost could be development costs already incurred. Suppose that a company has spent Rs.250,000 in developing a new service for customers, but the marketing department s most recent findings are that the service might not gain customer acceptance and could be a commercial failure. The decision whether or not abandon the development of the new service would have to be taken, but the Rs. 250,000 spent so far should be ignored by the decision makers because it is a sunk cost. (CIMA performance Management 3 rd edition, pg: 12)
14 e) Out-of-pocket Costs: Out-of-pocket costs represent cash payments to be incurred (such as rent, wages) as against costs which do not require cash outlay (such as depreciation). This is frequently used by business concerns as an aid in making decisions pertaining to price fixation during depression, make or buy decisions, etc. f) Future Costs: No decision can change what has already happened. The past is history and decisions made now can affect only what will happen in the future. Thus, the only relevant costs for decision- making are pre-determined or future costs. But, it is the historical costs which generally provide a basis for computing future costs. g) Discretionary Cost: A discretionary cost is a cost whose amount, within a particular time period, is determined by, and can be altered by, the budget holder. Discretionary fixed costs, such as advertising and research and development costs, are incurred as a result of a top management decision, but could be raised or lowered at fairly short notice (irrespective of the actual volume of production and sales). (CIMA performance Management 3rd edition, Pg: 413) h) Committed Cost: A committed cost is a future cash outflow that will be incurred any way, whatever decision is taken now about alternative opportunities. Committed costs may exist because of contracts already entered into by the organization, which it cannot now avoid. (CIMA performance Management 3 rd edition, Pg: 32)
15 Question No.1 The following information has been taken from the accounting records of Klear-Seal Company for the year 2012 Selling expenses. $140,000 Raw materials inventory, January 1. 90,000 Raw materials inventory, December ,000 Utilities, factory 36,000 Direct labor cost.. 150,000 Depreciation, factory.. 162,000 Purchases of raw materials 750,000 Sales. 2,500,000 Insurance, factory 40,000 Supplies, factory. 15,000 Administrative Expenses ,000 Indirect labor 300,000 Maintenance, factory.. 87,000 Work in process inventory, January ,000 Work in process inventory, December ,000 Finished goods inventory, January 1 260,000 Finished goods inventory, December ,000 Management wants these data organized in a better format so that financial statements can be prepared for the year. Required: 1. Prepare a schedule of cost of goods manufactured. 2. Compute the cost of goods sold. 3. Using data as needed from (1) and (2) above, prepare an income statement.
16 SOLUTION Klear-Seal Company (1). Klear-Seal Company Schedule of Cost of Goods Manufactured For the year ended December 31, 2012 $ Direct materials: Raw material inventory, Jan 1 90,000 Add: purchases of raw material 750,000 Raw material available for use 840,000 Less: raw material inventory, Dec 31 (60,000) Raw material used 780,000 Direct labor 150,000 Manufacturing overhead: Indirect labor 300,000 Supplies, factory 15,000 Utilities, factory 36,000 Insurance, factory 40,000 Depreciation, factory 162,000 Maintenance, factory 87,000 Total manufacturing overhead 640,000 Total manufacturing costs 1,570,000 Add: work in process inventory, Jan 1 180,000 Less: work in process inventory, Dec 31 (100,000) Cost of Goods Manufactured 1,650,000 (2). Klear-Seal Company Schedule of Cost of Goods Sold For the year ended December 31, 2012 $ Finished goods inventory, Jan 1 260,000 Add: cost of goods manufactured 1,650,000 Goods available for use 1,910,000 Less: finished goods inventory, Dec 31 (210,000) Cost of Goods Sold 1,700,000
17 (3). Klear-Seal Company Income Statement For the year ended December 31, 2012 $ Sales 2,500,000 Less: cost of goods sold (1,700,000) Gross margin 800,000 Less: selling& admin costs Selling exp. 140,000 Admin exp. 270,000 Total selling& admin costs (410,000) Net operating income 390,000
18 Question No.2 The records of the Deltex Ltd., show the following information for the quarter ended September 30, 2012 Rs. Material purchased 1,946,700 Direct labor 2,125,800 Factory overhead 764,000 Selling& Distribution expenses 516,000 General and administrative expenses 461,000 Sales (12400 Videos) 6,364,000 Required: 30th STOCKS September 1st oct Rs Rs Raw materials 268, ,000 Finished goods (100 Videos) 43, Videos No unfinished work on hand 1. The cost of goods manufactured. 2. The number of units manufactured 3. The value of closing finished goods inventory 4. The cost of goods sold 5. The unit cost of Videos manufactured 6. An income statement for the period 7. The gross profit per unit sold 8. The net profit per unit sold 9. The ratio of gross profit to sales 10. The profit to sales percentage
19 SOLUTION: Deltex Company (6). Deltex Company Income Statement For the Year ended June 30, 2012 Rs. Sales 6,364,000 Cost of sales Opening stock raw material 268,000 Add: purchases 1,946,700 2,214,700 Less: closing stock raw material 167,000 Cost of material used 2,047,700 Direct labor 2,125,800 Prime cost 4,173,500 Factory overheads 764,000 Cost of Goods Manufactured 4,937,500 Add: opening finished goods 43,000
20 Cost of goods available for sales 4,980,500 Less: closing finished goods (200*395) 79,000 Cost of Goods Sold 4,901,500 Gross profit 1,462,500 Less: selling& distribution expenses 516,000 general& admin expenses 461,000 Expenses 977,000 Net Profit 485,500 (1). Cost of Goods Manufactured Cost of Goods Manufactured = Rs. 4,397,500 (2). Units Manufactured Units manufactured = Sales units + Closing finished goods - Opening finished goods Units manufactured = Units manufactured = 12,500 units (3). Value of Finished Goods
21 Value of finished goods = Cost of goods manufactured per unit*closing finished goods Cost of goods manufactured per unit = Cost of goods manufactured/ Number of units = / = Rs. 395 Value of finished goods = 395*200 Value of finished goods = Rs. 79,000 (4). Cost of Goods Sold Cost of goods sold = Rs. 4,901,500 (5). Unit cost of videos manufactured Unit cost of videos manufactured = Rs. 395 (6). Income Statement at 1 st (7). Gross profit per unit sold Gross profit per unit sold = Gross profit/ Sales units Gross profit per unit sold = / Gross profit per unit sold = Rs (8). Net profit per unit sold
22 Net profit per unit sold = Net profit/ Sales units Net profit per unit sold = / Net profit per unit sold = Rs (9). Ratio of Gross profit to Sales Ratio of gross profit to sales = (Gross profit/ Sales) * 100 Ratio of gross profit to sales = ( / ) * 100 Ratio of gross profit to sales = 22.98% (10). Ratio of Net profit to Sales Ratio of net profit to sales = (Net profit/ Sales) * 100 Ratio of net profit to sales = (485500/ ) * 100 Ratio of net profit to sales = 7.63%
23 Costing Methods: There are two basic types of systems that companies can adopt-job costing and process costing systems. Job Order Costing: Job costing relates to a costing system that is required in organizations where each unit or batch of output of a product or service is unique. This creates the need for the cost of each unit to be calculated separately. The term job thus relates to each unique unit or batch of outpu the nature of job which determines the department through which it is to be processed. Job costing is applied to such activities as printing work, motor car repair, machine tools, general engineering, and audit firms. Process Costing: Process costing relates to those situations where masses of identical units are produced and it is unnecessary to assign costs to individual units of output. An input of material passes through a number of processes before it reaches to finished goods store room. The output of one process may become the input of other process. Industries where process costing is applied: (Colin Drury Cost & Management Accounting 7 th edition, pg: 43) Furniture Industry Meat Industry Chemical Industry Oil refinery Steel industries Operating Costing: Operating costing method is applied in those organizations which provide services and are not engaged in manufacturing process. The cost of providing a service is termed as operating cost. In many manufacturing companies, operating costing is used in certain departments which renders services, e.g. internal transport, power house, personnel department etc. TRANSPORT COSTING Objects: The main objects of transport costing are: 1. To fix the rates of carriage of goods or passengers on the basis of operating costs 2. To decide the hire charges where vehicles are given on hire
24 3. To determine what should be charged against departments or others, using a service 4. To compare the cost of using own motor vehicles and that of using alternate forms of transport 5. To compare the cost of maintaining one vehicle with another or one group of vehicles with another group Determination of Number of Cost Units The cost unit in passenger transport is usually a passenger kilometer and in goods transport it is a ton-kilometer. The calculation of the total number of cost units is illustrated below: Illustration 2.1 Firstflight Transport Co. runs four lorries between two towns which are 50 kms Apart. The seating capacity of each bus is 50 passengers and actual passengers carried are 80% of the seating capacity. All the 4 buses run on 25 days in the month and each bus makes one round trip per day. Passengers Kilometers = No. of Distance Capacity Actual Round trip No. of Lorries Of each Capacity Days Lorry Utilized 4 x 50 x 50 x 80% x 2 x 25 = 4,000,000 passenger kilometers Collection of Data: Most of the details required for transport costing are obtained from log book. A log book is maintained for each vehicle to record details of trips, running time, capacity, mileage, etc on daily basis. These details also enable the management to avoid idleness of vehicles, to prevent waste of the capacity and to guard against unnecessary duplication of trips. Compilation of costs: Costs are classified and accumulated under the following heads: Standing Charges Garage rent License fees and taxes Insurance Drivers wages Depreciation Administrative Costs
25 Interest on capital Standing or fixed Charges: These are constant costs and are incurred irrespective of the basis of mileage run. Such costs, therefore, should not be allocated to specific journeys on the basis of mileage. Some of these costs are direct or traceable fixed costs and can be allocated to specific vehicles. Other such costs are suitably apportioned to each vehicle. Opinions differ as to whether depreciation is to be regarded as a fixed cost or a variable cost. It is thus sometimes regarded as a variable or running cost and sometimes as a fixed cost. Interest on capital might also be included in fixed charges. Running or variable charges: Petrol/diesel oil, lubricating oil, Tyres and tubes, repairs and maintenance, drivers wages. These costs vary more or less in direct proportion to mileage and so a cost per unit may be computed. Wages of drivers, conductors and cleaners are sometimes regarded as running or variable costs if payment is according to distance or trips. The above two types of costs are compiled periodically in an operating cost sheet. Quotations while preparing quotations, then in addition to cost figures, certain non-cost factors like strength of competition possibly to return loads, likelihood of repeat business, etc. must also be considered even though these are outside the sphere of cost accounting. An example of compilation of a typical quotation is given below: Illustration 2.2 A vehicle costs Rs. 650,000 and its life is estimated at 8 years, after which its residual value is estimated at Rs. 200,000. Standing charges per annum are estimated at following figures: Insurance Rs. 6500, License Rs. 8000, and Administration overheads Rs. 350,000. Fuel costs Rs. 400 per gallon and based on an estimated kilometers of 30,000 per year the cost of lubricants is Rs The estimated consumption of fuel is 20 miles per gallon. A set of tyres costs Rs. 20,000 and their expected mileage is The driver is paid Rs. 50 per week of 44 hours and is entitled to a fortnight s paid holiday per annum. The company s contribution towards national Insurance Scheme is Rs per week. For each night spent away from home, the driver is paid a subsistence allowance of Rs It is estimated that the vehicle will run 220 days per annum and depreciation is regarded as a running cost. Repairs over the life of the vehicle are estimated at Rs. 150,000. (a) Compute figures which may be used as a basis for quoting, if the company adds 10% to the total cost for profit. Prepare a quotation for a journey of 100 miles and return, assuming no return load and a total time of two days Costing Techniques: There are two basic types of systems that companies can adopt-job costing and process costing systems. 1. Absorption costing 2. Marginal Costing 3. Budgetary control
26 4. Standard Costing 5. Relevant Costing 6. Responsibility Accounting Marginal Costing: The costing method in which variable costs are charged to cost units and fixed costs of the period are written off against the aggregate contribution. Its special value is in recognizing cost behavior, and hence assisting in decision-making. (CIMA official Terminology) Absorption Costing: A method of costing that, in addition to direct costs, assigns all, or a proportion of, production overhead costs to cost units by means of one or a number of overhead absorption rates. (CIMA official Terminology) Budgetary Control: is the comparison of actual results with budgeted results. It is carried out through a Master Budget devolved to responsibility centers, allowing continuous monitoring of actual results versus budget, either to secure by individual action the budget objectives or to provide a basis for budget revision. (CIMA official Terminology) In other words, individual managers are held responsible for investigating differences between budgeted and actual results, and are then expected to take corrective action or amend the plan in the light of actual events. (CIMA performance Management 3rd edition, pg: 402) Standard Costing: is a pre-determined cost of manufacturing a single unit or a number of product units during a specific period in the immediate future (Matz Usry Cost Accounting 7 th edition, pg: 544) It is the planned cost of a product under current and/or anticipated operating condition. A standard cost has two components: a standard and a cost. A standard is like a norm and whatever is considered normal can generally be accepted as standard. Example: If a score of 72 is a standard for a golf course, a golfer s score is judged on the basis of this standard. Relevant Costing: The costs which should be used for decision-making and are often referred to as relevant costs Costs appropriate to a specific management decision. These are represented by future cash flows whose magnitude will vary depending upon the outcome of the management decision made. (CIMA official Terminology)
27 Responsibility Accounting: is a system of accounting that segregates costs and revenues into areas of personal responsibility in order to monitor and assess the performance of each part of an organization. 2.5 Not-for-profit organizations:- (CIMA official Terminology) Some organizations are set up with a prime objective which is not related to making profits. Examples are NGO s, charities. These organizations exist to pursue non-financial aims, such as providing a service to the community. However, there will be financial constraints which limit what any organization can do. 1) A not-for-profit organization needs finance to pay for its operations, and the major financial constraint is the amount of funds that it can obtain from its donors (its customers) 2) Having obtained funds, a not-for-profit organization will use the funds to help its clients, for example by alleviating suffering. It performance is judged how it uses its funds on the following three grounds: a) Economically- that is not spending Rs.2 when the same thing can be bought for Re.1 b) Efficiently- getting the best use out of what the money is spent on. c) Effectively-spending funds so as to achieve the organization s objectives (CIMA performance Management 3 rd edition, Pg: 456) High-low method: The high-low method consists of selecting the periods of highest and lowest activity levels and comparing the changes in costs that result from the two levels. This approach is illustrated in the following example: Example The monthly recordings for output and maintenance costs for the past 12 months have been examined and the following information has been extracted for the lowest and highest output levels: The non-variable (fixed) cost can be estimated at any level of activity (assuming a constant unit variable cost) by subtracting the variable cost portion from the total cost. At an activity level of 5000 units the total cost is Rs and the total variable cost is Rs. 10,000 (5000 Rs.2 per unit). The balance of Rs is therefore assumed to represent the nonvariable cost. The cost function is therefore: Y = Rs (Rs.2)(x) The method is illustrated in Figure, with points A & B representing the lowest and highest output levels, and TC1 and TC2 representing the total cost for each of these levels. The other crosses represent past cost observations for other output levels. The straight (blue)
28 line joining the observations for the lowest and highest activity levels represent the costs that would be estimated for each activity level when the high-low method is used. From this illustration, we come to know that the method ignores all cost observations other than the observations for the lowest and highest activity levels. Unfortunately, cost observations at the extreme ranges of activity levels are not always typical of normal operating conditions, and therefore may reflect abnormal rather than normal cost relationships. Figure 23.2 indicates how the method can give inaccurate cost estimates when they are obtained by observing only the highest and lowest output levels. It would obviously be more appropriate to incorporate all of the available observations into the cost estimate, rather than to use only two extreme observations. Illustration: Georgia Woods, Inc., manufactures furniture to customers specifications and uses a job order cost system. A predetermined overhead rate is used in applying manufacturing overhead to individual jobs. In department One, overhead is applied on the basis of machine-hours, and in Department Two, on the basis of direct labor hours. At the beginning of the current year, management made the following budget estimates to assist in determining the overhead application rate: Department One Department Two Direct labor cost.. Rs. 30,000,000 Rs. 22,500,000 Direct labor hours ,000 15,000 Manufacturing overhead Rs. 42,000,000 33,750,000 Machine hours Production of a batch of custom furniture ordered by City Furniture (job no.58) was started early in the year and completed three weeks later on January 29. The records for this job show the following cost information: Department One Department Two Job order for City Furniture (job no. 58): Direct materials cost 1,010, ,000 Direct labor cost... 1,650,000 1,110,000 Direct labor hours Machine-hours
29 Selected additional information for January is given below: Department One Department Two Direct labor hours-month of January 1,600 1,200 Machine hours month of January... 1, Manufacturing overhead incurred in January 3,901,000 2,654,000 a) Compute the predetermined overhead rate for each department. b) What is the total cost of the furniture produced for City Furniture? c) Prepare the entries required to record the sale (on account) of the furniture to City Furniture. The sales price of the order was Rs. 14,700,000. d) Determine the over-or under-applied overhead for each department at the end of January.
30 Question No.1 Midstate University is trying to decide whether to allow 100 more students into the university. Tuition is $5,000 per year. The controller has determined the following schedule of costs to educate students: Number of Students Total Costs 4,000 $30,000,000 4,100 30,300,000 4,200 30, ,300 30,900,000 The current enrollment is 4,200 students. The president of the university has calculated the cost per student in the following manner: $30,600,000 / 4,200 students = $7,286 per student. The president was wondering why the university should accept more students if the tuition is only $5,000. a. What is wrong with the president s calculation? b. What are the fixed and variable costs of operating the university?
31 SOLUTION :1 Number of Students Total Cost ($) Minimum 4,000 30,000,000 Maximum 4,300 30,900,000 Difference ,000 Thus, our total cost per student becomes: 900,000/ 300 = $3,000 If we consider the total cost per student as Variable cost and the Tuition fee as selling price, our contribution per student becomes Contribution per student $2,000 (5,000-3,000) Also if total cost per student is considered as variable cost, the fixed cost can be derived out as follows: Number of Students Total Cost ($) Variable cost ($3000 per student) Fixed cost (Total - Variable) Minimum 4,000 30,000,000 12,000,000 18,000,000 Maximum 4,300 30,900,000 12,900,000 18,000,000 Difference , ,000 This means that we are maintaining the same $18,000,000 fixed cost, while retaining $2,000 margin per new student enrolled, therefore, 100 more students should be enrolled as far as it gives benefit with subject to the persistent fixed costs.
32 Question No. 2 The Small Bike Company is the idea of Charles Johnson. Charles has designed a portable bicycle that can be disassembled easily and placed in a suitcase. He is thinking about implementing the idea and going into production. Charles estimates that the fixed costs of producing between 1,000 and 3,000 portable bicycles will be $50,000 annually. In addition, the variable cost per portable bicycle is estimated to be $40 per bicycle. Charles could outsource the suitcase production, which would reduce the fixed costs to $40,000 annually and the variable costs to $35 per bicycle. If the company makes less than 2,000 portable bicycles, there would be excess capacity that could be used to make 1,000 regular bicycles. There would be no additional fixed costs and the variable costs would be $60 per regular bicycle. There is no other use of the space. a. Charles would like to make $60,000 annually on his venture. If Charles makes and sells 3,000 portable bicycles (with the suitcase), what price should Charles charge for each portable bicycle? b. If Charles decides to charge $80 per portable bicycle while making the suitcase, what as the break-even number of portable bicycles? c. If Charles makes 2,500 portable bicycles, should he consider buying the suitcases from an outside supplier if the supplier s price per suitcase is $10? d. If Charles only makes and sells 2,000 portable bicycles because of limited demand, what is the minimum price that he should consider in selling 1,000 regular bicycles built with the excess capacity? Solution:2 a. Profit =(Price per unit Variable cost per unit) (Number of units) Fixed cost $60,000 = (Price per unit) - $40)(3,000) - $50,000 Price per unit = $76.67 b. Break even quantity = Fixed cost/(price per unit Variable cost per unit) Break even Quantity = $50,000/($80 - $40) = 1,250 portable bicycles c. Avoidable costs if the suitcase is not made in-house Reduction in fixed costs ($50,000 - $40,000) $10,000 Reduction in variable costs (2,500 units)($40-$35) 7,500 Total Avoidable costs $17,500 Cost of purchasing suitcases ($10)(2,500) $25,000 Therefore, the suitcases should be made in-house. d. Because the regular bicycles do not add to the fixed costs, the variable cost per unit establishes the lower boundary for pricing the regular bicycles. As long as the price is greater than the variable cost, the company has a positive contribution margin from the regular bicycles.
33 Question No. 3 In year 2000, the G.P. Co. Produced a machine that sold for Rs. 6,000 of which Rs. 4,500 represented cost of goods sold and Rs. 400 represented selling and administrative expenses. The cost of goods sold comprised of 50% material costs, 30% labor cost and 20% factory overhead. During the year, numbers of machines sold were During year 2001, an increase of 20% in the cost of material and an increase of 25% in the cost of labor are anticipated. The company plans to raise the selling price to Rs. 7,000 per unit, with a resulting decrease of 40% in the number of units to be sold. Required: a) A Projected profit and loss account for the year 2001 indicating the new cost per unit Assume that material and labor cost will still equal 80% of the cost of the goods sold for the year 2001 and selling and administrative expenses are still Rs.400 per unit. b) After the statement required in (a) was prepared, it was ascertained that the 20% factory overheads in Year 2000 consisted of Rs. 1,000,000 fixed expenses and Rs.800,000 variable expenses. The decrease in the number of units to be sold in Year 2001 does not influence fixed expenses. Prepare a revised profit& loss account for Year 2001 disregarding the 80% relationship of material and labor cost to cost of goods.
34 SOLUTION: 3 (a). New Profit& Loss Account Rs. Sales price per unit 7, Less: Cost of Goods Sold Material cost [2,250 + (2,250*20%)] 2, Labor cost [1,350 + (1,350*25%)] 1, F. O/H [(2,700+1,688.8)/80%)*20%] 1, , Gross profit per unit 1, Less: Selling expenses Net profit 1, Working: Rs. Cost of Goods Sold 4, Material cost (50% of COGS) 2, Labor cost (30% of COGS) 1, F. O/H , (b). Profit & Loss Account Rs. Sales (7,000*1,200) 8,400, Less: Cost of Goods Sold Material cost (2,700*1,200) 3,240, Labor cost (1,687.50*1,200) 2,025, F. O/H - Variable [(800,000/2,000)*1,200] 480, Fixed 1,000, ,745, Gross profit per unit 1,655, Less: Selling expenses (1,200*40%) Net profit 1,654, Working: New sales units [2000*(1-40%)] 1,200.00
35 CHAPTER 3 COSTING METHODS
36 Costing Methods: There are two basic types of systems that companies can adopt-job costing and process costing systems. Job Order Costing: Job costing relates to a costing system that is required in organizations where each unit or batch of output of a product or service is unique. This creates the need for the cost of each unit to be calculated separately. The term job thus relates to each unique unit or batch of output. (Colin Drury Cost & Management Accounting 7 th edition, pg: 43) The special features of production using job costing are: a) Production is against customer s orders and not for stocks. b) Each job has its own characteristics and requires special attention c) The flow of production is not uniform from one department to another. It is the nature of job which determines the department through which it is to be processed. Job costing is applied to such activities as printing work, motor car repair, machine tools, general engineering, and audit firms. Process Costing: Process costing relates to those situations where masses of identical units are produced and it is unnecessary to assign costs to individual units of output. An input of material passes through a number of processes before it reaches to finished goods store room. The output of one process may become the input of other process. Industries where process costing is applied: (Colin Drury Cost & Management Accounting 7 th edition, pg: 43) Furniture Industry Meat Industry Chemical Industry Oil refinery Steel industries Dairy industries Brewery Characteristics of Process Costing: 1. Production of unit cannot be separately identified in process costing whereas in job order or batch costing the production unit retain its identity. Unit cost has to be based on the average cost of the process. 2. The completed unit (output) of one process becomes the input of the next process unless it reaches to final process and then to finished goods.
37 3. In the course of processing, several different main products (joint products) and by products may arise. 4. The physical quantity of output of a process may be less than the input of quantity. This can be due to the nature of process evaporation or reaction etc. 5. For cost purposes, each process constitutes a cost centre and the cost per unit is arrived at by dividing total cost of the cost centre by the number of units of output. Comparison of Process Costing and Job order costing: Point of difference Process Costing Job Order Costing Products Identical all are same Specific, identified separately Production Continuous for stock As and when required Customer General Public Specific Design, quality Standardised substitutes are According to customer available specifications and requirements Operation Through various processes a Usually site based, work product moves from one normally remain stationary department to another Input / Output Output of one process becomes the input of other process Losses Normal loss/abnormal loss and gains arise By Products, Joint Different products from the products same process Work in process A complicated procedure to value the work-in-process Reports Process account, supported by production, cost and evaluation statement Job started,completed and handed over to customer Hardly a loss arise Profit Calculated for the Co. For each job No by or joint products arise Easy to determine the value of work-in-process Job Cost Sheet Operating Costing: Operating costing method is applied in those organizations which provide services and are not engaged in manufacturing process. The cost of providing a service is termed as operating cost. In many manufacturing companies, operating costing is used in certain departments which renders services, e.g. internal transport, power house, personnel department etc. Industries where process costing is applied: 1. Road transport companies 2. Railways 3. Airways 4. Shipping Companies 5. Electricity companies 6. Steam service
38 7. Hospitals 8. Cinemas 9. Canteens 10. Hotels 11. School & Colleges 12. Local authority 13. Personnel department in a factory Characteristics of Operative Costing: The following characteristics are usually found in industries where operating costing is used: a) Services rendered to customers are of unique type. b) A large proportion of the total capital is invested in fixed assets and comparatively less working capital is required. c) The distinction between fixed cost and variable cost is of particular importance because the economies and scale of operations considerably affect the cost per unit of service rendered. For example, fixed cost per passenger will be lower if buses in a transport company run capacity packed. Cost Unit: The selection of a suitable cost unit (unit of service) may sometimes prove difficult. The cost units may be of the following two types: Simple Cost Unit: A few examples are given below: Undertaking Cost Unit Transport Per Km; or per passenger; or per ton luggage carried School or college Per Student Hospital Per bed Canteen per cup of tea; per meal Composite Cost Unit: In this type more than one unit are combined together. Examples are: Undertaking Cost unit Transport Per-passenger-km; or Per ton-km Hospital Per bed per day Cinema Per seat per show Electricity Per kilowatt hour The costing procedure in some of the undertakings where this method of costing isused is detailed below:
39 TRANSPORT COSTING Objects: The main objects of transport costing are: 1. To fix the rates of carriage of goods or passengers on the basis of operating costs 2. To decide the hire charges where vehicles are given on hire 3. To determine what should be charged against departments or others, using a service 4. To compare the cost of using own motor vehicles and that of using alternate forms of transport 5. To compare the cost of maintaining one vehicle with another or one group of vehicles with another group Determination of Number of Cost Units The cost unit in passenger transport is usually a passenger kilometer and in goods transport it is a ton-kilometer. The calculation of the total number of cost units is illustrated below: Illustration 2.1 Firstflight Transport Co. runs four lorries between two towns which are 50 kms Apart. The seating capacity of each bus is 50 passengers and actual passengers carried are 80% of the seating capacity. All the 4 buses run on 25 days in the month and each bus makes one round trip per day. Passengers Kilometers = No. of Distance Capacity Actual Round trip No. of Lorries Of each Capacity Days Lorry Utilized 4 x 50 x 50 x 80% x 2 x 25 = 4,000,000 passenger kilometers Collection of Data: Most of the details required for transport costing are obtained from log book. A log book is maintained for each vehicle to record details of trips, running time, capacity, mileage, etc on daily basis. These details also enable the management to avoid idleness of vehicles, to prevent waste of the capacity and to guard against unnecessary duplication of trips. Compilation of costs: Costs are classified and accumulated under the following heads: Standing Charges Garage rent License fees and taxes Insurance Drivers wages Depreciation Administrative Costs Interest on capital
40 Standing or fixed Charges: These are constant costs and are incurred irrespective of the basis of mileage run. Such costs, therefore, should not be allocated to specific journeys on the basis of mileage. Some of these costs are direct or traceable fixed costs and can be allocated to specific vehicles. Other such costs are suitably apportioned to each vehicle. Opinions differ as to whether depreciation is to be regarded as a fixed cost or a variable cost. It is thus sometimes regarded as a variable or running cost and sometimes as a fixed cost. Interest on capital might also be included in fixed charges. Running or variable charges: Petrol/diesel oil, lubricating oil, Tyres and tubes, repairs and maintenance, drivers wages. These costs vary more or less in direct proportion to mileage and so a cost per unit may be computed. Wages of drivers, conductors and cleaners are sometimes regarded as running or variable costs if payment is based on distance covered or trips made. Job Order Costing Products identified separately Production as needed Specific Customer Design & Quality as per requirement Job started, completed and handed over to customer Losses hardly arise Job Order Costing Vs. Process Costing Process Costing Products identical Production continuous for stock Customer general public Standardized substitutes are available Output of one process becomes the input of other Normal loss/abnormal loss Operating Costing Used in Service oriented organizations like: Road transport companies Railways Airways Shipping Companies Electricity companies Steam service Hospitals Cinemas Canteens Hotels School & Colleges Local authority Personnel department in a factory Operating Costing Characteristics: Unique Services Large proportion invested in Fixed assets and comparatively less working capital Distinction between fixed cost and variable cost important because economies and scale of operations affect the cost per unit of service rendered
41 Operating Costing The selection of a suitable cost unit (unit of service) may sometimes prove difficult. The cost units may be of the following two types: Simple Cost Unit Composite Cost Unit Simple Cost Unit Undertaking Transport School or College Hospital Canteen Operating Costing Cost Unit Per Kilometer; or Per passenger Per student Per bed Per cup of tea; Per meal Composite Cost Unit Undertaking Transport School or College Hospital Canteen Operating Costing Cost Unit Per passenger-km Per-ton-km Per bed per day Per seat per show Transport Costing objects: Fixing Carriage rates (goods or passengers) Deciding the hire charges of vehicle.
42 Question No. 1 Slater Company manufactures products to customer specifications; a job-order cost system is used to accumulate costs in the company s plant. On July 1, 2008 the start of Slater Company s fiscal year, inventory balances were as follows: Rs. Raw materials.. 25,000 Work in process.. 10,000 Finished goods ,000 The company applies overhead cost to jobs on the basis of machine-hours of operating time. For the fiscal year starting July 1, 2008, it was estimated that the plant would operate 45,000 machinehours and incur Rs. 270,000 in manufacturing overhead cost. During the year, the following transactions were completed: a. Raw materials purchased on account, Rs. 275,000 b. Raw materials requisitioned for use in production, Rs. 280,000 (materials costing Rs. 220,000 were chargeable directly to jobs; the remaining materials were indirect) c. Costs for employee services were incurred as follows: Rs. Direct labor ,000 Indirect labor ,000 Sales commissions. 63,000 Administrative salaries... 90,000 d. Prepaid insurance expired during the year, Rs. 18,000 (Rs. 13,000 of this amount related to factory operations, and the remainder to selling and administrative activities). e. Utility costs incurred in the factory, Rs. 57,000 f. Advertising costs incurred, Rs. 140,000 g. Depreciation recorded on equipment, Rs. 100,000. (Some Rs. 88,000 of this amount was on equipment used in factory operations; the remaining Rs. 12,000 was on equipment used in selling and administrative activities). h. Manufacturing overhead cost was applied to production, Rs.?. (The company recorded 50,000 machine-hours of operating time during the year). i. Goods costing Rs. 675,000 to manufacture were transferred into the finished goods warehouse. j. Sales (all on account) to customers during the year totaled Rs. 1,250,000. These goods had cost Rs. 700,000 to manufacture.
43 Required: 1. Prepare journal entries to record the transactions for the year. 2. Prepare T-accounts for inventories, Manufacturing Overhead, and Cost of Goods Sold. Post relevant data from your journal entries to these T-accounts. Compute an ending balance in each account. 3. Is Manufacturing Overhead underapplied or overapplied for the year? Prepare a journal entry to close any balance in the Manufacturing Overhead account to Cost of Goods Sold. 4. Prepare an income statement for the year. (Do not prepare a schedule of cost of goods manufactured; all of the information needed for the income statement is available in the journal entries and T-accounts you have prepared). Part-1 General Journal (a). Raw materials 275,000 Accounts payable 275,000 (b). Work in process 220,000 Manufacturing overhead 60,000 Raw materials 280,000 (c). Work in process 180,000 Manufacturing overhead-indirect labor 72,000 Sales commission 63,000 Administrative salaries 90,000 Salaries& wages payable 405,000 (d). Manufacturing overhead 13,000 Insurance expense 5,000 Prepaid insurance 18,000 (e). Manufacturing overhead 57,000 Accounts payable 57,000 (f). Advertising expense 140,000 Accounts payable 140,000 (g). Manufacturing overhead 88,000 Depreciation expense 12,000 Accumulated depreciation 100,000 (h). Work in process 300,000 (W-1) Manufacturing overhead 300,000
44 (i). Finished goods 675,000 Work in process 675,000 (j). Accounts receivable 1,250,000 Sales 1,250,000 Cost of goods sold 700,000 Finished goods 700,000 Working: W-1 Manufacturing overhead cost To find out the manufacturing cost, first we have to determine the amount of Predetermined Overhead Rate: Estimated manufacturing overhead 270,000 Estimated machine hours 45,000 Predetermined overhead rate 6 Rs. per M/hr (Est. manufacturing O/H / Est. machine hrs) Based on the 50,000 machine hours actually worked during the year, the company would have applied the overhead cost to production, as follows: Overhead cost to be applied at production 300,000 Rs machine hrs*6
45 Part-2 Accounts Receivable Manufacturing Overhead (j) 1,250,000 (b) 60,000 (h) 300,000 (c) 72,000 Bal. 1,250,000 (d) 13,000 (e) 57,000 Prepaid Insurance (g) 88,000 (d) 18, , ,000 Bal. 10,000 Bal. 18,000 Accumulated Depreciation Commission Expense (g) 100,000 (c) 63,000 Bal. 100,000 Bal. 63,000 Sales Cost of Goods Sold (j) 1,250,000 (j) 700,000 Bal. 1,250,000 Bal. 700,000 Administrative Salary Expense Accounts Payable (c) 90,000 (a) 275,000 (e) 57,000 Bal. 90,000 (f). 140,000 Bal. 472,000 Raw Materials Bal. 25,000 (b). 280,000 Salaries& Wages Payable (a) (c). 405, , ,000 Bal. 20,000 Bal. 405,000 Work in Process Bal. 10,000 (i). 675,000 Advertising Expense (b). 220,000 (f). 140,000 (c). 180,000 (h). 300,000 Bal. 140, , ,000 Bal. 35,000 Insurance Expense (d). 5,000 Finished Goods Bal. 40,000 (j) 700,000 Bal. 5,000 (i). 675,000 Bal. 15,000 Depreciation Expense (g). 12,000 Bal. 12,000
46 Part-3 Manufacturing overhead is overapplied for the year. The entry to close it out to Cost of Goods Sold, would be: Manufacturing Overhead 10,000 Cost of Goods Sold 10,000 Part-4 Slater Company Income Statement For the Year ended June 30, 2008 Rs. Sales 1,250,000 Less: COGS (700,000-30,000) 690,000 Gross profit 560,000 Less: selling& admin expenses: Commission exp. 63,000 Administrative salaries exp. 90,000 Advertising exp. 140,000 Depreciation exp. 12,000 Insurance exp. 5, ,000 Net Income 250,000
47 Question No.2 Tele Tech Corporation manufactures two different fax machines for the business market. Cost estimates for the two models for the current year are as follows: Basic System Advanced System Direct material.. $400 $800 Direct labor (20hours at $15 per hour) Manufacturing overhead* Total $1,100 $1,500 *The predetermined overhead rate is $20 per direct labor hour Each model of fax machine requires 20 hours of direct labor. The basic system requires 5 hours in department A and 15 hours in department B. The advanced system requires 15 hours in department A and 5 hours in department B. The overhead costs budgeted in these two production departments are as follows: Department A Department B Variable cost. $16 per directlabor hour $4 per directlabor hour Fixed cost. $200,000 $200,000 The firm s management expects to operate at a level of 20,000 direct-labor hours in each production department during the current year. Required: 1. Show how the company s predetermined overhead rate was determined. 2. If the firm prices each model of fax machines at 10 percent over its cost, what will be the price of each model? 3. Suppose the company were to use departmental predetermined overhead rates. Calculate the rate for each of the two production departments. 4. Compute the product cost of each model using the departmental overhead rates calculated in requirement (3). 5. Compute the price to be charged for each model, assuming the company continues to price each product at 10 percent above cost. Use the revised product costs calculated in requirement (4).
48 SOLUTION: 2 (1). Predetermined overhead rate: Budgeted manufacturing overhead: Department A: $ Variable (20000*$16) 320,000 Fixed (200000) 200, ,000 Department B: Variable (20000*$4) 80,000 Fixed (200000) 200, ,000 Total budgeted M. O/H 800,000 Total budgeted labor hours: Basic system 20,000 Advance system 20,000 Total budgeted labor hours 40,000 Predetermined overhead rate per labor hour (Total budgeted M.O/H / Total budgeted labor hrs) (2). Price of each model: (10% over cost) Basic System Advanced System Total manufacturing costs $1,100 $1,500 Profit margin (10% of cost) Price (120% over cost) $1,210 $1,650 (3). Departmental rates: Department A Department B Budgeted manufacturing overhead $520,000 $280,000 Budgeted direct labor hours 20,000 20,000 Overhead rates $26.00 $14.00 per direct labor hr. (O/H / hours) (4). Product cost: Basic System Advanced System Direct material $400 $800 Direct labor Manufacturing overhead: Department A Department B Product cost $1,040 $1,560
49 (5). Price of each model: (10% over cost) Basic System Advanced System Total manufacturing costs $1,040 $1,560 Profit margin (10% of cost) Price (120% over cost) $1,144 $1,716
50 Question No. 3 A factory with three departments has a single production overhead absorption rate expressed as a percentage of direct wages cost. It has been suggested that departmental overhead absorption rates would result in more accurate job costs. Set out below are in budgeted and actual data for the previous period, together with the information relating to job No. 657 Wage Rs. thousands Labor thousands of hours Machine time thousands of hours Overhead Rs. thousands Budget: Department: A B C Total Actual: Department: A B C Total During this period, job No.657 incurred the actual costs and actual times in the departments shown below: Direct Material Direct wages Direct labor Machine time Rs. Rs. hours hours Department: A 1,200 1, B C After adding production overhead to prime cost, one-third is added to production cost for gross profit. That assumes that a reasonable profit is earned after deducting administration, selling and distribution costs. Required: (a) (b) (c) Calculate the current overhead absorption rate Using the rate obtained in (a) above, calculate the production overhead charged to job number 657 and state the production cost and expected gross profit on this job. (i). Comment on the suggestion that the departmental overhead absorption rates would result in more accurate job cost; and (ii). Compute rates, briefly explaining your reason for each rate.
51 SOLUTION: 3 (a). Current overhead absorption rate = (Total overhead cost/ Direct wage cost)*100 Current overhead absorption rate = (225000/ )*100 Current overhead absorption rate = 150% of direct wage cost (b). Production overhead charged to job no. 657 = 150% * Total Direct wage cost Production overhead charged to job no. 657 = 150% * ( ) Production overhead charged to job no. 657 = 2,550 Rs. R (Rs. in Production cost: thousands) Direct material 1,900 ( ) Direct wages 1,700 ( ) Overheads 2,550 Total production cost 6,150 Expected Profit: 1/3rd of Total production cost 2,050 (1/3* 6150) Expected Profit 2,050 (c). (i) (ii) Single overhead absorption rate for every department is not appropriate due to the fact that each department has its own characteristics, department A may b mechanized while B may be labor intensive, and overhead incurrence will differ in each department. It is therefore necessary to use departmental overheads absorption date. This will lead better absorption of overheads and minimum under or over absorption of overheads. The overhead absorption rate for each of the Department, on the basis of direct labor hours, machine hours and direct wages (whichever is important for the respective department; on the basis of the highest amount; using budgeted data. Basis for Overhead rate col.1 col.2 col.3 = (col.2/ col.1) Respective Budgeted Departmental Overhead base hours overhead cost Absorption Rates in thousands in thousands Rs. Department: A Machine hours per machine hour B Direct labor hours per direct labor hour C Direct labor hours per direct labor hour The overhead rate for Department B and Department C, can also be expressed as a %age of Direct wage cost, i.e. 60% and 300% of direct wage cost respectively
52 Question No. 4 Georgia Woods, Inc. manufactures furniture to customers specifications and uses a job order cost system. A predetermined overhead rate is used in applying manufacturing overhead to individual jobs. In Department One, overhead is applied on the basis of machine-hours, and in Department Two, on the basis of direct labor hours. At the beginning of the current year, management made the following budget estimate to assist in determining the overhead application rate: Department Department One Two Direct labor cost $300,000 $225,000 Direct labor hours 20,000 15,000 Manufacturing overhead $420,000 $337,500 Machine-hours. 12,000 7,500 Production of a batch of custom furniture ordered by City Furniture (job no. 58) was started early in the year and completed three weeks later on January 29. The records of this job show the following cost information: Job order for City Furniture (job no. 58): Department One Department Two Direct materials cost $300,000 $225,000 Direct labor cost 20,000 15,000 Direct labor hours. $420,000 $337,500 Machine-hours. 12,000 7,500 Selected additional information for January is given below: Department Department One Two Direct labor hours month of January.. 1,600 1,200 Machine hours month of January... 1, Manufacturing overhead incurred in January.. $39,010 $26,540 Required: (a). Compute the predetermined overhead rate for each department (b). What is the total cost of the furniture produced for City Furniture? (c). Prepare the entries required to record the sale (on account) of the furniture to City Furniture. The sales price of the order was $147,000 (d). Determine the over-or under-applied overhead for each department at the end of January.
53 SOLUTION: 4 (a). Predetermined overhead rate Predetermined overhead rate = Estimated manufacturing overhead/ Base hours Department One - (machine hours) Rs. Predetermined overhead rate = / Predetermined overhead rate = per machine hour Department Two - (direct labor hours) Rs. Predetermined overhead rate = / Predetermined overhead rate = 22.5 per machine hour (b). Department One Department Two Total Direct materials cost 10,100 7,600 17,700 Direct labor cost 16,500 11,100 27,600 Prime cost 26,600 18,700 45,300 Manufacturing overhead 26,250 16,650 42,900 Total cost of production 52,850 35,350 88,200 Working: Manufacturing overhead: Manufacturing overhead = Predetermined overhead rate*base hours for Job. 58 Department One Department Two Actual M.O/H 26,250 16,650 (c). Journal Entries: Accounts receivable 147,000 Sales 147,000 Cost of goods sold 88,200 Finished goods inventory 88,200 (d). Over or underapplied overhead: Department One Department Two Total Actual overhead incurred 39,010 26,540 65,550 Applied overhead 38,500 13,500 52,000 (Actual hours*predetermined rate) ,040 13,550 (U) (O) (U)
54 Question No. 5 Scholastic Brass Corporation manufactures brass musical instruments for use by high school students. The company uses a normal costing system, in which manufacturing overhead is applied on the basis of direct-labor hours. The company s budget for the current year included the following predictions. Budgeted total manufacturing overhead. $426,300 Budgeted total direct-labor hours. 20,300 During March, the firm worked on the following two production jobs: Job number T81, consisting of 76 trombones Job number C40, consisting of 110 cornets The events of March are described as follows: a. One thousand square feet of rolled brass sheet metal was purchased on account for $5,000. b. Four hundred pounds of brass tubing was purchased on account for $4,000. c. The following requisitions were submitted on March 5: Requisition number 112:250 square feet of brass sheet metal at $5 per square foot (for job number T81) Requisition number 113:1,000 pounds of brass tubing, at $10 per pound (for job number C40) Requisition number 114:10 gallons of valve lubricant, at $10 per gallon All brass used in production is treated as direct material. Valve lubrication is an indirect material. d. An analysis of labor time cards revealed the following labor usage for March. Direct labor: Job number T81, 800 hours at $20 per hour Direct labor: Job number C40, 900 hours at $20 per hour Indirect labor: General factory cleanup, $4,000 Indirect labor: Factory supervisory salaries, $9,000 e. Depreciation of factory building and equipment during March amounted to $12,000. f. Rent paid in cash for warehouse space used during March was $1,200. g. Utility costs incurred during March amounted to $2,100. The invoices for these costs were received, but the bills were not paid in March. h. March property taxes on the factory were paid in cash, $2,400. i. The insurance cost covering factory operations for the month of March was $3,100. The insurance policy had been prepaid.
55 j. The costs of salaries and fringe benefits for sales and administrative personnel paid in cash during March amounted to $8,000. k. Depreciation on administrative office equipment and space amounted to $4,000. l. Other selling and administrative expenses paid in cash during March amounted to $1,000. m. Job number T81 was completed on March 20. n. Half of the trombones in job number T81 were sold on account during March for $700 each. The March 1 balances in selected accounts are as follows: Cash $10,000 Accounts receivable ,000 Prepaid insurance.. 5,000 Raw-material inventory ,000 Manufacturing supplies inventory. 500 Work-in-process inventory 91,000 Finished-goods inventory ,000 Accumulated depreciation: buildings& equipment 102,000 Accounts payable.. 13,000 Wages payable.. 8,000 Required: 1. Calculate the company s predetermined overhead rate for the year. 2. Prepare journal entries to record the events of March. 3. Set up T-accounts, and post the journal entries made in requirement (2). 4. Calculate the overapplied or underapplied overhead for March. Prepare a journal entry to close this balance into Cost of Goods Sold. 5. Prepare a schedule of cost of goods manufactured for March. 6. Prepare a schedule of cost of goods sold for March. 7. Prepare an income statement for March.
56 SOLUTION: 5 1 Predetermined overhead rate Estimated manufacturing overhead $426,300 Estimated machine hours 20,300 Predetermined overhead rate $21 per direct labor hour (Est. manufacturing O/H / Est. machine hrs) 2 General Journal $ (a). Raw materials 5,000 Accounts payable 5,000 (b). Raw materials 4,000 Accounts payable 4,000 (c). Work in process 11,250 Raw materials W-1 11,250 Manufacturing overhead supplies inventory 100 Indirect material W (d). Work in process-direct labor 34,000 Manufacturing overhead-indirect labor 13,000 Wages payable W-3 47,000 Work in process 35,700 Manufacturing overhead applied 35,700 (applied O/H = 1700hrs * 21 = $35,700) (e). Manufacturing overhead 12,000 Accumulated depreciation-factory 12,000 (f). Manufacturing overhead-rent exp. 1,200 Cash 1,200 (g). Manufacturing overhead 2,100 Accounts payable 2,100 (h). Manufacturing overhead-tax exp. 2,400 Cash 2,400 (i). Manufacturing overhead-insurance exp. 3,100 Prepaid insurance 3,100 (j). Selling& admin exp. 8,000 Cash 8,000 (k). Selling& admin exp. 4,000 Accumulated depreciation-admin equip 4,000 (l). Selling& admin exp. 1,000 Cash 1,000 (m). Finished goods-job T81 W-4 34,050 Work in process-job T81 34,050 (n). Accounts receivable 26,600 Sales - Job T81 W-5 26,600 Cost of goods sold W-6 17,025 Finished goods - Job T81 17,025
57 Working: W-1 Direct material cost: $ Brass sheet metal cost 1,250 (250sq-ft*$5) Brass tubing cost 10,000 (1000pounds*$10) Total direct material costs 11,250 W-2 In-direct material cost: Valve lubricant cost 100 (10gallons*$10) Total in-direct material costs 100 W-3 Wages payable: Work in process-direct labor 34,000 (800*$ *$20) Manufacturing overhead-indirect labor 13,000 ( ) Wages payable 47,000 W-4 Cost of Job T81: Direct material - Brass sheet metal cost 1,250 (250sq-ft*$5) Direct labor Cost 16,000 (800*$20) Manufacturing overhead applied on DL hrs 16,800 (800*$21) Total manufacturing cost of Job T81 34,050 W-5 Sales - JobT81: Sales units (half of trombones*price per unit) 26,600 (76/2 * $700) W-6 Cost of goods sold - Job T81: Cost of goods sold: Sales units (76/ 2) 38 Cost per unit 17,025 (34050/ 76)*(38) 3 T Accounts Cash Accounts receivable Bal. 10,000 (f). 1,200 Bal. 21,000 (h). 2,400 (n). 26,600 (j). 8,000 Bal. 47,600 (l). 1,000 10,000 12,600 Bal. 2,600 Raw material inventory Bal. 149,000 (c). 11,250
58 Sales (n). 26,600 Bal. 26,600 Prepaid insurance (a). 5,000 Bal. 5,000 (i). 3,100 (b). 4,000 Bal. 1,900 Bal. 146,750 Manufacturing supplies inventory Work-in-process inventory Bal. 500 Bal. 91,000 (m). 34, (c). 11,250 Bal. 600 (d). 34,000 (d). 35,700 Bal. 137,900 Finished-goods inventory Accumulated dep.: Build& equip. Bal. 220,000 (n). 17,025 Bal. 102,000 (m). 34,050 (e). 12,000 Bal. 237,025 (k). 4,000 Bal. 118,000 Accounts payable Wages payable Bal. 13,000 Bal. 8,000 (a). 5,000 (d). 47,000 (b). 4,000 Bal. 55,000 (g). 2,100 Bal. 24,100 Selling& admin exp. (j). 8,000 Manufacturing overhead (k). 4,000 (c). 100 (d). 35,700 (l). 1,000 (d). 13,000 Bal. 13,000 (e). 12,000 (f). 1,200 Cost of goods sold (g). 2,100 (n). 17,025 (h). 2,400 (i). 3,100 Bal. 17,025 33,900 35,700 Bal. 1,800 4 Overapplied/ Underapplied Overhead Manufacturing overhead- actual (T-account balance) 33,900 Manufacturing overhead - applied (T-account balance) 35,700 Overapplied manufacturing overhead 1,800 over-applied
59 Manufacturing overhead 1,800 Cost of goods sold 1,800 5 Scholastic Brass Corporation Cost of Goods Manufactured For the Year ended March 31, xxxx $ Direct material: Raw material inventory, March 1 149,000 Add: purchases of raw material 9,000 Raw material available for use 158,000 Less: raw material inventory, March 31 (146,750) Raw material used during March 11,250 Direct labor 34,000 Manufacturing overhead: Indirect material 100 Indirect labor 13,000 Accumulated depreciation factory 12,000 Rent expense 1,200 Utilities 2,100 Property taxes 2,400 Insurance exp. 3,100 Total actual manufacturing overhead 33,900 Add: overapplied overhead 1,800 Overhead applied to work in process 35,700 Total manufacturing costs 80,950 Add: work in process inventory, March 1 91, ,950 Less: work in process inventory, March 31 (137,900) Cost of Goods Manufactured 34,050 6 Scholastic Brass Corporation Cost of Goods Sold For the Year ended March 31, xxxx $ Finished goods inventory, March 1 220,000 Add: cost of goods manufactured 34,050 Goods available for use 254,050 Less: finished goods inventory, March 31 (237,025) Cost of Goods Sold 17,025 7 Scholastic Brass Corporation Income Statement For the Year ended March 31, xxxx $ Sales 26,600 Less: COGS ( ) 15,225 Gross profit 11,375 Less: selling& admin expenses: Salaries& fringe benefits costs 8,000 Depreciation on admin office equipment 4,000
60 Other selling& admin expenses 1,000 (13,000) Net Income (1,625) JOB COST RECORD Job Number T81 Description Trombones Date Started March 5 Date Completed March 20 Number of Units Completed 76 Direct Material Date Requisition Number Quantity Unit Price Cost 5-Mar $5.00 $1,250 Direct Labor Date Time Card Number Hours Rate Cost 3/8 to 3/ thorugh 3-12 $ $20.00 $16,000 Manufacturing Overhead Date Cost Driver (Activity Based) Quantity Application Rate Cost 3/8 to 3/12 Direct labor hours $ $21.00 $16,800 Cost Summary Cost Item Total direct material Total direct labor Total manufacturing overhead Amount $1,250 16,000 16,800 Total cost Unit cost $34,050 $ Date Units Shipped March 38 Shipping Summary Units Remaining in Inventory 38 Cost Balance $17,025
61 Question: 6 The national Oil Company buys crude vegetable oil. The refining of this oil results in four products A, B, C, which are liquid and D which is Heavy Grease. Joint Costs in 19XX total Rs.97,600 (Rs. 27,600 for crude oil plus Rs. 70,000 conversion costs). The out put Sales of the four products in 19xx were as follows. PRODUCT OUTPUT SALES SEPARABLE PROCESSING COSTS Gallons Rs. Rs. A 500, ,000 30,000 B 10,000 10,000 6,000 C 5,000 4,000 - D 9,000 30,000 1,000 REQUIRED: (a) (b) (c) Assume that the estimated net realizable method of allocating joint costs is used. What is the gross margin for Products A, B, C & D? The company has been tempted to sell at split of directly to other processors. In this case sales per gallon would have been: A = Rs B = Rs C = Rs D = Rs What would the gross Margin have been for each product assuming that sales value at split off method of allocating joint costs is used. The company expects to operate at the same level of production and sales in the year. Could the company increase the gross margin by altering it processing decisions?. If so, what would be the expected overall gross margin? Which Products should be further processed and which should be sold at split off? Assume that all costs incurred after split off are variable. Solution No. 6 (a) (2+4) 6(1-5) Sales Separable NRV Allocation of Total Gross Margin Processing Cost Joint Cost Cost A 115,000 30,000 85,000 68,000 98,000 17,000 B 10,000 6,000 4,000 3,200 9, C 4,000-4,000 3,200 3, D 30,000 1,000 29,000 23,200 24,200 5, ,000 37, ,000 97, ,600 24,400
62 (b) Sales Sale at Allocation Separable Total Cost Gross Margin Split off Of Joint Cost Processing Cost A 115,000 75,000 65,946 30,000 95,946 19,054 B 10,000 5,000 4,396 6,000 10,396 (396) C 4,000 4,000 3,517-3, D 30,000 27,000 23,741 1,000 24,741 5, , ,000 97,600 37, ,600 24,400 (c) Separable Final Split off Differential Incremental Benefit S.P/Unit S.P/Unit Price Cost / Unit (Loss) A B (0.10) C D A & D should be processed further, while B & C should be sold off at split of point. EXPECTED OVERALL GROSS MARGIN SALES A After Process 115,000 B At Split off 5,000 C At Split off 4,000 D After process 30, ,000 JOINT COSTS 97,600 PROCESSING COST A 500,000 Gallons 30,000 B 9,000 Gallons 1, ,600 Gross Margin 25,400 Note: In case of product C is selling at split off point. No further Processing
63 Question No. 7 A vehicle costs Rs. 650,000 and its life is estimated at 5 years, after which its residual value is estimated at Rs. 200,000. Standing charges per annum are estimated at following figures: Insurance Rs , License Rs , and Administration overheads Rs. 350,000. Fuel costs Rs. 400 per gallon and based on an estimated kilometers of 30,000 per year the cost of lubricants is Rs The estimated consumption of fuel is 20 miles per gallon. A set of tyre costs Rs. 26,000 and their expected mileage is The driver is paid Rs per week of 44 hours and is entitled to a fortnight s paid holiday per annum. The company s contribution towards national Insurance Scheme is Rs per week. It is estimated that the vehicle will run 250 days per annum and depreciation is regarded as a running cost. Repairs over the life of the vehicle are estimated at Rs. 150,000. (a) Compute figures which may be used as a basis for quoting, if the company adds 10% to the total cost for profit. (b) Prepare a quotation for a journey of 100 Km and return, assuming no return load and a total time of two days. Solution: 7 Operating Cost Sheet Standing Charges per Annum Rs. Insurance 65,000 License 13,000 Administration Overheads 350,000 Driver's wages, (52+2) Rs.5000 (to include holiday relief) 270,000 Other costs, 52 Rs.1000 (Con tribution to NHIF) 52, ,000 Kilometers covered per annum 30,000 (A) Standing charges per km 25
64 Running Charges per kilometre Rs. Depreciation 3.00 (650, )/(5*30,000) Fuel (400 / 20) Tyres (26000 / 10,000) 2.60 Lubricants (12000 / 30,000) 0.40 Repairs (150000)/(5*30000) 1.00 (B) Running Cost per Kilometer Total cost per kilometer (A + B) Standing charged per day ( / 250) 3,000
65 Question No. 8 The Murphy Manufacturing Company manufactures a single product that is processed in five departments. The following cost data is available for Deptt. 3 for the month of July, Opening work-in-process inventory: Rs. Cost transferred in from Deptt. 219,000 Deptt. 3 labor cost. 3,000 Current cost: Cost transferred in during July form Deptt ,000 Deptt. 3 material cost during July 36,680 Deptt. 3 labor cost during July 42,800 Material used in Deptt. 3 are added to the product at the end of the Deptt. 3 process. Deptt. 3 conversion costs are assumed to be incurred uniformly throughout the Deptt. 3 processes, manufacturing overhead is applied to product on the basis of 50 percent of labor costs. The following represents production data for Deptt. 3 for the month of July, Work-in-process (July 1) Units (1/3 completed) Units transferred in during July from Deptt ,000 units Goods units completed during July 80,000 spoiled units 12,000 Work in process (July 31) 28,000 Units (3/4 completed) Spoilage is detected by inspection upon completion of the product by Deptt. 3. Normal spoilage is considered to be 10% of the good output. Normal spoilage is considered a cost of the good units completed while abnormal spoilage is written off as a loss. Units lost during processing are considered to be a normal occurrence unless the number of lost units exceeds. 5 percent of total units accounted for (total units accounted for is equal to the sum of good units completed plus spoiled units plus units in ending inventory accounted for; company accountants make no attempt to specifically determine or separately identify the cost of normal lost units. Lost units in excess of 5 percent are considered abnormal. The cost of abnormal lost units is separately identified and written off as a loss. The company accountants follow the policy of assigning only transferred-in costs to abnormal lost units. You are required: Using FIFO method and consistent with the company s treatment of spoilage and lost units prepare a cost of Production Report for Deptt. 3.
66 Solution: 8 Quantity Schedule Input Output Opening Balance 18,000 Units transferred output from opening inventory 18,000 Transferred in 111,000 Units transferred out from current production 62,000 Normal spoilage(10% of 80,000) 8,000 Abnormal spoilage (12,000-8,000) 4,000 Normal loss (80, , ,000) x 5% 6,000 Abnormal loss (Balancing Figure) 3,000 Closing inventory 28, , ,000 Equivalent Production Transferred in % Material Added $ Labor % Overhead % Units transferred out from , ,000 2/3 12,000 2/3 opening inventory Units transferred from current 62, , , , production Normal spoilage -- 8, , , Abnormal spoilage -- 4, , , Normal loss Abnormal loss Closing inventory ,000 ¾ 21,000 3/4 92, , ,000 Transferred in (Rs.) Material added (Rs.) Labor (Rs.) Overhead (Rs.) Total (Rs.) Transferred in 105, ,000 Costs added -- 36,800 42,800 21, , ,000 36,800 42,800 21, ,000 Cost Per Unit (W-1) (W-1)= Rs. 105, ,000 =Rs.1.00 (input 111,000 normal loss 6,000) = Rs.36,800 92,000 =Rs.0.40 = = Rs. 42, ,000 Rs. 21, ,000 =Rs.0.40 =Rs.0.20
67 Cost accounted for Statement Transferred Material 1 Material Labor Overhead Total in (units) (Rs.) added (Rs.) (Rs.) (Rs.) (Rs.) Units transferred out form -- 7,200 4,800 2,400 14,400 opening inventory Units transferred from 62,000 24,800 24,800 12, ,000 current production Normal spoilage 8,000 3,200 3,200 1,600 16,000 Abnormal spoilage 4,000 1,600 1, ,000 Abnormal loss 3,000 3,000 Closing inventory 28,000 28, ,400 4,200 40, ,000 36,800 42,800 21, ,000 Process account Particulars Units Rs. Particulars Units Rs. Balance B/F 18,000 23,500 Finished goods 80, ,900 Transferred in Material 111, ,000 Normal spoilage 8, Labor 36,800 Abnormal 4,000 8,000 spoilage Overheads 42,800 Normal loss 6, ,400 Abnormal loss 3,000 3,000 Balance C/F 28,000 40, , , , ,500 Cost of Good output 80,000 units Rs. Opening WIP 18,000 Units 23,500 Cost added 14,400 37,900 Current production 62,000 x 2 124,000 Normal spoilage 16, ,900
68 Question No. 9 M Pty produces Biotinct in a lengthy distillation and cooling process. Base materials are introduced at the start of this process, and further chemicals are added when it is 80% complete. Each kilogram of base materials produces 1 kilogram of Biotinct. Data for October are: Opening work in process: 40 kg of base materials, 25% processed Cost of opening work in Base materials $1,550 process Processing $720 Costs incurred in October: Base materials (80 kg) $3,400 Conversion costs $6,864 Further chemicals $7,200 Closing work in process: 50kg of base materials, 90% processed Finished output: 65 kg of Biotinct Under normal conditions there are no losses of base materials in this process. However, in October 5kg of partially complete Biotinct were spoiled immediately after the further chemicals had been added. The 5kg of spoiled Biotinct were not processed to finished goods stage and were sold for a total of $200. Required: Using the FIFO method, prepare the process account for October.
69 Solution: 9 (a) Calculation of equivalent units (EU) BM = base materials; FC = further chemicals; CC = conversion costs; WIP = work in process BM FC CC Opening work in process Finished Abnormal loss Closing work in process TOTAL October s costs $3,400 $7,200 $6,864 Cost per EU $42 50 $60 00 $66 00 Calculation of costs BM FC CC Total $ $ $ $ Opening WIP (40kg) 1, Completion - 2, , Total cost 1, , , , Started and completed (25kg) 1, , , , Abnormal loss (5kg) Closing WIP (50kg) 2, , , , TOTAL COST 4, , , , Process account for October kg $ kg $ Opening inventory 40 2, Transfer to finished goods 65 10, Base materials 80 3, Abnormal loss Further chemicals 7, Closing inventory 50 8, Conversion costs 6, , ,734 00
70 Question No. 10 ZP Plc operator two subsidiaries X and Y, X is component manufacturing subsidiary and Y is an assembly and final product subsidiary. Both subsidiaries produce one type of output only. Subsidiary Y needs one component from subsidiary X for every unit of Product W produced. Subsidiary X transfers to Subsidiary Y all of the components needed to produce Product W. Subsidiary X also sell components o the external market. The following budgeted information is available for each subsidiary: X Y Market price per component $800 Market price per unit of W $1,200 Production costs per $600 component Assembly costs per unit of W $400 Non production fixed costs $1-5m $1-3m External demand 10,000 12,000 units units Capacity 22,000 Taxation rates units 25% 30% The production cost per component is 60% variable. The fixed production costs are absorbed based on budgeted output. X sets a transfer price at marginal cost plus 70%. Calculate the post tax profit generated by each subsidiary. Solution No. 10 X Y $ $ Sales 88,000,000 10, 000x $800 7,344,000 12,000 x $612 14,400,000 12,000 x $1,200 Cost 22,000 x $1,012 12,144,000 Fixed Costs Production 22,000 x $240 Non production 1, Profit 644, ,000 Tax 161, ,800 Profit after tax 483, ,200 X Y
71 Question No. 11 JP manufactures two joint products X and Y, and a by-product Z, in a single continuous process. The following information is available for period 3: Raw materials input 20,000 litres Raw material costs $52,000 Conversion costs $56,000 Outputs 10,000 litres of X, selling price $8 per litre 8,000 litres of Y, selling price $6 per litre 2,000 litres of Z, selling price $1 per litre Process costs are apportioned on a sales value basis. There was no opening and closing inventory of raw materials. The revenue from the by-product is used to reduce the process costs. What was the cost per litre of joint product X? A $5 889 B $6 523 C $6 625 D $6 646 Solution: 11 The answer is C $52,000 + $56,000 - $2,000 = $106,000 Sales Value Cost X $80, % $66,250 Y $48, % $39,750 $128,000 $106,000 $66,250/10,000 = $6 625
72
73 CHAPTER 4 ACTIVITY BASED COSTING (ABC)
74 The aim of the previous chapter was to provide you with an understanding of the various costing methods and techniques. Amongst these techniques, one of the most important and widely applicable internationally is Activity Based Costing (ABC). The aim of this chapter is to provide you with a conceptual understanding of ABC. Our focus will be an organization s existing products or services. There is also a need to manage future activities to ensure that only profitable products and services are launched. 1. The need for a cost accumulation system in generating relevant cost information for Decision-Making There are three main reasons why a cost accumulation system is required to generate relevant cost information for decision-making. They are: 1. Many indirect costs are relevant for decision-making; 2. An attention-directing information system is required that periodically identifies those potentially unprofitable products that require more detailed special studies; 3. Product decisions are not independent. (Colin Drury Cost & Management Accounting 7 th edition, pg: 238) 2. Types of Cost Systems:- Costing systems can vary in terms of which costs are assigned to cost objects and their level of sophistication. Typically, cost systems are classified as follows: 1. Direct costing systems; 2. Traditional absorption costing systems; 3. Activity-based costing systems Direct costing systems only assign direct costs to cost objects. Because they do not assign indirect costs to cost objects they report contributions to indirect costs. Periodic profitability analysis would thus be used to highlight negative or low contribution products. The disadvantage of direct costing systems is that systems are not in place to measure and assign indirect costs to cost objects. Direct costing systems can only be recommended where indirect costs are a low proportion of an organization s total costs. Both traditional and ABC systems assign indirect costs to cost objects. (Colin Drury Cost & Management Accounting 7 th edition, pg: 239) 3. A comparison of Traditional & ABC Systems: The following figure illustrates the major differences between traditional costing and ABC systems.
75 a) Traditional costing system Overhead cost accounts (For each individual category of expenses e.g. property taxes, depreciation etc.) First stage allocation Cost Centres 1 (normally departments) Cost Centres 2 (normally departments) Cost Centres N (normally departments) Second stage allocations (direct labor or machine hours) Cost objects (products, services and customers) b) Activity-based costing systems c) Overhead cost accounts (For each individual category of expenses e.g. property taxes, depreciation etc.) First stage allocations (resource cost drivers) Activity Cost Centre 1 Activity Cost Centre 2 Activity Cost Centre N d) Second stage allocations (activity cost drivers) Cost objects (products, services and customers) (Colin Drury Cost & Management Accounting 7 th edition, pg: 241)
76 4. The Emergence of ABC systems: During the 1980 s the limitations of traditional product costing systems began to be widely publicized. These systems were designed decades ago when most companies manufactured narrow range of products and direct labour and materials were the dominant factory costs. Overhead costs were relatively small, and the distortions arising from inappropriate overhead allocations were not significant. Information processing costs were high, and it was therefore difficult to justify more sophisticated overhead allocation methods. Today, companies produce a wide range of products; direct labour represents only a small fraction of total costs, and overhead costs are of considerable importance. Simplistic overhead allocations using a declining direct labour base cannot be justified, particularly when information processing costs are no longer a barrier to introducing more sophisticated cost systems. Furthermore, the intense global competition of the 1980 s has made decision errors due to poor cost information more probable and more costly. During the 1980s a few firms in the USA and Europe implemented ABC type systems. In a series of articles based on observations of innovative ABC type systems Cooper and Kaplan conceptualized the ideas underpinning these systems and coined the term ABC. These articles were first published in They generated a considerable amount of publicity and consultants began to market and implement ABC systems before the end of the decade. In a survey of UK companies Innes and Mitchell (1991) reported that approximately 10 per cent of the surveyed companies had implemented, or were in the process of implementing ABC. (Colin Drury Cost & Management Accounting 7 th edition, pg: 242) 5. Activity based costing (ABC):- An approach to the costing and monitoring of activities that involves tracing resource consumption and costing final outputs. Resources are assigned to activities and activities to cost objects based on consumption estimates. The latter use cost drivers to attach activity costs to outputs. (CIMA Official Terminology) Cost drivers and cost pools: A cost Driver is factor influencing the level of cost. Often used in the context of ABC to denote the factor which links activity resource consumption to product outputs, for example, the number of purchase orders would be a cost driver for procurement cost. (CIMA Official Terminology)
77 Examples of cost drivers Support department costs Possible cost driver Set-up Costs Number of production runs Production scheduling No. Of production runs Material handling Number of production runs Inspection costs Number of inspections or inspection hours Raw materials inventory handling Number of purchase orders etc delivered Despatch costs Number of customer orders delivered After-Sales Service Number of complaints All of the costs associated with a particular cost driver (for example production runs) would be grouped into cost pools. In order to understand how ABC operates in detail we need to look at two types of cost driver. A Resource Cost Driver is a measure of the quantity of resources consumed by an activity. It is used to assign the cost of the resource to an activity or cost pool. An Activity Cost Driver is a measure of the frequency and intensity of demand placed on activities by cost objects. It is used to assign activity costs to cost objects. An example of a resource cost driver is area, which can be used to assign office occupancy cost to purchasing, the accounts department and so on. An example of an activity cost driver is number of customer orders, the number of orders measuring the consumption of order entry activities by each customer. (CIMA performance Management 3rd edition, pg: 278 & 279) Stages in ABC Calculations: Step 1: Group overheads into cost pools, according to how they are driven. This involves gathering overheads that are caused by the same activity into one group and is done by means of resource cost drivers. Step 2: Identify the cost drivers for each activity (that is, what causes the activity to be incurred). Step 3: Calculate a cost per unit of cost driver. This is done in a similar way to the calculation of traditional overhead absorption rates. Cost driver rate= Total cost of activity/ Cost driver
78 Step 4: Absorb activity costs into production based on the usage of cost drivers for example, rate per production set-up multiplied by number of production set-ups. The cost driver rate can be used to cost products, as in traditional absorption costing, but it can also cost other cost objects such as customers or groups of customers. (CIMA performance Management 3rd edition, pg: 279) 6. The merits and demerits of activity based costing:- Merits: a) Once the necessary information has been obtained, it is similar to traditional absorption costing. Therefore, this method is simple. b) Multiple cost drivers make this method more recognizable. c) This method is concerned with all overhead costs. d) This method helps with cost reduction. e) ABC can be used in conjunction with Customer profitability analysis (CPA). f) This method can be used by service and retail organizations. Demerits: a) Activity based costing has some serious flaws and concern is now growing that ABC is seen by many as a panacea for management accounting ills, despite the fact that its suitability for all environments remains unproven. b) The cost of obtaining and interpreting the new information may be considerable. ABC should not be introduced unless it can provide additional information. c) Some arbitrary cost apportionment may still be required at the cost pooling stage for items like rent, rates and building depreciation. d) Many overheads relate neither to volume nor to complexity. The ability of a single cost driver to fully explain the cost behaviour of all items is questionable. e) There will have to be a trade off between accuracy, the number of cost drivers and complexity. f) ABC tends to burden low-volume (new) products. Some people have questioned the fundamental assumption that activities cause cost, they that there may be no clear cause of cost.
79 Question:1 K makes many products, one of which is Product Z. K is considering adopting an activitybased costing approach for setting its budget, in place of the current practice of absorbing overheads using direct labour hours. The main budget categories and cost driver details for the whole company for October are set out below, excluding direct material costs: Budget category Cost driver details Direct labour 128,000 8,000 direct labour hours Set-up costs 22, set-ups each month Quality testing costs* 34, tests each month Other overhead costs 32,000 absorbed by direct labour hours Other overhead costs 32,000 absorbed by direct labour hours * A quality test is performed after every 75 units produced The following data for Product Z is provided: Direct materials Direct labour Batch size Set-ups Budgeted volume for October budgeted cost of per unit budgeted at 0 3 hours per unit 30 units 2 set-ups per batch 150 units a. Calculate the budgeted unit cost of product Z for October assuming that a direct labour based absorption method was used for all overheads. b. Calculate the budgeted unit cost of product Z for October using an activitybased costing approach.
80 Solution:1 a. Total overhead cost 88,000 Direct labour hours 8,000 Absorption rate 11 per direct labour hour Budgeted unit cost for product Z for October is: Direct materials Direct labour 0 3 x Overhead costs 0 3 x Total unit cost a. Cost driver rates are needed Set-ups 22,000/88 = Quality tests 34,000/40 = Other overheads 32,000/8,000 = (note this is not a true cost driver) 250 per set-up 850 per test 4 per direct labour hour b. Activity-based cost of product Z Direct materials Direct labour 4 80 Set-up costs 2 x 250/ Quality tests 850/ Other overhead costs 0.3 ā Total activity-based costs for October An alternative approach to these calculations would be: Set-up costs = [(150 / 30) x 2 x 250]/150 = Quality costs = (2 x 850) / 150 = 11 33
81 Question 2 F plc supplies pharmaceutical drugs to drug stores. Although the company makes a satisfactory return, the directors are concerned that some orders are profitable and others are not. The management has decided to investigate a new budgeting system using activity based costing principles to ensure that all orders they accept are making a profit. Each customer order is charged as follows. Customers are charged the list price of the drugs ordered plus a charge for selling and distribution costs (overheads). A profit margin is also added, but that does not form part of this analysis. Currently F plc uses a simple absorption rate to absorb these overheads. The rate is calculated based on the budgeted annual selling and distribution costs and the budgeted annual total list price of the drugs ordered. An analysis of customers has revealed that many customers place frequent small orders with each order requesting a variety of drugs. The management of F plc has examined more carefully the nature of its selling and distribution costs, and the following data have been prepared for the budget for next year: Total list price of drugs supplied 8m Number of customer orders 8,000 Selling and Distribution Costs 000 Cost driver Invoice processing 280 See Note 2 Packing 220 Size of package see Note 3 Delivery 180 Number of deliveries see Note 4 Other overheads 200 Number of orders Total overheads 880 Notes: 1. Each order will be shipped in one package and will result in one delivery to the customer and one invoice (an order never results in more than one delivery). 2. Each invoice has a different line for each drug ordered. There are 28,000 invoice lines each year. It is estimated that 25% of invoice processing costs are related to the number of invoices, and 75% are related to the number of invoice lines. 3. Packing costs are 32 for a large package, and 25 for a small package. 4. The delivery vehicles are always filled to capacity for each journey. The delivery vehicles can carry either 6 large packages or 12 small packages (or appropriate combinations of large and small packages). It is estimated that there will be 1,000 delivery journeys each year, and the total delivery mileage that is specific to particular customers is estimated at 350,000 miles each year. 40,000 of delivery costs are related to loading the delivery vehicles, and the remainder of these costs are related to specific delivery distance to customers. The management has asked for two typical orders to be costed using next year s budget data, using the current method, and the proposed activity-based costing approach. Details of two typical orders are shown below: Order A Order B Lines on invoice 2 8 Package size Small large Specific delivery distance 8 miles 40 miles List price of drugs supplied 1,
82 Required: (a) Calculate the charge for selling and distribution overheads for Order A and Order B using: (i) the current system; and (ii) the activity-based costing approach. (b) Write a report to the management of F plc in which you (i) assess the strengths and weaknesses of the proposed activity-based costing approach for F plc; and (ii) recommend actions that the management of F plc might consider in the light of the data produced using the activity-based-costing approach.
83 Solution#2 (a) (i) (ii) Current system 880,000 / 8m = 11% of list price of drugs supplied Thus Order A will have a charge of 1,200 x 0 11 = 132 Order B will have a charge of 900 x 0 11 = 99 Proposed system Cost driver rates Invoice costs Charge per invoice= 70,000 / 8,000 = 8 75 per invoice Charge per invoice line = 210,000 / 28,000 = 7 50 per line Delivery costs Charge per delivery trip = 40,000 / 1,000 = 40 per trip So for large package = 40 / 6 = 6 67 For small package = 40 / 12 = 3 33 Charge per delivery mile = 140,000 / 350,000 = 0 40 per mile Other overheads allocated by orders (this is not a genuine cost driver) 200,000 / 8,000 = 25 per order Overhead costs Order A Order B Invoice costs 1 x 8 75 = x 8 75= x 7 50 = = Packing Delivery 1 x 3 33 = x 6 67 = x 0 40 = x 0 40 = Other overhead costs Total charge for overheads (b) Report to the Management of F plc on the Implications of Implementing an Activity-Based Costing Approach. From A.Candidate Date May This report covers two issues: (i) an assessment of the strengths and weaknesses of the proposed activity-based costing approach, and (ii) recommendations for action the Management of F plc might take. i. All budgeting systems have strengths and weaknesses, and these are in part related to the specific circumstances of the company. For F the following are relevant. Strengths include: Better understanding of the cost structure and what is driving costs. Ability to set prices that relate to the actual resources consumed, which should result in few or no loss-making orders being accepted. Highlights where costs are being incurred which should lead to action to reduce activities that have high costs. Prices could be defended if challenged by customers. Out-sourcing decisions can be analysed more easily.
84 Weaknesses might include: The costs may exceed benefits. The activity data is still very aggregated and may not be detailed enough to reveal important cost behaviour, for example the high cost of the longest distance category might be distorted by some very long deliveries. There are still arbitrary elements in the ABC system, particularly other overhead costs which means care must be taken with the data. (ii) The following recommendations could be made to the directors of F plc. The present policy is cost based. This approach is simple and relatively cheap to operate. However, such a policy is unlikely to be optimal, and will only be viable where the company is able to sell all its output. Thus, assuming that price is not closely linked to demand, a pricing policy that does no more than simply recover overheads and produce a profit may be deemed satisfactory. In this case, although the current charge for overheads is simple and cheap to calculate, it does not reflect the actual costs incurred by each order. The new activity-based costing (ABC) system produces a measure of cost that better reflects the resources that have been used. This new ABC system produces very different costs to the previous system. However, the new costing system used, although a very simple version of ABC, is probably too complex for a pricing system. As the first step in a review it would be instructive to check whether some orders are actually losing money. The activity-based cost analysis indicates that orders with many different products and those delivered over a long distance are expensive, in comparison with orders for a larger volume of few products with shorter delivery distances. F will need to develop a pricing structure that would enable some of the key cost drivers to be reflected in the prices charged, and to let customers know the charge in advance. Another possible strategy would be to stop accepting long distance orders by imposing a distance limit. It might be possible to out-source long distance deliveries, possibly along with a high charge for the long distance band in the charging table, as mentioned above. The costs based on the number of items on the invoice become very high when multiple products are ordered. This needs careful review. Would better systems using newer technology reduce these invoice costs this is highly likely.
85 Question:3 K makes many products, one of which is Product Z. K is considering adopting an activity-based costing approach for setting its budget, in place of the current practice of absorbing overheads using direct labor hours. The main budget categories and cost driver details for the whole company for October are set out below, excluding direct material costs: Budget category Dost driver details Direct labor 128,000 8,000 direct labor hours Set-up-costs 22, set-ups each month Quality testing costs* 34, tests each month Other overheads costs 32,000 Absorbed by direct labor hours *A quality test is performed after every 75 units produced The following data for Product Z is provided: Direct materials Direct labor Batch size Set-ups Budgeted volume for October Budgeted cost of per unit Budgeted at 0.3 hours per unit 30 units 2 set-ups per batch 150 units a. Calculate the budgeted unit cost of product Z for October assuming that a direct labor based absorption method was used for all overheads. b. Calculate the budgeted unit cost of product Z for October using and activity-based costing approach. c. Explain in less than 50 words, why the costs absorbed by a product using an activitybased costing approach could be higher than those absorbed if a traditional laborbased absorption system were used, and identify two implications of this for management
86 Answer:3 a. Total overhead cost 88,000 Direct labour hours 8,000 Absorption rate 11 per direct labour hour Budgeted unit cost for product Z for October is: Direct materials Direct labour 0 3 x Overhead costs 0 3 x Total unit cost b. Cost driver rates are needed Set-ups 22,000/88 = Quality tests 34,000/40 = Other overheads 32,000/8,000 = (note this is not a true cost driver) 250 per set-up 850 per test 4 per direct labour hour Activity-based cost of product Z Direct materials Direct labour 4 80 Set-up costs 2 x 250/ Quality tests 850/ Other overhead costs 0 3 x Total activity-based costs for October An alternative approach to these calculations would be: Set-up costs = [(150 / 30) x 2 x 250]/150 = Quality costs = (2 x 850) / 150 = C. Costs under ABC could be higher where: there is production complexity not represented in direct labour hours; small batch sizes; or high levels of non-manufacturing activity. This may lead management to: increase batch sizes, simplify processes to reduce activities, or review pricing if this is not in line with ABC costs.
87 Question 4: F plc supplies pharmaceutical drugs to drug stores. Although the company makes a satisfactory return, the directors are concerned that some orders are profitable and others are not. The management has decided to investigate a new budgeting system using activity based costing principles to ensure that all orders they accept are making a profit. Each customer order is charged as follows. Customers are charged the list price of the drugs ordered plus a charge for selling and distribution costs (overheads). A profit margin is also added, but that does not form part of this analysis. Currently F plc uses a simple absorption rate to absorb these overheads. The rate is calculated based on the budgeted annual selling and distribution costs and the budgeted annual total list price of the drugs ordered. An analysis of customers has revealed that many customers place frequent small orders with each order requesting a variety of drugs. The management of F plc has examined more carefully the nature of its selling and distribution costs, and the following data have been prepared for the budget for next year: Total list price of drugs supplied 8m Number of customer orders 8,000 Selling and Distribution Costs 000 Cost driver Invoice processing 280 See Note 2 Packing 220 Size of package see Note 3 Delivery 180 Number of deliveries see Note 4 Other overheads 200 Number of orders Total overheads 880 Notes: 1. Each order will be shipped in one package and will result in one delivery to the customer and one invoice (an order never results in more than one delivery). 2. Each invoice has a different line for each drug ordered. There are 28,000 invoice lines each year. It is estimated that 25% of invoice processing costs are related to the number of invoices, and 75% are related to the number of invoice lines. 3. Packing costs are 32 for a large package, and 25 for a small package. 4. The delivery vehicles are always filled to capacity for each journey. The delivery vehicles can carry either 6 large packages or 12 small packages (or appropriate combinations of large and small packages). It is estimated that there will be 1,000 delivery journeys each year, and the total delivery mileage that is specific to particular customers is estimated at 350,000 miles each year. 40,000 of delivery costs are related to loading the delivery vehicles and the remainder of these costs are related to specific delivery distance to customers. The management has asked for two typical orders to be costed using next year s budget data, using the current method, and the proposed activity-based costing approach. Details of two typical orders are shown below:
88 Order A Order B Lines on invoice 2 8 Package size small Large Specific delivery distance 8 miles 40 miles List price of drugs supplied 1, Required: (a) Calculate the charge for selling and distribution overheads for Order A and Order B using: (i) (ii) the current system; and the activity-based costing approach. (b) Write a report to the management of F plc in which you (i) (ii) assess the strengths and weaknesses of the proposed activity-based costing approach for F plc; and recommend actions that the management of F plc might consider in the light of the data produced using the activity-based-costing approach.
89 Answer 4: (a) (i) Current system 880,000 / 8m = 11% of list price of drugs supplied Thus Order A will have a charge of 1,200 x 0 11 = 132 Order B will have a charge of 900 x 0 11 = 99 (i) Proposed system Cost driver rates Invoice costs Charge per invoice= 70,000 / 8,000 = Charge per invoice line = 210,000 / 28,000 = Delivery costs Charge per delivery trip = 40,000 / 1,000 = 8 75 per invoice 7 50 per line 40 per trip So for large package = 40 / 6 = 6 67 For small package = 40 / 12 = 3 33 Charge per delivery mile = 140,000 / 350,000 = 0 40 per mile Other overheads allocated by orders (this is not a genuine cost driver) 200,000 / 8,000 = 25 per order Overhead costs Order A Order B Invoice costs 1 x 8 75 = x 8 75 = x 7 50 = x 7 50 = Packing Delivery 1 x 3 33 = x 6 67 = x 0 40 = x 0 40 = Other overhead costs Total charge for overheads (b) Report to the Management of F plc on the Implications of Implementing an Activity-Based Costing Approach. From A. Candidate Date May This report covers two issues: (i) an assessment of the strengths and weaknesses of the proposed activity-based costing approach, and (ii) recommendations for action the Management of F plc might take.
90 (i) All budgeting systems have strengths and weaknesses, and these are in part related to the specific circumstances of the company. For F the following are relevant. Strengths include: Better understanding of the cost structure and what is driving costs. Ability to set prices that relate to the actual resources consumed, which should result in few or no loss-making orders being accepted. Highlights where costs are being incurred which should lead to action to reduce activities that have high costs. Prices could be defended if challenged by customers. Out-sourcing decisions can be analysed more easily. Weaknesses might include: The costs may exceed benefits. The activity data is still very aggregated and may not be detailed enough to reveal important cost behaviour, for example the high cost of the longest distance category might be distorted by some very long deliveries. There are still arbitrary elements in the ABC system, particularly other overhead costs which means care must be taken with the data. (ii) The following recommendations could be made to the directors of F plc. The present policy is cost based. This approach is simple and relatively cheap to operate. However, such a policy is unlikely to be optimal, and will only be viable where the company able to sell all its output. Thus, assuming that price is not closely linked to demand, a pricing policy that does no more than simply recover overheads and produce a profit may be deemed satisfactory. In this case, although the current charge for overheads is simple and cheap to calculate, it does not reflect the actual costs incurred by each order. The new activity-based costing (ABC) system produces a measure of cost that better reflects the resources that have been used. This new ABC system produces very different costs to the previous system. However, the new costing system used, although a very simple version of ABC, is probably too complex for a pricing system. As the first step in a review it would be instructive to check whether some orders are actually losing money. The activity-based cost analysis indicates that orders with many different products and those delivered over a long distance are expensive, in comparison with orders for a larger volume of few products with shorter delivery distances. F will need to develop a pricing structure that would enable some of the key cost drivers to be reflected in the prices charged, and to let customers know the charge in advance. Another possible strategy would be to stop accepting long distance orders by imposing a distance limit. It might be possible to out-source long distance deliveries, possibly along with a high charge for the long distance band in the charging table, as mentioned above.
91 The costs based on the number of items on the invoice become very high when multiple products are ordered. This needs careful review. Would better systems using newer technology reduce these invoice costs this is highly likely.
92 CHAPTER 5 COSTING TECHNIQUES I ABSORPTION COSTING & MARGINAL COSTING
93 5.1 MARGINAL COSTING - DIRECT COSTING Marginal costing is a costing technique which charges the product with only those costs that vary directly with volume of production. Only the prime cost plus variable Factory Overhead are used to value closing stock and determines the cost of goods sold. Variable or direct costs such as direct material, direct labor, and variable factory overhead are examples of costs chargeable to production. Fixed costs like depreciation, rent, insurance etc, are excluded. Further exclude salaries of the executives and managerial staff, supervisors, foremen and office and sales employees. Marginal costing is a useful technique for studying the effects of changes in 'volume and type of output in a multi-product business. It is an accounting technique which determines the marginal cost by distinguishing between fixed and variable costs. The primary purpose of marginal costing is to provide information to management on the effects on costs and revenues of changes in the volume and type of output in the short-run.. The contribution approach highlights the behavior of costs and classifies them accordingly, by identifying variable costs and fixed costs. Work in progress and finished goods valued at their marginal costs: The marginal cost of sales is deducted from sales revenue to give the contribution. Fixed costs for the period are deducted from the contribution to give the profit for the period. Marginal costing is not a method of costing on the lines of job or process costing, but is a special technique which presents management with information enabling it to measure the profitability of an undertaking by considering the behavior of costs. Marginal' costing may be used in conjunction with other costing methods like job or process costing OJ; with other techniques such as standard costing or budgetary control. The CIMA London has defined marginal cost as the amount at any given volume of output by which aggregate costs are changed, if volume of output is increased or decreased by one unit. In simple words, marginal cost is the additional cost of producing additional units. An important point is that marginal cost per unit remains unchanged irrespective of the level of activity.. Marginal costing is defined by CIMA London as the ascertainment of marginal cost, by differentiating between fixed and variable costs, and of the effect on profit of changes in volume or type of output. (CIMA Official Terminology) 5.2 CHARACTERISTICS OF MARGINAL COSTING The essential characteristics of marginal costing technique are as follows:
94 1. Segregation of costs into fixed and variable elements. In marginal costing all cost are segregated into fixed and variable elements and there is no third category of costs. 2. Marginal costs as product costs. Only marginal (variable) costs are charged to products. 3. Fixed costs as period costs. Fixed costs are treated as period costs and rare charged to costing Profit and Loss Account of the period in which they are incurred. 4. Valuation of inventory. The work-in-progress and finished stocks are valued at marginal cost only. 5. Contribution. Contribution is the difference between sales value and marginal cost of sales. The relative profitability of products or departments is based on a study of contributions made by each of the products or departments. 6. Pricing. In marginal costing, prices are based on marginal cost plus contribution. (ICMA Practice Manual Part IV & Final) 5.3 Marginal Costing Vs. Absorption Costing: Points of difference 1. Classification of fixed and variable overheads may be difficult and some times ABSORPTION COSTS i. fixed overhead absorbed ii. by product Since classification is unnecessary problems do not arise. Marginal cost i. fixed overhead expensed by ii. period Difficult with semi-fixed / semi variable cost, need to be separated.
95 somewhat arbitrary 2. Stock valuation Include full production costs on the arguments that these have been necessarily incurred 3. Profit If stock holdings increase to accord with operation during period higher valuation of stock higher profit 4. Use of costs for purpose Will have full costs as the pricing of products 5. Recovery of fixed overhead Problem of determining activity level for the absorption of fixed overhead use of normal activity with recovery variance being treated as period 6. Fixed cost may not be controllable at product or department level Allocation my cause danger of trying to control the uncontrollable 7. Overhead costs Prices based on product cost will be more volatile. 8. Other techniques Fits in well with standard absorption costing 9. Contribution Has to be calculated separately to ensure good decision 10. Tax Recommended by accounting standards Include variable costs only accords with the argument that the additional cost of the stock is limited to its variable costs. The prudence principle results in lower stock valuation, lower profit. If fixed overheads are not included in production costs prices quoted might be too low. Activity problem does not arise as fixed overheads expensed as a period expense to which they relate. Only controllable cost are include in product costs at centre level. Pricing variable is closely related to variable costs. Pricing variability is closely related to variable costs. Already computed to help in decision making Not recommended by standards 5.3 Reconciling Profit Figures: Reconciling the profit figures given by the two methods The difference in profits reported using marginal costing and absorption costing is due to the different inventory valuation methods used. a) Inventory levels increase during the period Absorption costing will report the higher profit. Some of the fixed production overhead incurred during the period will be carried forward in closing inventory (which reduces cost of sales) to be set against sales revenue in the following period instead of being written off in full against profit in the period concerned. b) Inventory levels decrease during the period Absorption costing will report the lower profit. As well as the fixed overhead incurred, fixed production overhead which had been carried forward in opening inventory is released and is also included in cost of) Advantages:
96 1. The calculation of contribution to sales (c/s Ratio) helps management to decide which products are most profitable and therefore to which products priority should be given. The combination of a high c/s ratio and a high volume of sales is the key to profitability. 2. The contribution margin guides management to decide whether a product should be dropped or a particular department closed. 3. The contribution approach can be used to evaluate proposed price reductions, advertising campaigns. The effect or price reductions or additional expenditure can be compared with the contribution general on additional sales. 4. Cost Volume profit analysis can be carried out to calculate the number of units to be sold to achieve certain level of profit. 5. The contribution approach helps to provide the information required to determine the most profitable use of existing resources. 6. The contributions approach helps managers determine the minimum price which should be charged for products. 7. The contribution is a key measure of profitability, because it is the difference between sales proceeds and variable costs, 8. Marginal costing reports are more easily understood by management. 9. Clerical cost is lower under marginal costing because the method is simpler and does not require involved allocations of fixed costs. 10. The computation of product costs is simpler and more reliable under direct costing because only variable costs should be, identified with production. Fixed costs are the expenses of maintaining productive capacity and such expenses occur with the passage of time and not with the utilization of the facilities. Disadvantages: 1. Separation of costs into fixed and variable costs might be difficult, especially when such costs are semi- variable in nature. 2. Long-range pricing of products require additional separate computation to allocate fixed overhead. 3. The pricing of inventories by marginal costing method is not acceptable for tax purposes. 4. Direct costing is not generally accepted under international accounting standards in preparation of financial statement. 5. Profits determined by direct costing are not true and proper because of the exclusion of fixed production costs which are a part of total production cost and inventory. Production would not be possible without plant facilities, etc. To disregard these fixed costs violates the general principle of matching costs with revenues. The elimination of fixed costs from inventory results in a lower figure and consequent reduction of reported working capital for financial analysis purposes. The decrease in working capital may also weaken the borrowing position. Relevant Range: When a breakeven chart is constructed, assumptions are made about the level of fixed costs, the selling price and variable costs. 'In practice these assumptions will only be valid within a limited range of output and this is known as the relevant range. It will be the range of likely output levels within which these assumptions will still hold true. Product Costs and Period Costs: This is another name of variable cost, and fixed costs. The variable costs vary with the volume" of production and therefore treated as product cost while fixed costs do not vary with volume of production and therefore treated as period cost. The product costs increase in total with increase in volume of production, but remain constant per unit in short-run while the period costs remain
97 constant in total but increase/ decrease with change in volume of production; but the period costs increase/decrease per unit. Another important aspect of product cost is that it is not necessarily the variable cost should vary exactly in the same proportion as the volume of production. Usually direct material, direct labor, direct expenses and only variable factory overheads are treated as product costs; all fixed overheads depreciation, rent and insurance will be treated as period cost. Wages of certain factory employees such as maintenance crew, guards etc. are also considered as period costs. Limiting Factor: The activities of every organization are limited by some factors like sales, material, labor force, production facilities; otherwise it would expand its activities to an infinite extent. The factor which effectively limits the activities of a particular business is known as the limiting factor/key factor. If there is more than one limiting factor it will be necessary to use an operation research techniques like a linear programming to determine the optimal plan. We should compare contribution to key factor ratio, the highest contribution/key factor ratio must be selected to maximize contribution. Profit volume Ratio or Contribution to sales Ratio P/V Ratio or C/S Ratio It is also known as contribution to sales ratio (c/s ratio). Contribution, i.e. sales - variable cost, divided by sales revenues gives the c/s ratio. It indicates the amount available to cover fixed cost and profit. If the contribution is equal to fixed cost i.e. breakeven point. Contribution C/S ratio = x 100 Sales This relationship will always remain the same as long as the variable cost per unit and the sales price per unit do not change. 5.4 Break-Even & Cost-Volume Profit Analysis: Break-even analysis indicates the point at which the company neither makes a profit nor suffers a loss. Cost-volume-profit analysis, is integrally related to break-even analysis, is concerned with determining the optimal level and mix of output to be produced with available resources The Nature of Break-even analysis Break-even analysis determines at what level cost and revenue are in equilibrium. The break-even point, obtained directly by mathematical computation is usually presented in graphic form because it not only shows management the point at which neither a profit nor a loss occurs, but also indicates the possibilities associated with changes in costs or sales. Thus a break-even chart can be defined as a graphic analysis of the relationship of costs and sales to profit. Break-even analysis is generally accomplished with the aid of a break-even chart because it is a compact, readable reporting device. Data for break-even analysis cannot be taken directly from the conventional or full-cost income statement. The form of the statement and the manner in which data are presented do not permit a convenient and practical analysis for planning, policy making, and profit determination. Therefore, each expense shown in the conventional income statement must be analyzed to determine its fixed and variable portions. Of the three classes of expenses fixed, semi-variable, and variable the semi-variable expenses must be separated into their fixed and variable components. The fixed portion is stated as a total figure; the variable portion as a rate or a percent Break-even analysis- Introduction (Knowledge brought forward) Break-Even analysis or Cost-Volume-Profit Analysis (CVP) is The study of the effects on future profit of changes in fixed cost, variable cost, sales price, quantity and mix. (CIMA Official Terminology) Contribution per unit = unit selling price unit variable costs Profit = (Sales volume x contribution per unit) fixed costs Break-even point = activity level at which there is neither profit nor loss = total fixed costs
98 Contribution per unit Contribution/Sales(C/S) ratio=profit/volume (P/V) ratio = (contribution/sales) * 100% Margin of Safety: (M.O.S) The margin of safety is a selected sales figure less breakeven sales. The margin of safety is a cushion against sales decreases. The greater the margin, the greater the security. The margin of safety figure is determined by subtracting breakeven sales from a selected sales figure. The margin of safety figure is determined by subtracting breakeven sales form a selected sales figure. Sales Rs. 100,000 Breakeven point Rs. 80,000 MOS = 100,000 80,000 = 20,000/100,000 x 100 = 20% a. The assumptions underlying breakeven analysis 1. The behavior of costs and revenue has been correctly estimated and is linear over the relevant range. 2. Variable costs vary directly and proportionately with the level of output. 3. Fixed costs remain constant over wide ranges of output. 4. Selling prices remain unchanged whatever the level of sales 5. Semi-variable cost can be identified and re-classified into their fixed and variable elements. 6. Efficiency and productivity remain unchanged. 7. The analysis relates to one product only or to a constant mix of products 8. constant. 9. Volume is the only factor that affects costs. This is of course, a simplification, but one that is necessary for a graphical presentation. 10. Sales price, variable costs and fixed costs will change over a period of time. 11. The fixed costs which are included in the analysis are those which can be identified with the particular products. No attempt should be made to apportion the costs between products. The main difference between the accountant s breakeven chart and that of the economist is the assumption of linearity. The accountant assumes a constant variable cost per unit whereas the economist assumes a variable cost per unit which changes with the level of production. The accountant assumes a constant sales price which does not vary with the level of sales, but the economist assumes that price reduction may be necessary to increase the volume of sale. The Cost-volume/Profit chart attempts to determine the effect. That a change in volume, cost, price and product mix have on profit. The cost-volume profit chart can serve multipurpose analysis while breakeven chart assist to caution that the sales should not be allowed to reduce from a certain level if company wants to avoid losses. One major problem of cost-volume project analysis is that it ignores profitability in relation to capital employed in the business. Application of Break-even analysis: Some of the important uses of break-even analysis are: 1. Determination of the break-even point. 2. Determination of the selling price which will give the desired profit.
99 3. Fixation of the sales volume to earn a desired profit or return on capital employed. 4. Determination of the costs and revenue at different levels of output. 5. Determination of the most profitable sales mix. 6. Determination of comparative profitability of each profit line. 7. Impact of increase or decrease in fixed and variable costs on profits. 8. Comparison of profitability of various firms. 9. Aid in management decision making e.g. in makes or buy decisions, discontinuance of a product lime, acceptance of special job, etc. Limitations of Break-even Analysis: Although break even analysis is an invaluable tool of management, there are some limitations from which the technique suffers. These limitations of break-even analysis arise from certain assumptions on which the analysis is based and which are, in effect, not lure. The assumptions of break-even analysis are as under: 1. The assumption that all cost can be clearly separated into fixed and variable components is not possible to achieve accurately in practice, resulting in inaccurate break even ab / kysis. 2. The assumption that variable cost per unit remains and that given a straight line chart is also not ways a. In practice many of the variable costs do not observe this tendency. Most of the variable costs, not doubt, in practice many of the variable costs do not observe this tendency. Most of the variable costs, no doubt, more in sympathy with the volume of production but not necessarily in direct proportion to the volume. 3. Similarly the assumption that fixed cost remains constant is also unrealistic. Fixed costs are constant only within a limited range of output and tend to increase by a sudden jump when additional plant and machinery is introduced. 4. The assumption regarding selling prices remaining unchanged as volume changes is also not true. In practice, selling prices do not remain fixed and changed in prices affects demand. Any increase in output can be sold only by effecting a reduction in selling price which would affect the sales line. 5.5 Linear Programming: Previously, we saw how to determine the profit-maximizing allocation of resources when an organization is faced with just one resource constraint. When there is more than one resource constraint, the technique of linear programming can be used. This technique can be applied to problems with the following features. 1. There is a single objective, which is to maximize or minimize the value of a certain function. The common objective is usually to maximize contribution or minimize cost. 2. There are several constraints, typically scarce resources that limit the value of the objective function. (CIMA performance Management 3rd edition, pg: 111) A definition of linear programming: Linear Programming is The use of a series of linear equations to construct a mathematical model. The objective is to obtain an optimal solution to a complex operational problem, which may involve the production of a number of products in an environment in which there are many constraints. (CIMA Official Terminology) Techniques of linear programming: There are two linear programming techniques. The graphical method is used for problems involving two products. The Simplex method is used if the problem involves more than two products. Example: WX Ltd The following example will be used throughout the chapter to illustrate the graphical method of linear programming. WX Ltd manufactures two products, A and B. Both products pass through two production departments, mixing and shaping. The organization s objective is to maximize contribution to fixed costs.
100 Product A is sold for Rs. 150 whereas product B is priced at Rs There is unlimited demand for product A but demand for B is limited to 13,000 units per annum. The machine hours available in each department are restricted to 2,400 per annum. Other relevant data are as follows. Machine hours required Mixing Hrs. Shaping Hrs. Product A Product B Variable cost per unit Rs. Product A 130 Product B 170 Solving the problem using the graphical method: 1. The steps in the graphical method are as follows. 2. Define variables 3. Establish objective function 4. Establish constraints 5. Draw a graph of the constraints 6. Establish the feasible region 7. Determine the optimal product mix. Machine hours required Mixing Hrs. Shaping Hrs. Product A Product B Variable cost per unit Rs. Product A 130 Product B 170 Step#1: Define variables What are the quantities that WX can vary? Obviously not the number of machine hours or the demand for product B. The only things which it can vary are the number of units of each type of products
101 Solving the problem using the graphical method: 8. The steps in the graphical method are as follows. 9. Define variables 10. Establish objective function 11. Establish constraints 12. Draw a graph of the constraints 13. Establish the feasible region 14. Determine the optimal product mix. Step#1: Define variables What are the quantities that WX can vary? Obviously not the number of machine hours or the demand for product B. The only things which it can vary are the number of units of each type of product produced. It is those numbers which the company has to determine in such a way as to obtain the maximum possible profit. The variables (which are usually products being produced) will therefore be as follows. Let x = number of units of product A produced. Let y = number of units of product B produced. Step#2: Establish objective function The Objective Function is a quantified statement of the aim of a resource allocation decision. The objective of the company is to maximize contribution and so the objective function to be maximized is as follows. Contribution (C) = 20X + 30Y Step#3: Establish constraints A Constraint is An activity, resource or policy that limits the ability to achieve objectives. (CIMA Official Terminology) The value of the objective function (the maximum contribution achievable from producing products A and B) is limited by the constraints facing WX, however. To incorporate this into the problem we need to translate the constraints into inequalities involving the variables defined in Step 1. An inequality is an equation taking the form greater than or equal to or less than or equal to.
102 Marginal Costing Question#1 Mr. K. Shah manufactures suitcases in a small factory in Lahore s Industrial Area. His total labor force is only 20 people. Mr. Kazim is employed as an accounts clerk in charge of maintaining the financial records of the factory. At the end of 2012 the summarized the factory s transactions for the year as follows:- Rs. (a) Raw Materials: January 1 80,000 Purchases 460,000 December 31 40,000 (b) Factory Lease Payments: Outstanding January 1 20,000 Payments 140,000 (c) Water and Electricity (Note 1) Outstanding January 1 4,000 Payments 18,000 Outstanding December 31 6,000 Note (1) includes standing charges of Rs.10,000 per annum (d) Production costs: Total factory wages (Note 2) 359,000 Machinery depreciation 80,000 Note (2) Factory wages included Rs. 19,000 of overtime premium which were chargeable as management expenses to encourage better production planning. (e) General manager's car running expenses: Petrol 76,000 Maintenance and Depreciation 24,000 (f) Selling and administration salaries 120,000 (g) Production in the year was 20,000 suitcases (h) Sales in the year were 19,000 suitcases (i) Selling price averaged at Rs.67 per suitcase (j) Selling expenses included Rs.30,000 for advertisement and a sales commission of Rs.5 per suitcase. A partially qualified accountant hired by Mr. Shah to prepare his final accounts on the basis of the above information calculated at Mr. Shah s Profit for the year amounted to only 2,000. Dissatisfied with the outcome, Mr. Shah gave the same information to his nephew, a second year B.Com. student at Punjab University. The latter calculated that Mr. Shah s results for the year showed a loss of Rs.8,500. Mr. Shah totally dismayed as to whether accounting is really a profession comes to you with the two differing results together with the clerk s summary for your guidance.
103 Required: (i). Assuming that both the accountant and the student were correct on basis of their individual assumptions, show Mr. Shah how each one of them arrived at his profit or loss figure. (ii). Reconcile their two results for Mr. Shah. (iii). Explain to Mr. Shah of the two costing approaches you favor and why
104 Solution Question#1:"Mr. K Shah" (i). Mr. K Shah Income Statement (Absorption Costing) Rs. Sales (19,000*67/-) 1,273,000 Cost of sales: Raw material used 500,000 Factory wages 340,000 Factory overhead 120,000 Water& electricity Fixed 10,000 20,000 Depreciation 80, ,000 1,060,000 Closing stock [(1,060,000/ 20,000)*1,000] 53,000 1,007, ,000 Selling and administration expenses: Advertisement 30,000 Sales commission 95,000 Sales and admin expense 120,000 Overtime 19, ,000 Profit for the year 2,000 (It is assumed that G.M. expenses are personal expenses) Mr. K Shah Income Statement (Variable Costing) Rs. Sales (19,000*67/-) 1,273,000 Cost of sales: Raw material used 500,000 Factory wages (direct) 340,000 Variable factory overheads 10, ,000 Less: Closing stock [(1,060,000/ 20,000)*1,000] 42, ,500 Gross margin 465,500 Other variable expenses: Sales men commission 95,000
105 Overtime 19, ,000 Contribution 351,500 Fixed expenses: Water expense 10,000 Advertisement 30,000 Salaries 120,000 Factory depreciation 80,000 Lease 120, ,000 Net decrease in profit (8,500) (ii). Difference in profit: Profit as per absorption costing 2,000 Loss as per marginal costing (8,500) Decrease in profit 10,500 Accounted for: Closing stock as per Absorption costing 53,000 Closing stock as per Direct costing 42,500 Net decrease in profit (10,500) (iii). Marginal costing is recommended because of its, usefulness of planning and control purposes. It provides better information for decision making
106 Question No. 2: Meezan Company Ltd. are the manufacturers of grass cutting machines, which they have been selling for Rs. 800 per unit for a number of years. The selling price is now under review, and the following information is available on costs and likely demand: The standard variable cost of manufacture is Rs. 500 per unit and a cost variance analysis for the last 20 months shows the following trend and that the same is likely to continue in the future: Monthly data: 10 months 10% adverse variance of standard variable cost occurred during the period. 6 months No variance of standard variable cost. 4 months 5% favourable variance occurred in standard variable cost. Fixed cost have been Rs. 250 per unit on an average sales level of 20,000 units, but these costs are expected to rise in the future and the following estimates have been made for the total fixed cost: Rs. Optimistic estimate (Probability 0.3) 4,100,000 Most likely estimate (Probability 0.5) 4,250,000 Pessimistic estimate (Probability 0.2) 4,500,000 The demand at the two new prices under consideration is as follows: Estimated demand at selling prices/unit Selling price/unit Rs. 850 Rs. 900 Optimistic (Probability 0.2) 21,000 Units 19,000 Units Most likely (Probability 0.5) 19,000 Units 17,500 Units Pessimistic (Probability 0.3) 16,500 Units 15,500 Units It is assumed that all estimates and probabilities are independent. Required: (a) (b) (c) (d) Advise the management, whether they should change the selling 6 price, and if so, the price you would recommend based on the information given above. Calculate the expected profit at your recommended price and 5 resulting margin of safety, expressed as a percentage of expected sales. Critically comment on the method of analysis you have used to 3 deal with the probabilities given in the question. Describe briefly, how computer assistance might improve the 3 analysis.
107 Answer No.2: a. Meezan Co. Ltd. Note: For each selling price there are three possible outcomes for sales demand, unit variable costs and fixed costs. As a result there are 27 possible outcomes, and in order to present probability distribution for two possible selling prices, it would be necessary to compute profit for 54 outcomes therefore the expected value approach has to be used. Variable Cost Rs. Fixed Cost Rs. (Rs %) x 10/20 = 275 Rs. 4,100,000 x 0.3 = 1,230,000 Rs. 500 x 6/20 = 150 Rs. 4,250,000 x 0.5 = 2,125,000 (Rs %) x 4/20 = 95 Rs. 4,500,000 x 0.2 = 900, ,255,000 Selling Price Rs. 850 Units Selling Price Rs. 900 Units 21,000 units x 0.2 = 4,200 19,000 units x 0.2 = 3,800 19,000 units x 0.5 = 9,500 17,500 units x 0.5 = 8,750 16,500 units x 0.3 = 4,950 15,500 units x 0.3 = 4,650 18,650 17,200 Expected contribution: Rs. 850 selling price = (Rs. 850 Rs. 520) x 18,650 = Rs. 6,154, (i) Rs. 900 selling price = (Rs ) x 17,200 = Rs. 6,536, (ii) The existing selling price = Rs. 800/unit If demand continues at 20,000 units Then total contribution = (Rs. 800 Rs. 520) x 20,000 units = Rs. 5,600, (iii) Therefore using the expected value approach, a selling price of Rs. 900 per unit is recommended. b. Expected profit = Rs. 6,536,000 Rs. 4,255,000 (Fixed cost) = Rs. 2,281,000 Break-even point: = Fixed Cost/Contribution for unit Rs. 4,255, = 11,197 units Margin of safety = Expected demand BE sales value = 17,200 11,197 = 6,003 units % Margin of safety = 6,003/17,200 = 34.9% It should be noted that the most pessimistic estimate is above the break-even point. a.
108 b. An expected value approach has been used. Basing the decision safety on expected value means that the risk has been ignored. The range of possible outcomes has not been considered. The decision should be based on a comparison of the probability distribution for proposed selling prices. Computer assistance would enable a more complex analysis to be under take. Particularly, different. Scenario could be considered based on different contribution of assumptions regarding variable cost fixed, cost, selling price and demand. Using computer would also enable Mono Carlo Simulation to be used for more complex decisions.
109 Question:3 Mars Transportation company has appointed a management accountant. First assignment given to her is to analyze company s cost-volume-profit relationship. The company s summarized income statement for the last year is as under: Total Per Trip % to sales Revenue 2,000 Trip 15,000,000 7, Less: Variable cost 9,000,000 4, Contribution margin 6,000,000 3, Less: Fixed cost 3,000, Net operating income 3,000, According to the agreement with local government at least one trip a day is mandatory. (one year = 360 days) Required: a. Existing break-even in trips and amount. b. Number of trips needs to be completed to achieve a profit target or Rs. 5,000,000. c. For next year, the company is planning to purchase a computerized booking system having cost of Rs. 1,000,000. Company will save 3% of variable cost and Rs. 400,000 of fixed cost after installation of new system. Calculate break-even in percentage and amount after installing the new system.
110 Answer:3 (a) Existing break-even in trips and amount: Fixed Cost Rupees Fixed Cost 3,000,000 Mandatory trips (360 x 4,500) 1,620,000 Total Fixed Cost 4,620,000 Break-even (Rs.) = Break-even (Trips) = Fixed Cost = 4,620,000 CM% 40% Fixed Cost 4,620,000 = CM per trip 3,000 = 11,550,000 = 1,540 (b) Trips need to be completed to achieve profit target: Profit = CM per unit x Nos. of trips fixed cost OR 5,000,000 = 3,000 x Nos. of trips 4,620,000 OR 5,000, ,620,000 = 3,000 x Nos. of trips 9,620, ,000 = Nos. of trips Nos. if trips = 3,207 Rupees Revenue 24,050,000 Less: Variable Cost 14,430,000 Contribution Margin 9,620,000 Less: Fixed Cost 4,620,000 Net operating income 5,000,000
111 (c) Breakeven in Percentage and Amount After New System: Variable Cost per trip Rupees 4,500 Less: 3% saving 135 Variable Cost per trip 4,365 Fixed Cost 4,620,000 Less: Saving 400,000 4,220,000 CM Per trip = 7,500 4,365 = 3,135 Break-even % = 41.80% Break-even (Rs.) = Break-even (Trips) = Fixed Cost = 4,220,000 = 10,095,694 CM% 41.80% Fixed Cost CM trip per = 4,220,000 3,135 = 1,346
112 Question: 4 As the first management accountant employed by a manufacturer of power tools have been asked to a supply financial results by product line to help in marketing decision making. Rs. (000) Rs. (000) Sales 1,200 Cost of good sold: 500 Materials 300 Production Expenses 150 Marketing costs 100 1,050 Net Profit 150 A statistical analysis of the figures show the following variable element in the costs: %age Materials 90 Wages 80 Production Expenses 60 Marketing Costs 70 Below is given, as percentages, the apportionment of the sales and the variable elements of the costs among the five products manufactured. PRODUCT A B C D E Total Sales Materials Wages Production Expenses Marketing Costs From the information given you are required to: (a) i. Prepare a statement for the year showing contribution by products: ii. Comment on these contributions: (b) i. The breakeven sales value. ii The order of sales preference for additional orders to maximize contribution as a percentage of sales: iii. A revised mix of the Rs. 1,200,000 sales to maximize contribution assuming that existing sales by products can only be varied 10% either up or down; iv. A product mix to maximize contribution if manpower availability were reduced by 10% but the product mix could be varied by up to 20% and v. The percentage commission which could be offered to an over seas agent on an order of Rs. 30,000 worth each of products A,C and E obtain a 20% contribution on the total sales value.
113 Answer: 4 (i) ANALYSIS OF OVERALL PERFORMANCE Rs. (000) Rs. (000) Sales 1,200 Variable cost of goods sold Materials 450 Wages 240 Production Expenses 90 Marketing costs Contribution 350 Fixed Costs 200 Net Profit 150 PRODUCT LINE ANALYSIS A B C D E Total Sales ,200 Materials Wages Production Expenses Marketing Costs CONTRIBUTION 110 (8) % (19.52%) 41.07% 45.83% 29.16% (a) (ii) Three of the product line make a contribution to fixed costs and to profit. The other two do not although individual products within product lines may do so. Product lines B and C should not therefore be line. It is also possible that B and C are recently introduced product lines. For those product lines making contribution, contribution/sales percentages are: A 30.56% D 41.07% E 45.83%
114 (b) (i) Assuming a constant mix of sales, average contribution sales is 350 / 1,200 =29.16% Breakeven sales Is therefore: 200 / 29.16% = Rs (ii) Preference order is E,D,A,B,C (iii) Assumption: As in 9iv), variation is up to = 10% Min Sales Distribution of Total Balance Rs. Rs. Rs. A B C D (Max) E (Max) 1, , (iv) CONTRIBUTION / WAGES A D E % 230% 183% Ranking Min Wages Distribution Total Sales Used Of balance Wages Sales Rs. Rs. Rs. Rs. Rs. A (max) B C D E , =90% of (v)
115 A C E Rs. Sales C/Sales 30.56% (9.52%) 45.83% 9.17 (2.86) % contribution Available for commission 2.06 %age commission 2.06 / 90 =2.29%
116 Question:5 RJ produces and sells two high performance motor cars: Car X and Car Y. The company operates a standard absorption costing system. The company s budgeted operating statement for the year ending 30 June 2008 and supporting information is given below: Operating statement year ending 30 June 2008 Car X Car Y Total $000 $000 $000 Sales 52, , ,500 Production 40,000 82, ,250 cost of sales Gross profit 12,500 22,750 35,250 Administration costs Variable 6,300 12,600 18,900 Fixed 7,000 9,000 16,000 Profit/(loss) (800) 1, The production cost of sales for each car was calculated using the following values: Car X Car Y Units $000 Units $000 Opening 200 8, ,750 inventory Production 1,100 44,000 1,600 75,200 Closing inventory , ,700 Cost of 1,000 40,000 1,750 82,250 sales Production costs The production costs are made up of direct materials, direct labour, and fixed production overhead. The fixed production overhead is general production overhead (it is not product specific). The total budgeted fixed production overhead is $35,000,000 and is absorbed using a machine hour rate. It takes 200 machine hours to produce one Car X and 300 machine hours to produce one Car Y. Administration costs The fixed administration costs include the costs of specific marketing campaigns: $2,000,000 for Car X and $4,000,000 for Car Y. Required: (a) Produce the budgeted operating statement in a marginal costing format. (b) Reconcile the total budgeted absorption costing profit with the total budgeted marginal costing profit as shown in the statement you produced in part (a). The company is considering changing to an activity based costing system. The company has analysed the budgeted fixed production overheads and found that the costs for various activities are as follows: $000 Machining 7,000 costs Set up costs 12,000 Quality 7,020
117 inspections Stores receiving Stores issues 3,480 5,500 35,000 The analysis also revealed the following information: Car X Car Y Budgeted production 1,100 1,600 (number of cars) Cars per production run Inspections per production run Number of component deliveries during the year Number of component 4,000 7,000 deliveries during the year Required: (a) Calculate the budgeted production cost of one Car X and one Car Y using the activity based costing information provided above. (b) Prepare a report to the Production Director of RJ which explains the potential benefits of using activity based budgeting for performance evaluation. Answer :5 (a) Total production cost: Car X = $40,000 (standard unit cost from the table showing information for the cost of sales) Car Y = $47,000 Fixed production overhead = $35,000,000 Budgeted machine hours = (1,100 x 200) + (1,600 x 300) = 700,000 machine hours Fixed production overhead a bsorption rate = $35,000,000/700,000 = $50 per machine hour. Car X Car Y
118 $ per $ per car car Total production cost 40,000 47,000 Fixed overhead absorbed 10,000 15,000 Variable production cost per car 30,000 32,000 Marginal costing operating statement year ending 30 June 2008 Car X Car Y Total $000 $000 $000 Sales 52, , ,500 Variable 30,000 56,000 86,000 production costs Variable 6,300 12,600 18,900 administration costs Contribution 16,200 36,400 52,600 Specific fixed costs Marketing 2,000 4,000 6,000 Contribution 14,200 32,400 46,600 to general fixed costs General fixed costs Production 35,000 Administration 10,000 Profit 1,600 (b) The difference in the profit figures will be caused by the fixed production overheads that are absorbed into closing inventories. Changes in inventory levels will determine the amount of fixed production overheads that are moved into the next accounting period and not charged in this period. If inventory levels increase, the absorption costing profit will be higher than the profit calculated using marginal costing. Car X Car Y Opening inventory (units) Closing inventory (units) Change in inventory (units) Marginal profit will be lower lower higher
119 higher Fixed production overhead per car Total difference in profits $1,000,000 Reconciliation Absorption costing profit Car X: inventory impact Car Y: inventory impact Marginal costing profit $10,000 $15000 $1,000,000 $2,250,000 $ (1,000) 2,250 1,600 (c) Activity Cost Driver Calculation Drivers of driver Machining costs Machine hours 700, ,000 Set up No. of (1,100/10) costs production runs (1,600/40) Quality No. of (110 x 20) + 5,400 inspections inspections (40 x 80) Stores No. of ,392 receiving deliveries Stores No. of 4, ,000 issues issues 7,000 Activity $000 Driver Cost per driver Machining 7, ,000 $10 per costs machine hour Set up costs 12, $80,000 per set up Quality 7,020 5,400 $1,300 per inspections inspection Stores 3,480 1,392 $2,500 per receiving delivery Stores issues 5,500 11,000 $500 per issue Machine costs Set up costs Car X Car Y Driver $000 Driver $ ,000 2, ,000 4, ,200 8, ,200
120 Quality inspections Stores receiving Stores issues Total overhead Direct costs Total production costs Cars produced Cost per car ,200 4,160 4,000 1, ,250 2,000 7,000 3,500 17,090 17,910 33,000 51,200 50,090 69,110 1,100 1,600 $45,536 $43,194 (d) Report To: Production Director From: Management Accountant Date: 22 May 2007 Subject: Activity Based Budgeting Performance Evaluation As you are aware we are considering the implementation of an activity based costing system and moving away from the traditional absorption costing system which we currently operate. There are many potential benefits associated with implementing activity based budgeting (ABB) for performance evaluation. Please find below an outline of some of the benefits that can be achieved from ABB. Preparing budgets using a traditional absorption costing approach involves presenting costs under functional headings, that is, costs are presented in a manner that emphasises their nature. The weakness of this approach is that it gives little indication of the link between the level of activity of the department and the cost incurred. In contrast, activity based budgeting provides a clear framework for understanding the link between costs and the level of activity. This would allow us to evaluate performance based on the activity that drives the cost. The modern business environment has a high proportion of costs that are indirect and the only meaningful way of attributing these costs to individual products is to find the root cause of such costs, that is, what activity is driving these costs. The traditional absorption costing approach does not provide this level of detail as costs under this system are attributed to individual products using a volume related measure. For our company this is machine hours which results in an arbitrary product cost. This makes it difficult to hold individual managers accountable for variances that arise. Whereas with an activity based costing approach responsibility can be broken down and assigned accordingly and individual managers can provide input into the budgeting process and subsequently be held responsible for the variances arising. There is greater transparency with an ABB system due to the level of detail behind the costs. The traditional absorption costing approach combines all of the overheads together using a machine hour basis to calculate an overhead absorption rate and uses this rate to attribute overheads to products. ABB will drill down in much more detail examining the cost and the driver of such costs and calculates a cost driver rate which will be used to assign overheads to products. Therefore ABB has greater transparency than absorption costing and allows for much more detailed information on overhead consumption and so on. This then lends itself to better performance evaluation.
121 I would like to conclude that the traditional absorption costing approach to product costing does not enable us to provide a satisfactory explanation for the behaviour of costs. In contrast ABB will provide such details which will allow us to have better cost control, improved performance evaluation and greater manager accountability. If you require any further information please do not hesitate to contact me.
122 Linear Programming GRAPHICAL METHOD Machines Hours Hours required Hours required Maximum Units Maximum Units X Y X Y A B Objective to maximize Contribution RS 3X+RS 4Y Constraints 2X+5Y 120 4X+2Y 80 Where X>0 Y 24 A Where Y>0 X 60A Y 40B X 20B
123 ALGEBRAIC METHOD Equation No : 1 2x+5Y= 120 Equation No : 2 4X+2Y=80 Multiply Eq 1 with 2. Equation No : 3 4X+10Y=240 Then Deduct Eq. 2 From Eq 3 8Y= 160 Y= 20 FIND VALUE OF X 2X+5(20)=120 2X=20 X= 10
124 SHADOW PRICE Assume 20 Hours of Machine A can be Acquired so What price can we afford to pay? Equation No : 1 2x+5Y= 140 MAX CONTRIBUTION RS. CONTRIBUTION X 7.5x 3= 22.5 CONTRIBUTION Y 25 x 4= 100 Equation No : 2 4X+2Y=80 TOTAL EXCESS CONTRIBUTION RS. Multiply Eq 1 with Eq = 12.5 Equation No : 3 4X+2Y=280 EXTRA HOURS 20 Hours Then Deduct Eq. 2 From Eq 3 8Y= 200 Y= 25 FIND VALUE OF X 2X+5(25)=140 2X=15 X= 7.5 CONCLUSIONS IF WE WANT TO ACQUIRE EXTRA 20 HOURS OF MACHINE A, THE MAXIMUM PRICE PER HOUR WE CAN AFFORD TO PAY RS PER HOUR. Rate per Hour RS.625
125
126
127 CHAPTER 6 THE BUDGETING PROCESS
128 In the previous six chapters we have considered how management accounting can assist managers in making decisions. The action that follow managerial decisions normally involve several aspects of the business, such as the marketing, production, purchasing and finance functions and it is important that management should coordinate these various inter-related aspects of decisions-making. If they fail to do this, there is danger that managers may each make decisions that they believe in the best interest of the organization when, in fact, taken together they are not; for example the marketing department may introduce a promotional campaign that is designed to increase sales demand to a level beyond that which the production department can handle. The various activities within a company should be coordinated by the preparation of plans of action for future periods. These detailed plans are usually referred as budgets. Our objective in this chapter is to focus on the planning process within a business organization and to consider the role of budgeting within this process. What do we mean by planning? Planning is the design of the desired future and effective ways of bringing it about. A distinction is normally made between short-term planning (budgeting) and long-range planning, alternatively known as strategic or corporate planning. How long-range planning is distinguished from other forms of planning? Sizer (1989) defines long-range planning as a systematic and formalized process for purposely directing and controlling future operations towards desired objectives for periods extending beyond one year. Short-term planning or budgeting, on the other hand, must accept the environment of today, and the physical, human and financial resources at present available to the firm. These are to the considerable extent determined by the quality of firm s long-range planning efforts. 6.1 STAGES IN THE PLANNING PROCESS To help you understand the budgetary process we shall begin by looking at how it fits into an overall general framework of planning, decision-making and control. The framework outlined in Figure 6.1 will be used to illustrate the role of long-term and short-term planning within the overall planning and control process. The first stage involves establishing the objectives of the organization. Stage 1: Establishing objectives Establishing objectives is an essential pre-requisite of the planning process. In all organizations employees must have a good understanding of what the organization is trying to achieve. Strategic or long-range planning therefore begins with the specification of the objectives towards which the future operations should be directed. The attainment of objectives should be measurable in some way and ideally people should be motivated by them. Johnson and Scholes (2005) distinguished between three different objectives, which form a hierarchy; the mission of an organization, corporate objectives and unit objectives. The mission of an organization describes in a very general terms the broad purpose and reasons for an organization s existence, the nature of the business(es) it is in and the customers its seeks to serve and satisfy. It is a visionary projection of the central and overriding concepts on which the organization is based. Objectives tend to be more specific and represent desired states or results to be achieved.
129 Stage 2: Identify potential strategies The next stage shown in figure 6.1 is to identify a range of possible courses of action (or strategies) that might enable the company s objective to be achieved. 1. Establish Objectives 2. Identify potential courses of action Long term Planning Process 3. Evaluate alternative strategic options 4. Select alternative courses of action 5. Implement long term plan in budget form Annual budgeting process 6. Monitor actual results 7. Respond to divergences from plan Figure 6.1 The role of long and short term planning within the planning, decision making and control process The corporate strategy literature advocates that, prior to developing strategies, it is necessary to undertake a strategic analysis to become better informed about the organization s present strategic situation. This involves understanding the company s present position, its strengths and weaknesses and its opportunities and risks. Having undertaken a strategic analysis, the next stage is to identify alternative strategies. The identification of strategies should take into account the following: 1. The generic strategy to be pursued (i.e. the basis on which the organization will compete or sustain excellence. 2. The alternative directions in which the organization may wish to develop. Porter has identified three generic strategies that an organization can follow: 1. Cost leadership, whereby the organization aims to be the lowest cost producer within the industry;
130 2. Differentiation, through which the organization seeks some unique dimension in its product/service that is valued by consumers, and which can command a premium price. 3. Focus, whereby the organization determines the way in which the strategy is focused at particular parts of the market Porter s view is that any organization seeking a sustainable competitive advantage must select an appropriate generic strategy rather than attempting to be all things to all people. Stage 3: Evaluation of strategic options The alternative strategies should be examined based on the following criteria: 1. Suitability, which seeks to ascertain the extent to which the proposed strategies fit the situation identified in the strategic analysis. 2. Feasibility, which focuses on whether the strategy can be implemented in resource terms. For example, can the strategy be funded? Can the necessary market position be achieved? Can the company cope with the competitive reactions? 3. Acceptability, which is concerned with whether a particular strategy is acceptable. For example, will it be sufficiently profitable? Is the level of risk acceptable? Stage 4: Select course of action When management has selected those strategic options that have the greatest potential for achieving the company s objectives, long-term plan should be created to implement the strategies. A long-term plan is a statement of the preliminary targets and activities required by an organization to achieve its strategic plans together with a broad estimate for each year of the resources required. Because long-term planning involves looking into the future for several years ahead the plans tend to be uncertain, general in nature, imprecise and subject to change. Stage 5: Implementation of the long-term plans Budgeting is concerned with the implementation of the long-term plan for the year ahead. Because of the shorter planning horizon budgets are more precise and detailed. Budgets are clear indications of what is expected to be achieved during the budget period whereas long-term plans represent the broad directions that top management intend to follow. The budget is not something that originates from nothing each year it is developed within the context of ongoing business and is ruled by previous decisions that have been taken within the long-term planning process. The budgeting process cannot therefore be viewed as being purely concerned with the current year it must be considered as an integrated part of the long-term planning process.
131 Stages 6 and 7: Monitor actual outcomes and respond to divergencies from planned outcomes The final stages in the decision-making, planning and control process outlined in figure 6.1 are to compare the actual and the planned outcomes, and to respond to any divergences from the plan. These stages represent the control process of budgeting.
132 6.2 THE MULTIPLE FUNCTIONS OF BUDGETS Budgets serve a number of useful purposes. They include; 1. Planning annual operations; 2. Coordinating the activities of the various parts of the organization and ensuring that the parts are in harmony with each other; 3. Communicating plans to the various responsibility centre managers; 4. Motivating managers to strive to achieve the organizational goals; 5. Controlling activities; 6. Evaluating the performance of managers Let us now examine each of these six factors. Planning The major planning decisions will already have been made as part of the long-term planning process. However, the annual budgeting process leads to the refinement of those plans, since managers must produce detailed plans for the implementation of the long-range plan. Without the annual budgeting process, the pressures of day-to-day operating problems may tempt managers not to plan for future operations. The budgeting process ensures that managers do plan for future operations, and that they consider how conditions in the next year might change and what steps they should take now to respond to these changed conditions. This process encourages managers to anticipate problems before they arise, and hasty decisions that are made on the spur of the moment, based on expediency rather than reasoned judgment, will be minimized.
133
134 Question:1 Salman is considering to set up a business offering mobile service of shoe repairing in the commercial area using the car parks of the shopping centres and offers an as-you- wait shoe repair service from his van. He has visited the major employers in the area and having reached agreements with a number of large local businesses and having carried out surveys of his potential customers, he has arrived at the following estimates for his first 3 months of business: He will start the business by investing Rs. 120,000 of his own money in March 2013 and, in that month; he will purchase a second-hand van at a cost of Rs. 90,000 and various machinery for Rs. 30,000. Also in March, he will buy inventories of materials at a cost of Rs. 38,500. The van would then be painted to advertise his business, at a cost of Rs. 7,000, payable in April He will commence business in April 2013 and expects sales to be as follows: Rupees April ,000 May ,000 June ,000 Materials needed for the repairs would cost 30% of the sales price of each repair, giving a margin of 70% and materials would be regularly replaced to maintain inventories at a constant level. Fuel expense will be Rs.800 per month from April 2013 onwards and motor insurance for the year to 31 March 2014 will be Rs. 7,500, payable in April All sales will be for cash and all purchases, including the purchase of opening inventories, will be on one month's credit. Salman will draw Rs. 5,000 per month for his personal expenditures from April Running bank financing will be available if required, at 10%. Cash requirement at the end of month will be Rs.5,000 and extra cash will be used to payoff financing. Assume financing will be taken at the start of month and interest will be paid in July Required: i. What is the purpose of purpose of preparing a cash budget? Give four reasons. ii. Prepare a cash budget for Salman for four months ended June 30, iii. Furnish details of outstanding payments, if any.
135 Answer: 1 (b) (i) Reasons for purpose of preparing a cash budget: There are several reasons for preparing a cash budget including the following: 1. To predict the cash balance over the period of the budget. 2. To arrange an appropriate overdraft facility with the bank. 3. To plan uses for any anticipated cash surpluses. 4. To plan the timing of expenditure. (b) (ii) & (iii) Cash Budget for March to June 2013 Rupees Receipt March 13 April 13 May 13 June 13 Total Capital 120, ,000 Cash Sales 13,000 15,000 18,000 46,000 Total 120,000 13,000 15,000 18, ,000 Payments Van 90,000 90,000 Machinery 30,000 30,000 Van-Painting 7,000 7,000 Purchase-Opening Inventory 38,500 38,500 Purchase-Replacement Inventory 3,900 4,500 8,400 Petrol ,400 Motor Insurance 7,500 7,500 Drawings 5,000 5,000 5,000 15, ,000 58,800 9,700 10, ,800 Months surplus/ deficit (45,800) 5,300 7,700 Opening balance 5,000 5,000 5,000 Net surplus/ (deficit) - (40,800) 10,300 12,700 Closing balance required 5,000 5,000 5,000 5,000 Financing/ (repayment) during month 5,000 45,800 (5,300) (7,700) Cumulative Financing 5,000 45,800 40,500 32,800 Interest
136 Question: 2 ABC Ltd., produces helmets for bike riders. The most recent statement of financial position of the company is as under: ABC Ltd. Statement of Financial Position as at June 30,2012 Assets Rs. 000 Liabilities and Owners Equity Rs. 000 Current assets Current liabilities: Bank 16,600 Trade payable 24,000 Receivable 40,000 Tax payable 9,000 Inventory 78,000 Dividends payables 15, ,600 48,600 Non-current assets: Owners equity: Buildings 48,800 Ordinary shares (Rs. 10 per 40,000 share) Less: Accumulated dep. 8,800 40,000 Retained earnings 136,000 Plant and machinery 75,800 Less: accumulated dep. 25,800 50,000 90, ,000 Total 224, ,600 During the year ended June 30, 2012, the sales revenue save Rs. 480 million. In order to exploit the market conditions due to recent changes in government legislation, forecast and assumptions for the next year have been prepared by the directors. However, forecast income statement and statement of financial position are yet to be prepared as per their following forecast and assumptions: Sales for the forthcoming year will be 25% higher than the previous year. Sales are expected to be spread evenly over the year. The gross profit margin is expected to be 30% of sales. To enhance production, new machinery costing Rs. 114 million will be required at the beginning of the year. A long-term loan will be arranged immediately to finance the purchase of new machinery. At the end of the year, the long-term debt to equity ratio is planned to be 1:2. The average collection period of receivables will be three times that of previous years and the average payment period for creditors will be one and half (1 ½ ) months. The value of inventory at the end of the year will be Rs. 36 million lower than beginning inventory. Depreciation charge for buildings and plant and machinery are calculated using the reducing balance method and will be 5% and 20% respectively. Other expenses including interest on loan for the period will be Rs million. There will be no prepayments or accruals at eh end of the year. Dividends will be declared at the end of the year and the dividend payout ratios will be 50% in line with pervious years. The tax rate will be 35% of net profits before taxation. The dividend and tax will be paid after the year end. Required: Forecast income statement for the year ended June 30, 2013 and a statement of financial position as at June 30, 2013 (show all of your working in legible writing).
137 Answer:2 ABC Ltd. Forecast Income Statement for the year ended 30 June,2013 Rs. 000 Revenue (Rs. 480 m x 125) 600,000 Cost of sales (70%) 420,000 Gross profit (30%) 180,000 Expenses Depreciation of buildings (5% of Rs. 40 m) 109,200 Depreciation of plant and machinery (20% of Rs. (50 m m) 2,000 Profit before taxation 32, ,000 Taxation 36,000 Dividend (50%) 12,600 Retained 23,400 11,700 11,700 Forecast Statement of Financial Position as at 30 June,2013 Assets Rs. 000 Liabilities and Owners Equity Rs. 000 Current assets: Current liabilities: Receivable (w-1) 150,000 Bank overdraft (w-4) 7,350 Trade payable (w-2) 48,000 Inventory (78-36) 42, ,000 Tax payable 12,600 Non-current assets: Dividends payable 11,700 Freehold buildings 46,800 79,650 Less accumulated dep. 10,800 Long term loan (w-3) 93,850 38,000 Plant and machinery 189,800 Owner equity: Less accumulated dep. 58, ,200 Ordinary Rs. 1 per share 40,000 Retained earnings ( ) 147, , ,700
138 Total 361,200 Total 361,200 Workings: W-1: Trade Receivables: Average debt collection period in current year ( ) x 12 month 1 month Average debt collection period in next year 3 times one month 3 month Trade receivables as at 30 June 2013 (3 + 12) x Rs. 600 m Rs. 150 million W-2: Trade Payables: Purchase in the year Closing inventory + cost of sales opening inventory Purchase in the year Rs. 42m (reduction in inventory levels) + Rs. 420m Rs. 78m 384 Trade payables at June 30, 2013 ( ) x Rs. 384 million 48
139 Question No. 3 A garment manufacturing company is facing cash flow problem and is planning to avail a running finance facility on need basis. Following are the monthly sales forecasts and estimation of material and labour costs: Rs. 000 Month Sales Forecasts Material and Labour Costs November December January February ,080 1,764 March , April May June July Collection estimates of marketing department are as follows: within the month of sale - 10% in the month following the sale - 75% in the second month following the sale - 15% Payments of material and labour are made during the following month in which these costs have been incurred. Administrative salaries will amount to approximately Rs.60,000 per month. Monthly lease payments under short-term lease contract will be Rs.20,000. A progressive payment of Rs.400,000 must be paid in April 2011 for new equipment. Other monthly and periodical estimations: Miscellaneous expenses Rs.6,000. Depreciation charges of Rs.40,000 upto March 2011 and Rs.44,000 from April, Advance Income Tax of Rs.50,000 due in the month of March and June, Cash and bank balances on January 01, 2011 will be Rs.140,000 and same will be required to maintain throughout the period. Required: (a) (b) Prepare a monthly cash budget for first 6 months of 2011, in a columnar format. Offer your comments and suggestions on borrowing and/ or short term deposits for the company.
140 Answer No. 3 Cash Budgeted 2011 Rs. 000 Collections Sales Jan. Feb. March April May June Nov Dec Jan Feb March April May June Total collections Jan. Feb. March April May June Disbursements 180 Material and labour Administrative Salary New equipment Misc. Expense Lease Advanced income tax Total payments Surplus (Deficit) for the month (838) Opening balance ) (204) Closing balance (204)
141 Question No. 4 a. Explain, giving examples, how budgets can be used for feedback control and feed forward control. b. Briefly explain three reasons why budgetary planning and control might be inappropriate in a rapidly changing business environment. c. Briefly explain Just-in-Time (JIT) and two major requirements for the successful operation of a JIT system.
142 Answer:4 (a) Feedback control relates to information about past events. Actual results should be compared to planned or budgeted results as part of the control mechanism. Variance analysis is a good example of feedback control. The feedback should be used to revise future actions as appropriate and to learn from budgeting or operational errors. Feed forward control is a system where deviations from a plan are anticipated and corrective action is taken in advance. An example is a cash flow projection which for example can highlight in advance any shortages of cash and therefore action can be taken before the event to avoid any problems this may bring. Answer (b) Budgets are often thought of as being bureaucratic and time consuming to produce. Consequently they are not updated on a regular basis and therefore in a dynamic environment budgets can quickly become out of date. Budgets are often seen as constraints on responsiveness and as such stifle the ability of managers to react rapidly to change. Budgets replicate vertical command and control structures and reinforce departmental barriers. Such rigid structures may not suit the organization culture of companies operating in a rapidly changing environment. Budgets have been criticized for being too inward looking and as such they pay little attention to the external environment. This is even more inappropriate if the environment is changing rapidly. Answer to (c) JIT is a commitment to continuous improvement and the pursuit of excellence in the design and operation of the production management system. Under this system, production and resource acquisition is pulled through the system by customer demand and therefore the JIT production system must be able to respond quickly to customer demand and resources are only acquired when needed. In order to be able to operate in this manner, an organization must achieve excellence in all areas of management. Operating on a JIT basis with low inventories requires excellence in: Production scheduling Supplier relations Plant maintenance Information systems Quality controls Customer relations. Candidates were required to explain two requirements. For example: Production scheduling Under JIT it is thought that only the actual production time adds value to the product and that all other activities (inspection, move and storage times) do not add value but they do add cost. JIT aims to reduce and eliminate non-value adding activities.
143 Supplier relations Under a JIT system a company would move towards having fewer suppliers and would build long term relationships with them. The ability to work with the minimum level of inventory will be dependent on having a guaranteed supply of quality resources. Consequently the selection of suppliers will tend not to be based on price alone.
144 Question:5 RF Ltd is a new company which plans to manufacture a specialist electrical component. The company founders will invest 16,250 on the first day of operations, that is, Month 1. They will also transfer fixed capital assets to the company. The following information is available: Sales The forecast sales for the first four months are as follows: Month Number of components 1 1, , , ,100 The selling price has been set at 10 per component in the first four months. Sales receipts Time of payment % of customers Month of sale 20* One month later 45 Two months later 25 Three months later 5 The balance represents anticipated bad debts. *A 2% discount is given to customers for payment received in the month of sale. Production There will be no opening inventory of finished goods in Month 1 but after that it will be policy for the closing inventory to be equal to 20% of the following month s forecast sales. Variable production cost The variable production cost is expected to be 6 40 per component. Direct materials 1 90 Direct wages 3 30 Variable production 1 20 overheads Total variable cost 6 40 Notes: Direct materials: 100% of the materials required for production will be purchased in the month of production. No inventory of materials will be held. Direct materials will be paid for in the month following purchase. Direct wages will be paid in the month in which production occurs.
145 Variable production overheads: 60% will be paid in the month in which production occurs and the remainder will be paid one month later. Fixed overhead costs Fixed overhead costs are estimated at 75,000 per annum and are expected to be incurred in equal amounts each month. 60% of the fixed overhead costs will be paid in the month in which they are incurred and 30% in the following month. The balance represents depreciation of fixed assets. Calculations are to be made to the nearest 1. Ignore VAT and Tax. Required: (a) (b) Prepare a cash budget for each of the first three months and in total. There is some uncertainty about the direct material cost. It is thought that the direct material cost per component could range between 1 50 and Calculate the budgeted total net cash flow for the three month period if the cost of the direct material is: (i) (ii) 1.50 per component; or 2.20 per component. Answer: 5 (a) Cash Budget Month 1 Month 2 Month 3 Sales receipts 2,940 10,180 15,545 Capital injection 16,250 Total receipts 19,190 10,180 15,545 Outflow Materials 0 3,515 3,420 Labour 6,105 5,940 6,666 Variable overhead 1,332 2,184 2,318 Fixed overhead 3,750 5,625 5,625 Total outflow 11,187 17,264 18,029 Inflow-Outflow 8,003 (7,084) (2,484) Bal b/fwd 0 8, Bal c/fwd 8, (1,565) Working Sales receipts Sales units 1,500 1,750 2,000 Selling price
146 Sales 15,000 17,500 20,000 Paid in month 20% 3,000 3,500 4,000 Discount paid in month 2% 45% in the following 6,750 7,875 month 25% in 3 rd month 3,750 Receipts 2,940 10,180 15,545 Production units units units units Required by sales 1,500 1,750 2,000 2,100 Opening inventory (350) (400) 1,500 1,400 1,600 Closing inventory Production 1,850 1,800 2,020 Material price Material cost 3,515 3,420 3,838 Payment 3,515 3,420 Labour Production units 1,850 1,800 2,020 Rate per unit Payment 6,105 5,940 6,666 Variable Overhead Production units 1,850 1,800 2,020 Rate per units Variable overhead cost 2,220 2,160 2,424 Payment 60% in month 1,332 1,296 1,454 40% in following month Payment 1,332 2,184 2,318 Fixed overhead 6,250 6,250 6,250 Payment 60% in month 3,750 3,750 3,750 30% in following 1,875 1,875 month Payment 3,750 5,625 5,625
147 (b)(i) Month 1 Month 2 Month Production units 1,850 1,800 2,020 Saving Saving Total cash benefit 1,460 Current cash flow at 1.90 (1,565) Revised cash flow at 1.50 (105) (ii) Month 1 Month 2 Month Production units 1,850 1,800 2,020 Additional cost Payment Total additional payment 1,095 Current cash flow at 1.90 (1,565) Revised cash flow at 2.20 (2,660)
148 Question:6 Assuming that the budgeted production of Product W was 7,700 units and that the following actual results were incurred for labour and overheads in the year: Actual production 7,250 units Actual overheads Variable 185,000 Fixed 105,000 Actual labour costs Skilled per hour 568,750 Semi skilled 8 per hour 332,400 Prepare a flexiable budget statement for X Plc showing the total variance that have accurred for the above four costs only. a. X Plc currently uses uncremental budgeting. Explain how Zero Based Budgeting could overcome the problems that might be faced as a result of the continued use of the current system. b. Explain how rolling budgets are used and why they would be suitable for X Plc. Answer:6 (a): Operating Statement Fixed Budget Flexed Budget Actual Flaxible Budget Variance Activity 7,700 7,250 7,250 Overheads Variable 168, , ,000 26,818 adverse Fixed 112, , ,000 7,000 favouable Labour Skilled 462, , , ,750 adverse Semi skilled 415, , ,400 59,100 favouable 1,157,800 1,096,682 1,191,150 94,468 adverse Answer (b) Incremental budgeting builds in any inefficiency contained in the previous year s budget as it simply takes the previous year s budget or actual results and adjusts for anticipated changes. Incremental budgeting does not encourage building the budget from zero and justifying each item of cost. It also does not allow for the changing nature of the business environment as it is inward looking. ZBB does require each cost element to be specifically justified, as though the activities to which the budget relates were being undertaken for the first time, thereby avoiding the problems encountered with incremental budgeting.
149 CHAPTER 7 Standard Costing
150 Standard Costing ICMA Standard Cost is a unit concept. It can be defined as an estimated cost of a cost unit, prepared in advance of production or supply, correlating a technical specification of materials and labor to the prices and wages ratio estimated for a selected period of time, with the addition of an apportionment of the overheads expenses estimated for the same period within a prescribed set of working conditions. CIMA Standard Costing can be defined as the preparation of standard costs and their use to clarify the financial results of a business, particularly by the measurement of variations of actual costs from standard costs and the analysis of the causes of the variations for the purposes of maintaining maximum efficiency by executive action. Standard Hour (CIMA): The quantity of work achievable at a standard performance, expected in terms of a standard unit of work in a standard period of time. Types of Standards: 1. Basic Standards out-dated not used for budget preparation 2. Ideal Standards attained under most suitable conditions- Allowance for normal inefficiency is not provided for. 3. Expected Standards or currently attainable due allowances for normal wastages tight but attainable Budget Vs. Standard (Similarities) Comparison Of budget and Standards Budgets and standards are not same thing. They are setup for different purposes. Similarities: Following are certain fundamental principles which are common to both standard and budget. 1. They are both prepared prior to given period of times as a plan to be pursued during that period i.e. established of program targets. 2. Comparison of actual with plan 3. The analysis of significant deviation of cause 4. Departmental heads may be made accountable for the performance of their departments which is monitored by either Budgetary Control or standard cost reporting.
151 Budget Vs. Standard (Differences) Budget 1. Budgeted cost is the predetermined cost of producing a number of units i.e. it is a total concept.. 2. Budget can be set for all functions. 3. The budgets emphasize the cost targets that should not be exceeded. 4. The purpose of budget is to forecast requirements in terms of manpower, finance, production, sales etc, to attain given objective 5. In budgets if the actual cost is less then budgeted cost, it is accepted as good performance as the variance is not normally investigated. Standard 1. Standard cost is a predetermined cost of a cost unit. 2. Standard costs are normally set only for the manufacturing function. 3. Standards emphasize the cost to be anticipated under expected working exceeded conditions. 4. The purpose of standard cost is to determine what individual costs might be with in a prescribed set of working conditions 5. Any significant variation from standards, whether favorable or unfavorable is analyzed, investigated and reported so that corrective action may be taken. Standards Setting Standard Material Per Kg Standard Labor Rs. Per hour Purchase price/ Per kg 3.6 Basic Rate 10 Freight % tax 1 Receiving and handling % fringe benefit 3 Less discount (0.09) Total cost 4 Total cost 14 Material Qty per unit Kg Standard per unit Hours Bill of material 2.7 Basic labor time 1.9 Allowance for wastage 0.2 Allowance for break 0.1 Allowance for rejects 0.1 Allowance for cleanup 0.3 Allowance for rejects 0.2 Total 3 Total 2.5 Standard material cost per unit of output = 4 kg x 3 = 12 Standard labor cost per unit 2.5 hours x Rs. 14 = 35 Sources of variances: Joel S. Demacki ( information analyst) mentions five sources of production cost variances: 1. Random fluctuations under Efficient operations. 2. Prediction Error
152 3. Planning Error 4. Errors in accumulating cost data. 5. Operating error Significance of Cost Variances 1. Size of variance i. Rupees amount ii. Percentage of standard 2. Recurring variances 3. Trends 4. Controllability 5. Favorable variances 6. Costs and benefits of investigation Advantages of Standard Costing 1. Effective cost control: The most important advantage of standard costing is that it facilitates the control of cost. Control is exercised by comparing actual performance with standards and taking corrective actions. 2. Help in Planning: Establishing standards is a very useful exercise in business planning in business planning. Which instills in the management a habit of thinking in advance. 3. Provides incentives: The standard provides incentives and motivate to work with greater effort. This increases efficiency and productivity. 4. Fixing prices and formulating policies: Standard costs are a valuable aid to management in determining prices and formulating production policies. 5. Facilitates Coordination : While establishing standards, the performance of different departments such as production, sales, purchase etc. is taken into account. Thus through the working of standard cost system, co-ordination of various functions is achieved. 6. Facilitates delegation of authority: Delegation of authority and fixing responsibility for performance may be identified with the persons concerned. 7. Cost Reduction: By fixing standards, certain inefficiencies are reduced, such as material wastage, idle time, lost machine hours etc. 8. Valuation of Stocks: Standard costing simplifies the valuation of stock because the stock is valued at standard cost. 9. Management Exception: Reporting of variance is based on the principle of management by exception. Only variances beyond a predetermined limit may be considered by the management for corrective action. This also reduces the cost of preparing reports. 10. Economical and Simple: Standard costing simplifies the valuation of stock because the stock is valued at standard cost. Disadvantages of standard costing
153 Standard Costing may suffer from certain disadvantages: 1. The system may not be appropriate to every business. 2. The staff may not be capable of operating the system. 3. A business may not be able to keep standards up-to date. In other words, a business may not revise standards to keep pace with the frequent changes in manufacturing conditions. 4. Inaccurate and unreliable standards cause misleading results and thus may not enjoy the confidence of the users of the system. 5. Operation of the standard costing system is a costly affair and small firms cannot afford it. 6. Standard costing is expensive and unsuitable in job order industries manufacturing non-standardized products. 7. Revision of Standard is very expensive. Variance analysis Definition The evaluation of performance by means of variances, whose timely reporting should maximize the opportunity for management action. Investigation of variances The benefits of investigation a variance should never exceed the cost of investigation. Factors to look for: Size Controllable/ uncontrollable Interrelationships The type of standard One time/over a period of time Set a tolerance limit Usefulness of variances Variance analysis is intended to draw management attention to the existence of likely problems and opportunities. The purpose of the analysis is to analyze the total variance into elements, so that the causes of the differences are revealed.
154 To establish responsibility and to take corrective action.
155 Question: 1 (a) A company uses variance analysis to monitor the performance of the team of workers which assembles Product M. Details of the budgeted and actual performance of the team for last period were as follows: Budget Actual Output of product M 600 units 680 units Wage rate 30 per hour 32 per hour Labour hours 900 hours 1,070 hours It has now been established that the standard wage rate should have been per hour. Answer: 1 a. Calculate the labour rate planning variance and calculate the operational labour efficiency variance. b. Explain the major benefit of analyzing variances into planning and operational components. c. Briefly explain three limitations of standard costing in the modern business environment. d. Briefly explain three factors that should be considered before deciding to investigate a variance. Difference in standard wage rate = 1 20 per hour Planning variance Operational efficiency variance (standard hours for actual output) x difference in wage rate 680 x (900/600) x ,020 x ,224 Adverse (standard hours for actual output actual hours) x revised wage rate (1,020-1,070) x x ,560 Adverse (ii) The major benefit of analysing the variances into planning and operational components is that the revised standard should provide a realistic standard against which to measure performance. Any variances should then be a result of operational management efficiencies and inefficiencies and not faulty planning.
156 Answer 1 (b) The main limitations of standard costing in the modern business environment are as follows: The business environment in the past was more stable whereas the modern business environment is more dynamic and subject to change. As a result if a business environment is continuously changing standard costing is not a suitable method because standards cannot be established for a reasonable period of time. The focus of the modern business environment is on improving quality and customer care whereas the environment in the past was focused on minimizing cost. The life cycle of products in the modern business environment is shorter and therefore standards become quickly out of date. The increase in automation in the modern business environment has resulted in less emphasis on labour cost variances. Answer 1 (c) The benefit of investigating a variance should never exceed the cost of investigation. However this can be difficult to ascertain and therefore a manager should decide to investigate a variance based on the following: Size Criteria will be laid down which state that variances which are of a certain amount or percentage will be investigated. This is an extremely simple method to apply but the cut off values can be subjective. Controllable / Uncontrollable There is little point in investigating a variance if it is uncontrollable. The cost in this situation would outweigh the benefits of investigation since there would be no benefit obtained. Interrelationships An adverse variance in one part of the business may result in a favourable variance elsewhere. These interdependencies must be considered when deciding on investigation. For example a favourable labour rate variance may result in an adverse efficiency variance where less skilled workers are employed, costing less, as a result the workers take longer to do the job and an adverse efficiency variance arises.
157 If a company sets an ideal standard this will usually lead to adverse variances. The manager will need to decide at what size of adverse variance an investigation should take place on such variances.
158 Question: 2 Dynamic manufacturers Ltd. produces a single product whose standard cost is as shown below: Standard Unit Cost Rs. Raw materials (5 Rs. 20 per Kg.) 100 Labor (4 Rs. 5) 20 Variable overheads (Rs. 3 per direct labor hour) 12 Fixed overheads (Rs. 6 per direct labor hour) 24 Standard Unit Cost 156 The standard selling price is Rs. 200 per unit and total marketing and administration expenses (Rs. 10 per unit)which are all basically fixed amount to Rs. 500,000 p.a. N.B. The Overheads are allocated on the basis of budgeted production of 50,000 units p.a. During the year the company produced 40,000 units and the following results were achieved: Rs. (000) Rs. (000) Sales 84,000 Cost of sales: Direct materials (208,000 Kg) 4,368 Labor (152,000 hours) 988 Variable overheads 456 Fixed overheads 1,250 7,062 Gross margin 1,338 Less: Selling and Admn. Exp. 450 Profit for the year 888 Required: a. A detailed cost variance analysis. b. Reconciliation of budgeted profit with realized profit. c. Criticisms against the traditional variance analysis as a tool for planning and control and suggestions advanced for its improvement.
159 Answer: 2 a. A detailed cost variance analysis. Sales Price Variance Actual Units sold x (St. Sp Act Sp) 40,000 x ( ) = 400,000 (F) Sales Volume Profit Variance Actual Units sold Budgeted Units sold ) x St. S Profit per Unit 40,000 x ( ) = 400,000 (F) (40,000 50,000) x 34 = 340,000 (A) Sales Price = 300 Less: Total Cost = 166 Standard Profit = 34 Material Price Variance: Actual Quantity x (Standard price Actual price) 208,000 Kgs x (Rs. 20 Rs. 21) = Rs. 208,000 (A) Material usage Variance Actual Material Usage St. Usage) *St. price (208,000 Kgs 200,000 Kgs) x Rs. 20 Rs. 160,000 (A) Labor Rate Variance Actual hours worked x (St. Rate Actual Rate) (152,000 hrs x (5 6.50) = Rs. 228,000 (A) Labor Efficiency Variance Actual labor hrs St. labor hours ) x St. Rate (152,000 hrs 160,000 hrs) x Rs. 5 = 40,000 (F) Variable Overhead Spending Variance Actual V.O.H Rs Absorbed Volt (152,000 x 3) Rs Nil Variable Overhead Efficiency Variance: Absorbed V.O.H Rs. 456,000 Standard V.O.H at actual output 40,000 units x Rs. 12 Rs. 480,000 Variable O.H. Efficiency Variance (F) 24,000 Fixed overhead Efficiency Productivity Variance: (Absorbed F.OH St. F. O.H at capacity attained) (912, ,000) = Rs. 48,000 (F) 152,000 * 6 912,000
160 40,000 *24 = 960,000 Fixed Factory Overhead Capacity Variance Budgeted Fixed O.H Absorbed Fixed O.H (1,200, ,000 = Rs. 288,000 (A) Selling and Administration Expenses Spending Variance (Actual S/A Exp. Budgeted S/A Exp.) (450, ,000) = 50,000 (F) Selling and Administration Expenses Efficiency Variance (Budgeted S/A Exp. Absorbed S/A Exp.) (500, ,000) = 100,000 (A) 40,000 * 10 = 400,000 Dynamic Manufactureres Limited Operating Statement Reconciliation of Budgeted Profit with Realized Profit Rs. Budgeted Profit (50,000 x 34) 1,700,000 Sales Price Variance 400,000 (F) Sales Volume Variance 340,000 (A) 60,000 (F) 1,760,000 Cost Variance (F) (A) Material Price Variance 208,000 Material Usage Variance 160,000 Labor Rate Variance 228,000 Labor Efficiency Variance 40,000 Variable O.H Spending Variance Variable O.H Efficiency Variance 24,000 Fixed O.H Spending Variance 50,000 Fixed O.H Capacity Variance 288,000 Fixed O.H Efficiency Variance 48,000 Selling & Admn. Exp. Variance 50,000 Selling & Admn. Exp. Efficiency Variance 100, ,000 1,034, ,000 (A) Actual net Profit 888,000
161 c. Criticism Against Traditional Variance: Traditional Variance Analysis fails to detect. 1. An implementation Deviation is a human or mechanical failure to achieve a specific obtainable action. 2. A prediction deviation an error in predicting a parameter value in the decision model. 3. A measurement deviation is an error in measuring the actual cost of operating a process. 4. Trading off certain variance. Suggestions: 1. To Calculate planning and operating variance. 2. To investigate variance which justify on cost and benefit criteria. 3. To feedback and review.
162 Question:3 D Limited manufactures and sells musical instruments, and uses a standard cost system. The budget for production and sale of one particular drum for April was 600 units at a selling price of 72 each. When the sales director reviewed the results for April in the light of the market conditions that had been experienced during the month, she believed that D Limited should have sold 600 units of this drum at a price of 82 each. The actual sales achieved were 600 units at 86 per unit. Calculate the following variances for this particular drum for April: (a) Selling price planning variance (b) Selling price operating variance Answer:3 A Original plan 600 x 72 = 43,200 B Revised ex post plan 600 x 82 = 49,200 C Actual results 600 x 86 = 51,600 Selling price planning variance is B A = 6,000 Fav Selling price operating variance is C B = 2,400 Fav (Total variance is C A = 8,400 Fav to check)
163 Question:4 A company has a process in which the standard mix for producing 9 litres of output is as follows: $ 4.0 litres of D at $ per litre litres of E at $5 per litre litres of F at $2 per litre A standard loss of 10% of inputs is expected to occur. The actual inputs for the latest period were: $ 4,300 litres of D at $9 00 per litre 38,700 3,600 litres of E at $5 50 per litre 19,800 2,100 litres of F at $2 20 per litre 4,620 63,120 Actual output for this period was 9,100 litres. You are required to calculate (a) The total materials mix variance (b) The total materials yield variance Answer:4 Actual usage in standard proportions $ D = 4,000 litres at $9 per litre 36,000 E= 3,500 litres at $5 per litre 17,500 F= 2,500 litres at $2 per litre 5,000 58,500 (1) Actual usage in actual proportions D= 4,300 litres at $9 per litre 38,700 E= 3,600 litres at $5 per litre 18,000 F= 2,100 litres at $2 per litre 4,200 10,000 60,900 (2) Mix variance is (1) (2) = $2,400 Adverse Yield variance Standard cost of 1 litre is $58.50 / 9 = $6 50 Expected output is 10,000 x 90% = 9,000 litres Actual output = 9,100 litres Yield variance is (9,100 9,000) x $6.50 = $650 Fav s
164 Question:5 PP Ltd operators a standard absorption costing system. The following information has been extracted from the standard cost card for one of its products. Budgeted production 1,500 units Direct material cost: 7 kg x ,000 Actual results for the period were as follow: Production 1,600 units Direct material (purchased and used): 12,00 kg 52,200 It has subsequently been noted that due to a change in economic conditions the best price that the material could have been purchased for was 4.50 per kg during the period. (i) (ii) Calculate the material price planning variance. Calculate the operational material usage variance. Answer:5 per kg Planning variance Rate standard 4.10 Cost standard x 11,200= 4,480 Adverse Usage variance Kg Standard 7 x 1,600 11,200 Actual 12, x 4.50 = 3,600 Adverse
165 Question:6 Q plc uses standard costing. The details for April were as follows: Budgeted output 15,000 units Budgeted labour hours 60,000 hours Budgeted labour cost 540,000 Actual output 14,650 units Actual labour hours paid 61,500 hours Productive labour hours 56,000 hours Actual labour cost 522,750 Calculate the idle time variance for April. Answer:6 Labour standard for 1 unit is 4 hours * 9 per hour Idle time variance = (61,500 56,000) * 9 = 5,500 * 9 = 49,500 adverse
166 Question:7 Q plc uses standard costing. The details for April were as follows: Budgeted output 15,000 units Budgeted labour hours 60,000 hours Budgeted labour cost 540,000 Actual output 14,650 units Actual labour hours paid 61,500 hours Productive labour hours 56,000 hours Actual labour cost 522,750 Calculate the labour efficiency variance for April. Efficiency variance = (std hour for actual output actual hours)* std rate = [(14,650*4) 56,000]* 9 = (58,600 56,000)* 9 = 23,400 favorable
167 Question:8 A company uses variance analysis to monitor the performance of the team of workers which assembles Product M. Details of the budgeted and actual performance of the team for last period were as follows: Budget Actual Output of product M 600 units 680 units Wage rate 30 per hour 32 per hour Labour hours 900 hours 1,070 hours It has now been established that the standard wage rate should have been per hour. (i) (ii) (a) (b) (c) Calculate the labour rate planning variance and calculate the operational labour efficiency variance. Explain the major benefit of analyzing variances into planning and operational components. Briefly explain three limitations of standard costing in the modern business environment. Briefly explain three factors that should be considered before deciding to investigate a variance. G Group consists of several autonomous divisions. Two of the divisions supply components and services to other divisions within the group as well as to external clients. The management of G Group is considering the introduction of a bonus scheme for managers that will be based on the profit generated by each division. Briefly explain the factors that should be considered by the management of G Group when designing the bonus scheme for divisional managers. Answer:8(a) (i) Difference in standard wage rate = 1 20 per hour Planning variance Operational efficiency Variance (standard hours for actual output) x difference in wage rate 680 x (900/600) x ,020 x ,224 Adverse (standard hours for actual output actual hours) x revised wage rate (1,020-1,070) x x ,560 Adverse (ii) The major benefit of analysing the variances into planning and operational components is that the revised standard should provide a realistic standard against which to measure performance. Any variances should then be a result of operational management efficiencies and inefficiencies and not faulty planning.
168 Answer (b) The main limitations of standard costing in the modern business environment are as follows: The business environment in the past was more stable whereas the modern business environment is more dynamic and subject to change. As a result if a business environment is continuously changing standard costing is not a suitable method because standards cannot be established for a reasonable period of time. The focus of the modern business environment is on improving quality and customer care whereas the environment in the past was focused on minimizing cost. The life cycle of products in the modern business environment is shorter and therefore standards become quickly out of date. The increase in automation in the modern business environment has resulted in less emphasis on labour cost variances. Answer (c) The benefit of investigating a variance should never exceed the cost of investigation. However this can be difficult to ascertain and therefore a manager should decide to investigate a variance based on the following: Size Criteria will be laid down which state that variances which are of a certain amount or percentage will be investigated. This is an extremely simple method to apply but the cut off values can be subjective. Controllable / Uncontrollable There is little point in investigating a variance if it is uncontrollable. The cost in this situation would outweigh the benefits of investigation since there would be no benefit obtained. Interrelationships An adverse variance in one part of the business may result in a favourable variance lsewhere. These interdependencies must be considered when deciding on investigation. For example a favourable labour rate variance may result in an adverse efficiency variance where less skilled workers are employed, costing less, as a result the workers take longer to do the job and an adverse efficiency variance arises. Type of standard
169 If a company sets an ideal standard this will usually lead to adverse variances. The manager will need to decide at what size of adverse variance an investigation should take place on such variances. Answer to (d) Firstly G Group must consider the transfer pricing system. The system must provide information that motivates divisional managers to make good economic decisions not just for themselves but for the company as a whole. It should also provide information that is useful for evaluating the managerial and economic performance of the divisions and should ensure that divisional autonomy is not undermined. If there is unlimited demand for the output of the two divisions in the market then the transfer price should equal the market price less any savings as a result of internal transfer. This then allows the divisions to report a profit on the transfers and will not cause any issue for the calculation of the bonus. However, if there is a limit on the amount that can be sold on the external market then the divisions would be transferring at marginal cost as there is no opportunity cost. In this case they will simply cover the marginal cost and have no contribution towards fixed costs or profit. This will mean that if the bonus is awarded on profit the divisional manager will not receive a bonus despite the fact that they have made internal supplies. Therefore the company must ensure that in order for decisions to remain goal congruent the bonus scheme must allow for internal transfers that impact on the divisions ability to earn bonuses. Other areas to consider when implementing a bonus scheme include: It should be clearly understood by all personnel involved; There should be no delay between the awarding of the bonus and the subsequent payment of the bonus; It should motivate the personnel; It should not cause sub-optimal behaviour; Controllable and uncontrollable costs and revenues should be identified separately.
170 CHAPTER 8 Decision Making
171 The Decision-Making Process 1. Clarify the Decision Problem 2. Specify the Criterion 3. Identify the Alternatives 4. Develop a Decision Model 5. Collect the Data 6. Make a Decision
172 Cost Classification for Decision Making Management decisions involve a selection between alternative courses of action and costs play a very prominent role in decision-making. For analytical process, costs are classified as under: a) Differential or Incremental Costs: Differential cost is the increase or decrease in total cost which results from an alternative course of action. It is ascertained by subtracting the cost of one alternative from the cost of another alternative. The alternative choice may arise because of change in method of production, changes in sales volume, change in product mix, make or buy decisions, accept or reject order. Example: Current manufacturing cost of XYZ Co. is Rs.100,000. Due to expansion operations, costs increase by 25%. So this incremental cost of Rs.(100,000*.25 = 25000) is the differential or incremental cost. b) Imputed Costs: These are hypothetical costs which are specifically computed for the purpose of decision making. Interest on capital is a common type of imputed cost. The failure to consider imputed interest cost may result in an erroneous decision. For example, project A requires a capital investment of Rs. 50,000 and project B Rs.40,000. Both the projects are expected to yield Rs. 10,000 as additional profit. Obviously, these two projects are not equally desirable since project B requires less investment and thus should be preferred. c) Opportunity Costs: The value of a benefit sacrificed when one course of action is chosen, in preference to an alternative. The opportunity cost is represented by the foregone potential benefit from the best rejected course of action. CIMA official Terminology Example: Assume a company owns a building which has been fully depreciated in the books of accounts. Yet, it has a rental value of Rs.5000 per annum. Now, if the company is considering the use of this building in a special project a change in lieu of rent of 5000 (opportunity cost) should be included in evaluating the desirability of the project despite the fact that books of accounts show it at nil value. Opportunity cost is a pure decision-making cost and is not entered in the books of accounts. c) Replacement Cost: This is the cost at which there could be purchased an asset identical to that which is being replaced. In simple words, replacement cost is the current market cost of replacing an asset. When the management considers the replacement of an asset, it has to keep in mind its replacement cost and not the cost at which it was purchased earlier. d) Sunk Cost: A sunk cost is cost that has been irreversibly incurred or committed and cannot therefore be considered relevant to a decision. Sunk cost costs may also be deemed irrecoverable costs.
173 CIMA official Terminology Example: An example of a sunk cost could be development costs already incurred. Suppose that a company has spent Rs.250,000 in developing a new service for customers, but the marketing department s most recent findings are that the service might not gain customer acceptance and could be a commercial failure. The decision whether or not abandon the development of the new service would have to be taken, but the Rs. 250,000 spent so far should be ignored by the decision makers because it is a sunk cost. (CIMA performance Management 3 rd edition, pg: 12) e) Out-of-pocket Costs: Out-of-pocket costs represent cash payments to be incurred (such as rent, wages) as against costs which do not require cash outlay (such as depreciation). This is frequently used by business concerns as an aid in making decisions pertaining to price fixation during depression, make or buy decisions, etc. f) Future Costs: No decision can change what has already happened. The past is history and decisions made now can affect only what will happen in the future. Thus, the only relevant costs for decision- making are pre-determined or future costs. But, it is the historical costs which generally provide a basis for computing future costs. g) Discretionary Cost: A discretionary cost is a cost whose amount, within a particular time period, is determined by, and can be altered by, the budget holder. Discretionary fixed costs, such as advertising and research and development costs, are incurred as a result of a top management decision, but could be raised or lowered at fairly short notice (irrespective of the actual volume of production and sales). (CIMA performance Management 3rd edition, Pg: 413) h) Committed Cost: A committed cost is a future cash outflow that will be incurred any way, whatever decision is taken now about alternative opportunities. Committed costs may exist because of contracts already entered into by the organization, which it cannot now avoid. (CIMA performance Management 3 rd edition, Pg: 32)
174 Question: 1 Miami Industries received an order for a piece of special machinery from Jay Company. Just as Miami completed the machine, Jay Company declared bankruptcy, defaulted on the order, and forfeited the 10 percent deposit paid on the selling price of $72,500. Miami s manufacturing manager identified the costs already incurred in the production of the special machinery for Jay Company as follows: $ Direct material.. 16,600 Direct labor... 21,400 Manufacturing overhead applied.. Variable ,700 Fixed.. 5,350 16,050 Fixed selling and administrative costs.... 5,405 Total.. 59,455 Another company, Kaytell Corporation, will buy the special machinery if it is reworked to Kaytell s specifications. Miami Industries offered to sell the reworked machinery to Kaytell as a special order for $68,400. Kaytell agreed to pay the price when it takes delivery in two months. The additional identifiable costs to rework the machinery to Kaytell s specifications are as follows: $ Direct material.. 6,200 Direct labor... 4,200 Total... 10,400 A second alternative available to Miami s management is to convert the special machinery to the standard model, which sells for $62,500. The additional identifiable costs for this conversion are as follows: $ Direct material 2,850 Direct labor. 3,300 Total. 6,150 A third alternative for Miami Industries is to sell the machine as is for a price of $52,000. However, the potential buyer of the unmodified machines does not want it for 60 days. This buyer has offered a $7,000 down payment, with the remainder due upon delivery.
175 The following additional information is available regarding Miami s operations: The sales commission rate on sales of standard models is 2 percent, while the rate on special orders is 3 percent. Normal credit terms for sales of standard models are 2/10, net/30. This means that a customer receives a 2 percent discount if payment is made within 10 days, and payment is due no later than 30 days after billing. Most customers take the 2 percent discount. Credit terms for a special order are negotiated with the customer. The allocation rates for manufacturing overhead and fixed selling and administrative costs are as follows: Manufacturing costs: Variable.. Fixed... Fixed selling and administrative costs.. 50% of direct-labor cost 25% of direct-labor cost 10% of the total of direct-material, direct labor, and manufacturing overhead costs Normal time required for rework is one month Required: 1. Determine the dollar contribution each of the three alternatives will add to Miami Industries before-tax profit 2. If Kaytell makes Miami Industries a counteroffer, what is the lowest price Miami should accept for the reworked machinery from Kaytell? Explain your answer. 3. Discuss the influence fixed manufacturing-overhead cost should have on the sale price quoted by Miami Industries for special orders.
176 Solution: 1 1 Sell to Kaytell as a Special Order Convert to Standard Model Sell as Special Order as it is $ Sales price 68,400 62,500 52,000 Less: cash discount - 1,250 - Net price 68,400 61,250 52,000 Additional manufacturing costs: Direct material 6,200 2,850 - Direct labor 4,200 3,300 - Variable manufacturing overhead 2,100 1,650 - Total additional manufacturing costs 12,500 7,800 - Commissions 2,052 1,250 1,560 Total costs and expenses 14,552 9,050 1,560 Net contribution 53,848 52,200 50,440 2 $ Contribution from sale to Kaytell 53,848 Contribution from next best alternative: 52,200 sell as standard model Difference in contribution 1,648 Percentage of sales price received net of commission on special order: (100% - 3%) 97% Acceptable reduction in sales price from Kaytell 1,699 (rounded) (1,648/ 97%) Original price quote to Kaytell 68,400 Acceptable reduction 1,699 Minimum acceptable price from Kaytell 66,701 Proof: Suppose Kaytell pays a price of $66,701 Sales price 66,701 Less: Sales commission (3%) 2,001 64,700 Less: Additional manufacturing costs 12,500 Contribution with reduced price to Kaytell 52,200
177 Therefore, at a price of $66,701 to Kaytell, Miami Industries' management would be indifferent between selling the machine to Kaytell and converting it to a standard model. At any price quote from Kaytell below $66,701, Miami Industries' would prefer to convert the machine to a standard model. 3 Fixed manufacturing overhead should have no influence on the sales price quote by Miami Industries for special orders. Management should accept special orders whenever the firm is operating substantially below capacity. Including below the breakeven point, whenever the marginal revenue from the order exceeds the marginal cost. Normally, this would mean that the order should be accepted as long as the sales price of the order exceeds the variable production costs. The special order will result in a positive contribution toward fixed costs. the fixed manufacturing overhead is not considered in pricing, because it will be incurred whether the order is accepted or not.
178
179 Question: 2 (Pricing a Special Order; International) Badger Valve and Fitting Company, located in southern Wisconsin, manufactures a variety of industrial valves and pipe fittings that are sold to customers in nearby states. Currently, the company is operating at about 70 percent capacity and is earning a satisfactory return on investment. Management has been approached by Glasgow Industries Ltd. of Scotland with an offer to buy 120,000 units of valve. Glasgow Industries manufactures a valve that is almost identical to Badger s pressure valve. Glasgow needs the 120,000 valves over the next four months to meet commitments to its regular customers. Glasgow is prepared to pay $19 for each of the valves. Badger s total product cost, based on current attainable standards, for the pressure valve is $20, calculated as follows: $ Direct material 5.00 Direct labor Manufacturing overhead Total product cost Manufacturing overhead is applied to production at the rate of $18 per standard direct-labor hour. This overhead rate is made up of the following components: $ Variable manufacturing overhead 6.00 Fixed manufacturing overhead (traceable) 8.00 Fixed manufacturing overhead (allocated) 4.00 Applied manufacturing overhead rate Additional costs incurred in connection with sales of the pressure valve include sales commissions of 5 percent of $ 1.00 per unit. However, the company and freight expense of $1.00 per unit. However, the company does not pay sales commission on special orders that come directly to management. In determining selling prices, Badger adds a 40 percent markup to total product cost. This provides a $28 suggested selling price for the pressure valve. The Marketing Department, however, set the current selling price at $27 in order to maintain market share. Production management believes that it can handle the Glasgow Industries order without disrupting its scheduled production. The order would, however, require additional fixed factory overhead of $12,000 per month in the form of supervision and clerical costs. If management
180 accepts the order, 30,000 pressure valves will be manufactured and shipped to Glasgow Industries each month for the next four months. Glasgow s management has agreed to the shipping charges for the valves. Required: 1. Determine how many direct-labor hours would be required each month to fulfill the Glasgow Industries order. 2. Prepare an analysis showing the impact of accepting the Glasgow Industries order. 3. Calculate the minimum unit price that Badger Valve and Fitting Company s management could accept for the Glasgow Industries order without reducing net income. 4. Identify the factors, other than price, that Badger s management should consider before accepting the Glasgow Industries order.
181
182 Solution: 2 1 The manufacturing overhead rate is $18.00 per standard direct-labor hour, and the standard product cost includes $9.00 of manufacturing overhead per pressure valve. Accordingly, the standard direct-labor hour per finished valve is 1/2 hour ($9.00/ $18.00). Therefore, 30,000 units per month would require 15,000 direct-labor hours. 2 The analysis of accepting the Glasgow Industries' order of 120,000 units is as follows: Totals for 120,000 Per unit units $ Incremental revenue ,280,000 Incremental costs: Variable costs: Direct material ,000 Direct labor ,000 Variable overhead ,000 Total variable costs ,680,000 Fixed overhead: Supervisory and clerical costs 48,000 (4 12,000) Total incremental costs 1,728,000 Total incremental profit 552,000 The following costs are irrelevant to the analysis: Shipping Sales commission Fixed manufacturing overhead (both traceable and allocated) 3 The minimum unit price that Badger Valve and Fitting Company could accept without reducing net income must cover the variable unit cost plus the additional fixed costs. Variable unit cost: Direct material 5.00 Direct labor 6.00 Variable overhead Additional fixed cost (48,000* / 120,000) 0.40 Minimum unit price * Additional fixed cost = 4 months*12,000 per month = 48,000
183 4 Badger's management should consider the following factors before accepting the Glasgow Industries order: The effect of the special order on Badger's sales at regular prices. The possibility of future sales to Glasgow Industries and the effects of participating in the international marketplace The company's relevant range of activity and whether or not the special order will cause volume to exceed this range. The effect on machinery or the scheduled maintenance of equipment. Other possible production orders that could come in and require the capacity allocated to the Glasgow job.
184 Question No. 3: Brown Ltd. is a company that has in stock some materials of type XY that cost Rs. 75,000 but these materials are now obsolete and have a scrap value of only Rs. 21,000. Other than selling the material for scrap, there are only two alternative uses for them. Alternative 1: Convert the obsolete materials into a specialized product, which would require the following additional work and materials: Material A 600 units Material B 1,000 units Direct labour: 5,000 hours unskilled 5,000 hours semi-skilled 5,000 hours highly skilled Total 15,000 Extra selling and delivery expenses Rs. 27,000 Extra advertising expenses Rs. 18,000 The conversion would produce 900 units of saleable products, and these could be sold for Rs. 300 per unit. Material A is already in stock and is widely used within the firm. Although present stocks together with orders already planned will be sufficient to facilitate normal activity, any extra material used by adopting this alternative will necessitate such materials being replaced immediately. Material B is also in stock, but it is unlikely that any additional supplies can be obtained for some considerable time because of an industrial dispute. At the present time material B is normally used in the production of product Z, which sells at Rs. 390 per unit and incurs total variable cost (excluding material B) of Rs. 210 per unit. Each unit of product Z uses four units of Material B. The details of materials A and B are as follows: Material A Material B (Rupees) (Rupees) Acquisition cost at time of purchase 100 per unit 10 per unit Net realizable value 85 per unit 18 per unit Replacement cost 90 per unit Alternative 2: Adapting the obsolete materials for use as a substitute for a sub-assembly that is regularly used in the firm. Details of the extra work and materials required are as follows: Material C 1,000 units Direct labour: 4,000 hours unskilled 1,000 hours semi-skilled 4,000 hours highly skilled Total 9,000 1,200 units of the sub-assembly are regularly used per quarter at a cost of Rs. 900 per unit. The adaption of material XY would reduce the quantity of the sub-assembly purchased from outside the firm to 900 units for the next quarter only. However, since the volume of purchases would be
185 reduced, some discount would be lost, and the price of those purchased from outside would increase to Rs. 1,050 per unit for the quarter. Material C is not available externally, but is manufactured by Brown Ltd. The 1,000 units required would be available from stocks, but would be produced as extra production. The standard cost per unit of material C would be as follows (Rupees Direct labour, 6 hours unskilled labour 18 Raw materials 13 Variable overhead, 6 hours at Re. 1 6 Fixed overhead, 6 hours at Rs The wage rates and overhead recovery rates for Brown Ltd. are: Variable overhead Re. 1 per direct labour Fixed overhead Rs. 3 per direct labour Unskilled-labour Rs. 3 per direct labour Unskilled-labour Rs. 4 per direct labour Highly skilled labour Rs. 5 per direct labour The unskilled labour is employed on a casual basis, and sufficient labour can be acquired to exactly meet the production requirements. Semi-skilled labour is part of the permanent labour force, but the company has temporary excess supply of this type of labour at the present time. Highly skilled labour is in short supply and cannot be increased significantly in the short term; this labour is presently engaged in meeting the demand for product L, which requires 4 hours of highly skilled labour. The contribution from the sale of one unit of product L is Rs. 24. Required: Prepare and present cost information, advising whether the stocks of 20 material XY should be sold, converted into a specialized product (alternative 1) or adapted for use as a substitute for a sub-assembly (alternative 2).
186 Solution No.3: Alternative 1: Conversion vs immediate sale Rs. Rs. Rs. 1 Sale revenue (900 units) 270,000 Less: Relevant costs: 2 Material XY opportunity cost 21,000 3 Material A (600 units at Rs. 90) 54,000 4 Material B (1000 units at Rs. 45) 45,000 5 Direct Labour: Un Skilled (5000 hrs at Rs. 3) 15,000 Semi Skilled - Highly Skilled 5,000 x (5+6) = 55,000 55,000 70,000 6 Variable overhead (15,000 hrs x 15,000 Rs.1) 7 Selling & delivery expenses 27,000 Advertising 18,000 8 Fixed overhead NIL 250,000 Excess of relevant revenues 20,000 Alternative 2: Adaption versus immediate sale 3 Rs. Rs. Rs. 9 Saving on purchase of sub-assembly Normal spending (1,200 units x Rs. 1,080, ) Revisal spending (900 units x Rs. 945, , ) Less: Relevant Cost 2 Material XY opportunity Cost 21, Material C (1,000units x Rs37) 37,000 5 Direct labour Un skilled(4,000hrsxrs14) 12,000 Sami skilled Nil Skilled(4,000hrsxRs11) 44,000 56,000 6 Variable overhead 9,000 8 Fixed Overhead NIL 123,000 Net relevant Savings 12,000 Notes: 1. There will be additional sales revenue of Rs270,000 if alternative 1 is chosen. 2. Acceptance of either alternative 1or 2 will mean a loss of revenue of Rs21,000 from the obsolete material XY. This is an opportunity, Cost, which must be covered which ever alternative is chosen. The original purchase cost of Rs 75,000 for material XY is a sale cost and is irrelevant.
187 3. Acceptance of alternative 1 will mean that material A must be replaced at an additional cost of Rs. 54, Acceptance of alternative 1 will mean that material B will be diverted from the production of product Z. The excess of relevant revenues over relevant over relevant cost for product Z is Rs 180,and each unit of product Z use four units of materials. The lost contribution (excluding the cost of materials B which is incurred for both alternatives) will therefore be Rs. 45for each unit of materials B that is used the converting the raw material into a specialized product. 5. Unskilled labour can be matched exactly to the company s production requirements. The acceptance of either alternative 1or 2 will cause the company to incur additional unskilled labour that is used. It is assumed that the semi-skilled labour would be retained and that these would be sufficient excess supply for either alternative at no extra cost to the company. In these circumstances semi-skilled labour will not be relevant cost skilled labour is in short supply and can only be obtained by reducing production of product L, resulting in a lost contribution of Rs.24 or Rs.6 per hour of skilled labour.we have already established that the relevant cost of labour that is the short supply in the hourly labour cost plus the lost contribution per hour, so the relevant labour cost here will be Rs.11 per hour 6. It is assumed that for each direct labour hour of input variable over heads will increased by Rs.1. As each alternative uses additional direct labour hrs, variable overheads will increase giving a relevant cost of Rs. 1 per direct labour hr. 7. As advertising, selling and distribution expenses will be different it alternative 1 is chosen, these costs are clearly relevant 1 is chosen, these cost are clearly relevant to the decision. 8. The company s fixed overheads will remain the same whichever alternative, is chosen and so fixed overheads are not a relevant cost for either alternative. 9. The Cost of purchasing the sub-assembly will be reduced by Rs135,000, if the second alternative is chosen, and so these savings are relevant to the decision. The company will incur additional variable cost of Rs. 37 for each unit of material C that is manufactured, so the fixed overheads for material C are not a relevant cost.
188 Question No. 4: Following is the budgeted room occupancy of Hotel Shaheen for the next financial year. Average % July September 90 October December 55 January March 45 April June 60 Revenue for the year is estimated at Rs. 150 million, which is generated from the following three profit centres Profit Centre % Accommodation 45 Restaurant/catering 35 Snacks bar 20 Total 100 Note: The accommodation revenue is earned from several different categories of guests each of which pay a different rate per room. The three profit centres have the following gross margin percentage: Accommodation Restaurant/Cater Snacks Bar % Revenue Wages Cost of sales Direct costs Gross margin Fixed costs for the year are estimated at Rs. 28,250,000. Capital employed is Rs. 350 million. In order to improve the return on capital employed, the management have following two propositions under consideration: 1. To offer special two nights package at a reduced price of Rs. 1,250 per night. It is expected that those availing the/offer would spend an amount equal to 40% of the accommodation charge in the restaurant (catering), and 20% in the snacks bar. 2. To increase prices. Management feels that there will be no drop in volume of sales if restaurant (catering) prices are increased by 10% and snacks bar prices by 5%. Accommodation prices will also have to be increased. Required: (a) (b) (i) Calculate the budgeted return on capital employed (ROCE) before tax. Calculate How many two-nights packages would need to be sold each week in the three off-peak quarters to improve the return on capital employed,(roce) by a further 4% above the percentage, calculated in (a) above.
189 (ii) By what percentage the price of accommodation would need to be increased to achieve the desired increase in ROCE calculated in [b (i)] above.
190 Solution: 4 HOTEL SHAHEN a. Budgeted Rate of return on capital employee. Sales Gross profit value (Rs. 000) (%) (Rs. 000) Accommodation 45% 67, ,250 Catering (Resp.) 35% 52, ,500 Snacks bar 20% 30, , , ,750 Less Fixed Costs 28,250 Profit before tax 38,500 ROCE 38,500 11% 350,000 b. (i) Required additional profit = 4% x 350,000,000 = Rs 14,000,000 Contribution per 2 night package: Sales GP% Margin Contribution (Rs.) Accommodation (2 x 1,250) 2, ,750 Catering (40% x 1, ,500) Snacks bar (20 x 2.500) ,100 Number of 2 night-packages required to provide contribution of Rs million. = 14,000,000% 2,100 = 6,667 Number of package per week in three off-peak quarters is (Oct/Dec, Jan/March + 13 weeks for quarter = 6,667/39 = (b)(i) b. (ii) Required additional contribution Rs. 000 Less: Contribution arising from overseas the selling prices 14,000 Catering (Restaurant) = 10% of Rs. 5,250 52,500,000 Snacks bar = 5% of Rs. 30,000,000 1,500 Required additional contribution from accommodation 7,250 Accommodation Prices Rs , % bii 67,500 In order to increase the derived ROCE, accommodation prices would have to be increased by 10.74% (it is irrelevant that the demand would not be offered by the increase).
191
192 Question:5 Paragon Laboratories manufactures medicated drips that are sold to hospitals through a network of independent sales agents located at Karachi and Islamabad. These sales agents sell a variety of products to hospitals in addition to Paragon s medicated drips. The sales agents are currently paid 18% commission on sales, and this commission rate was used when Paragon s management prepared the following budgeted income statement for the coming year: Paragon Corporation Budgeted Income Statement Particulars Rs. Rs. Sales 150,000,000 Cost of goods sold: Variable 87,000,000 Fixed 14,000, ,000,000 Gross profit 49,000,000 Selling and administration expenses: Commission 27,000,000 Fixed advertising expenses 4,000,000 Fixed administrative expenses 16,000,000 47,000,000 Net Profit 2,000,000 Since the completion of the above statement, Paragon s management has learned that the independent sales agents are demanding an increase in the commission rate to 20% of sales for the coming year. This would be the third increase in commission demanded by the independent sales agents in five (5) years. As a result, Paragon s management has decided to investigate the possibility of hiring its own sales staff to replace the independent sales agents. Paragon s CFO estimates that the company will have to hire eight sales persons to cover the current market, and the annual payroll cost of these prospective employees will be around Rs.3,500,000, including fringe benefits. The sales persons will also be paid commission of 10% of sales. Travelling and entertainment expenses are expected to be total of Rs.2,000,000 for the year. The company will also have to hire a sales manager and support staff, whose salaries and fringe benefits will come to Rs.1,000,000 per year. To make up for the promotions that the independent sales agents had been running on behalf of Paragon, management believes that the company s budget for fixed advertising expenses should be increased by Rs.2,500,000. Required: i. Assuming sales of Rs.150,000,000 prepare income statement showing budgeted contribution for the coming year for each of the following alternatives: (A) The independent sales agents. commission rate remains unchanged at 18%. (B) The independent sales agents. commission rate increases to 20%. (C) The company employs its own sales force. ii. Calculate Paragon Corporations break-even point in sales rupees, for the coming year assuming the following: (A) The independent sales agents. commission rate remains unchanged at 18%. (B) The independent sales agents. commission rate increases to 20%. (C) The company employs its own sales force.
193 iii. iv. Refer to your answer to (i) B above. If the company employs its own sales force, what volume of sales would be necessary to generate the net income the company would realize if sales are Rs.150,000,000 and the company continues to sell through agents (at a 20% commission rate)? Determine the volume of sales at which net income would be equal regardless of whether Paragon Corporation sells through agents (at a 20% commission rate) or employs its own sales force.
194 Answer:5 The contribution format income statement (in thousands of rupees) for the three alternatives is: 18% Commission 20% Commission Own Sales Force Sales 150, , ,000 Less: Variables expenses: Var. COGS 87,000 87,000 87,000 Commission 27,000 30,000 15,000 Total variable exp. 114, , ,000 Contribution margin 36,000 33,000 48,000 Less: Fixed expenses Fixed COGS 14,000 14,000 14,000 Fixed advertising exp. 4,000 4,000 6,500 (W-1) Fixed marketing staff exp. 6,500 Fixed administrative exp. 16,000 16,000 16,000 (W-1) Total fixed exp. 34,000 34,000 43,000 Net operating income 2,000 (1,000) 5,000 Working: W-1 Fixed advertising and marketing exp. (if own sales force) Fixed advertising expense Fixed advertising expense 4,000 Additional cost 2,500 Total 6,500 Fixed marketing staff exp. Payroll cost 3,500 Traveling & entertainment exp. 2,000 Fringe benefits 1,000 6,500
195 ii. Given the data above, the break-even point can be determined using total fixed expenses and the CM ratios as follows: 18% Commission 20% Commission Own Sales Force Rs. 000 Sales 150, , ,000 Contribution margin 36,000 33,000 48,000 Contribution margin ratio 24% 22% 32% (Contribution margin / Sales) Fixed expenses 34,000 34,000 43,000 Break-even point in sales (Rs.) 141, , ,375 (Fixed exp. / Contribution margin ratio) B.E. in total Rs. 141,666, ,545, ,375,000 iii. Rupees sales to attain the target profit: Fixed expense 43,000,000 Target profit (1,000,000) CM ratio 32% Rupees sales to attain target profit 131,250,000 (Fixed expense + Target profit) / CM ratio iv. let x = total sales Revenue Net operating income with company s sales force: 0.32 x = Rs. 43,000,000 Net operating income with 20% commission; 0.22 x = Rs. 34,000,000 The two net operating incomes are equal, when: 0.32 x Rs. 43,000,000 = 0.22 x Rs. 34,000, x = Rs. 9,000,000 x = Rs. 9,000,000/0.10 x = Rs. 9,000,000 Thus, at a sales level of Rs. 90,000,000, either plan will yield the same net operating income. This is verified below (in thousand of rupees): 20% Commission Own Sale Force Rs. 000 Sales 90, % 90, % Total variable expenses 70,000 78% 61,200 68% Contribution margin 19,800 22% 28,800 32% Total fixed expenses 34,000 43,000 Net operating income (loss) (14,200) (14,200)
196
197 Question:6 a. Texfab Textiles has received an offer from local Power Generation firm to provide breakdown free power supply for longer term. The equipment and installations of transmission line would cost Rs. 5,000,000. Management believes that the power supply would provide substantial annual reductions in costs, as shown below: Rupees Electricity cost 695,000 Power breakdown cost 555,000 The new power system would require considerable maintenance work to keep it in proper adjustment. The company engineers estimate that maintenance cost would increase by Rs. 16,000 per annum if new system operates. The transmission system needs an overhaul at the end of every 2 years amounting to Rs. 200,000 per overhaul. The contract period would be 10 years with salvage value (of installations) of Rs. 70,000. After 10 years company will be able to purchase a new power generation system from an international supplier amounting to Rs. 30 million. Texfab Textiles requires a rate of return before tax of at least 18% on investment and uses straight-line deprecation method. Required: b. i. Should Texfab Textiles accept the offer or not? Ignore taxation. ii. Should Texfab Textiles accept the offer or not, if taxation rate is 35%? (Support your answers with proper working) Metro has a cost of capital of 10% and is considering a project with the following most likely cash flow: Year Purchase Running cost Revenue 0 (14,500) (5,000) 12, (7,000) 16,000 Required: i. Explain sensitivity analysis ii. Calculate the change in the level of expected costs to attain breakeven
198 Answer:6 (b) (i) Sensitivity Analysis: Sensitivity analysis is method of analyzing the effect of change of any variable in an investment (capital expenditure) appraisal decision enabling to assess the responsiveness of project s NPV with the changes in the variables that are used to calculate the NPV. (ii) Sensitivity of the Project: Year Discount Factor at 10% PV of Cost PV of Running Costs PV of Revenue PV of Net Revenue Flow (14,500) - - (14,500) (4,545) 10,909 6, (5,785) 13,223 7,438 (14,500) (10,331) 24,132 (698) The PV of cost can decrease by Rs. 698 or PV of revenue can increase by Rs. 698 before project breaks even.
199 Question No. 7: Kemia Industries Ltd., has its home office in Lahore with three factories situated at Shaikhupora, Sialkot and Faisalabad. The operations at Sialkot have been unprofitable for a number of years. The leasehold of Sialkot will also expire by the end of current year. In view of the continued losses the management has decided to close down the said factory rather than lease again. The factory's plant and machinery can be sold at a price higher than the written down value and the surplus funds will be sufficient to coverall termination costs. The projected profitability of the factories for the years are as under: Rs. in million Shaikhupor Sialkot Faisalaba Total Sales 6,000 1,500 4,500 d 12,000 Variable costs 3,300 1,125 2,925 7,350 Fixed costs: 2, ,575 4,650 Factory 1, ,250 Selling and admin ,050 Home office expenses Profit and loss 375 (375) The company, however, would like to continue to serve the customers now being served by Sialkot factory, if it could do so economically. Accordingly following proposals were put forward for consideration based on a selling price of Rs. 37,500 per unit: Proposals: (a) (b) Close down Sialkot factory and expand the operations of the Faisalabad factory for which capacity is existed there. This proposal will involve the following changes: Sales revenue of Faisalabad factory will increase by 25%. The factory fixed cost of Faisalabad factory will increase by 10%. Fixed selling and administrative costs of the said factory will increase by 5%. Variable distribution costs of the additional output will increase by Rs.600 per unit. Close down Sialkot factory and expand the operations of the Shaikhupora factory subject to the following changes in the result of Shaikhupora factory: Sales revenue will increase by Rs.1,200 million. Factory fixed costs will increase by 20%. Fixed selling and administrative costs will increase by 10%. Variable distribution costs in respect of the additional units will increase by Rs. 750 per unit.
200 (c) Close down Sialkot factory and enter into a long-term contract with an independent manufacturer to serve the customers of Sialkot factory. The manufacturer will pay the royalty of Rs. 750 per unit to the company. In that event the sales of the area served by the Sialkot factory will fall by 25%. (d) Close down Sialkot factory and discontinue serving the present customers of the area. Required: Required: Evaluate each of the above proposals and advise the management for the action to be taken in the interest of improving profitability of the company.
201 Answer No. 7: Proposal (a) Present Shaikhupo ra Present Faisalab ad Addition al Faisalab ad Total Faisalab ad Rs. in million Group Total Sales units 160, ,000 30, , ,000 Sales 6, , , , , Variable cost 3, , , , Variable distribution cost Contribution Margin 2, , , , Fixed cost: - - Factory 1, , Selling and Admin Home office Share Profit (Loss) Proposal (b) Present Shaikhupo ra OR Present Faisalab ad Addition al Faisalab ad Total Faisalab ad Group Total Sales units 120, ,000 32, , ,000 Sales 4, , , , , Variable cost 2, , , , Variable distribution cost Contribution Margin 1, , , , Fixed cost: - - Factory , , , Selling and Admin , Home office Share Profit (Loss) (24.00) OR Proposal (c) Present Present Group Shaikhupo Faisalab Sialkot Total ra ad Sales units 160, ,000 30, ,000 Sales 6, , * 10, Variable cost 3, , , Variable distribution cost Contribution Margin 2, , , Fixed cost: Factory 1, ,800.00
202 Selling and Admin Home office Share Profit (Loss) (202.50) *Royalty OR
203 Proposal (d) Present Present Shaikhupora Faisalabad Sialkot Group Total Sales units 160, ,000 Sales 6, , ,000 Variable cost 3, , , Variable distribution cost Contribution Margin 2, , , Fixed cost: Factory 1, , Selling and Admin Home office Share Profit (Loss) (225.00) OR Profitability (Rs. in million) Ranked Proposal (a) Proposal (b) Proposal (c) Proposal (d) Present All proposals are more profitable than present situations. However, Proposal (a) is best and give increased revenue of Rs million.
204 CHAPTER 9 Capital Budgeting
205 Capital Budgeting What is capital budgeting? Analysis of potential projects. Long-term decisions; involve large expenditures. Very important to firm s future. Cap Budgeting Evaluation Methods Payback Discounted Payback Net Present Value (NPV) Internal Rate of Return (IRR) Modified Internal Rate of Return (MIRR) Profitability Index (PI) Equivalent Annual Annuity (EAA) Replacement Chain Steps in Capital Budgeting Estimate cash flows (inflows & outflows). Assess risk of cash flows. Determine appropriate discount rate (r = WACC) for project. Evaluate cash flows. (Find NPV or IRR etc.) Make Accept/Reject Decision Capital Budgeting Project Categories 1. Replacement to continue profitable operations 2. Replacement to reduce costs 3. Expansion of existing products or markets 4. Expansion into new products/markets 5. Contraction decisions 6. Safety and/or environmental projects 7. Mergers 8. Other Independent versus Mutually Exclusive Projects Projects are: independent, if the cash flows of one are unaffected by the acceptance of the other. mutually exclusive, if the cash flows of one can be adversely impacted by the acceptance of the other. Normal vs. Nonnormal Cash Flows Normal Cash Flow Project:
206 Cost (negative CF) followed by a series of positive cash inflows. One change of signs. Non normal Cash Flow Project: Two or more changes of signs. Most common: Cost (negative CF), then string of positive CFs, then cost to close project. For example, nuclear power plant or strip mine. The key stages in the capital investment decision-making process are identifying investment opportunities, screening investment proposals, analysing and evaluating investment proposal, approving investment proposals, and implementing, monitoring and reviewing investments. Identifying investment opportunities Investment opportunities or proposals could arise from analysis of strategic choices, analysis of the business environment, research and development, or legal requirements. The key requirement is that investment proposals should support the achievement of organisation objectives. Screening investment proposals In the real world, capital markets are imperfect, so it is usual for companies to be restricted in the amount of finance available for capital investment. Companies therefore need to choose between competing investment proposals and select those with the best strategic fit and the most appropriate use of economic resources. Analysing and evaluating investment proposals Candidate and evaluating investment proposals need to be analysed in depth and evaluated to determine which offer the most attractive opportunities to achieve organisational objectives, for example to increase shareholder wealth. This is the stage where investment appraisal plays a key role, including for example which investment proposals have the highest net present value. Approving investment proposals The most suitable investment proposal are passed to the relevant level of authority for consideration and approval. Very large proposal may require approval by the board of directors, while smaller proposals may be approved at divisional level, and so on. Once approval has been given, implementation can begin. Implementing, monitoring and reviewing investments The time required to implement the investment proposal or project will depend on its size and complexity, and is likely to be several months. Following implementation, the investment project must be monitored to ensure that the expected result are being achieved and the performance is as expected. The whole of the investment decision-making process should also be reviewed in order to facilities organisational learning and to improve future investment decisions.
207 Capital Rationing Capital rationing occurs when a company chooses not to fund all positive NPV projects. The company typically sets an upper limit on the total amount of capital expenditures that it will make in the upcoming year. Reason: Companies want to avoid the direct costs (i.e., flotation costs) and the indirect costs of issuing new capital. Solution: Increase the cost of capital by enough to reflect all of these costs, and then accept all projects that still have a positive NPV with the higher cost of capital. Reason: Companies don t have enough managerial, marketing, or engineering staff to implement all positive NPV projects. Solution: Use linear programming to maximize NPV subject to not exceeding the constraints on staffing. Reason: Companies believe that the project s managers forecast unreasonably high cash flow estimates, so companies filter out the worst projects by limiting the total amount of projects that can be accepted. Solution: Implement a post-audit process and tie the managers compensation to the subsequent performance of the project. The following principles should be applied when identifying cost that are relevant to a period. Relevant cost are future cost: A relevant cost is a future cost arising as a direct consequence of a decision. A cost which has been incurred in the past is therefore, totally irrelevant to any decision that is being made now. Such past cost are called sun cost. In paradise Ltd. Projects, the 1.5 million spend preparing the land for construction is a sunk cost, as is the 2 million down payment to construction firm. These costs should therefore be excluded when calculating the net present value of the project. Relevant costs are cash flows: Only those future cost which are in the form of cash should be included. This is because relevant costing works on the assumption that profit earn cash. Therefore, costs which do not reflect cash spending should be ignored for the purpose decisionmaking. This mean that the depreciation charges of 1.5 million should be ignored in the decision for paradise Ltd. Relevant costs are incremental cost A relevant costs is the increase in costs which results from making a particular decision. Any costs or benefits arising as a result of a past decision should be ignored. Opportunity costs:
208 An opportunity cost is the value of a benefit foregone as a result of choosing a particular course of action. Such a cost will always be a relevant cost. Other non-relevant costs: Certain other cost will be irrelevant to decision-making, such as committed costs. A committed cost is a future cash outflow that will be incurred anyway, regardless of what decision will now be taken. The 3 million restaurant costs represent such committed costs, and these will therefore be ignored for the decision-making process. The interest costs of 2.5 million per annum are also ignored. This is not because they do not meet the above criteria, but because they are taken into account in the discounting process. If these cots were included as relevant they would be double counted. d) Advantages and disadvantage of IRR Advantage includes: 1. It takes into account the time value of money, which is good basis for decision-making. 2. Results are expressed as a simple percentage, and are more easily understood than some other methods. 3. It indicates how sensitive decisions are to a change in interest rates. Disadvantages include: 1. Project with unconventional cash flows can have either negative or multiple IRR. This can be confusing to the user. 2. IRR can be confused with ARR or ROCE, since all methods give answers in percentage terms. Hence, a cash-based method can be confused with a profit-based method. 3. It may give conflicting recommendations to NPV. 4. Some managers are unfamiliar with the IRR were required.. (e) The stages for project appraisal i. Initial investigation of the proposal Firstly, a decision must be made as to whether the project is technically feasible and commercially viable. This involves assessing the risks and deciding whether the project is in line with the company s long-term strategic objectives. ii. Detailed evaluation A detailed investigation will take place in order to examine the projected cash flows of the project. Sensitivity analysis is performed and sources of finance will be considered. iii. Authorisation For significant project authorisation must be sought form the companies seniors management and board of director. This will only take place one such persons are satisfied that are detailed evaluation has been carry out that the project will contribute to profitability and that the project is consistent with the company strategy.
209 iv. Implementation At the stage responsibility for the project is assigned to a Project manager or other responsible person. The resources will be made valuable for implementation and specific target will be set. v. Project monitoring now the project has started, process must be monitored and senior management must be kept informed of process. Cost and benefits may have to be re-assessed in unforeseen events occur. vi. Post-completion audit and the end of the project, an audit will be carry out that lessons can be learned to help future project planning. It is useful for companies that are short of cash and need to recoup initial investment quickly It is sometimes argued to be way of spotting high risk projects, in that projects that need a long time to payback could fail as market conditions change over time. However payback is subject to a number of disadvantages We have no objective way of telling what is an acceptable payback It is a relative measure and it is therefore difficult to make comparisons between projects of different sizes (for example id a two year payback on a 1,000 investment better than a three year payback on a 1,000,000 investment?) It ignores the time value of money, this concept will be explained in the next paragraph. Net present value is generally recognised as the best investment appraisal technique because Like payback it is cash flow based It takes into account the time value of money. Most of us, given the choice, would prefer to receive 1 now rather than 1 in one year s time. This is due to factors such as interest that could be earned on the money, risk associated with future receipts, inflation and our preference for current consumption. Net present value,by applying discount factors to future cash flows. Allows for the time value of money. Payback in it simplest form does not. Net present value is an absolute measure, it tells us the increase in our wealth to be expected from investing in the project because of this comparisons between projects are straightforward. Net present value does however have some disadvantages Like all investment appraisal techniques it is only as good as the cash flow available. It requires a discount rate from which to calculate present values, in practice finding this discount rate can be problematic. It is more difficult for non practitioners to understand. LEASE VS LOAN On balance I believe that net present value is the superior technique and I would recommended it. However there is no reason why we cannot calculate both measure for proposed projects. Please contact me if you wish to discuss this matter further.
210 TYPES OF LEASES OPERATING FINANCING WET lease BALLOON HOW TO CALCULATE THE INSATMENT IS THE FIRST INSALMENT IN ADVANCE? OR IN ARREARS END OF THE YEAR DETERMINATION OF INSALTMENT COST OF ASSET/PVIFA OF YEAR 4 AT AFTER TAX COST OF CAPITAL +1 (when payment is in advance) in case the lease term is 5 years COST OF ASSET/PVIFA OF 5 YEARS( if the payment is in arrears) Net Work Analysis Net work analysis is a generic term for a family of related techniques developed to aid management to plan and control projects. A quantitative technique used in project control. The events and activities making up the whole project are represented in the form of a diagram. Event is presented by a small circle (a node) and an activity by an arrow. PERT(Project Evaluation & Review Technique) A specification of all activities, events and activities and constraints relating to a project, from which a network is drawn, providing a model of the way the project should proceed. Slack / Float Time The time available for an activity over and above that required for its completion. PERT These techniques show inter-relationship of various jobs or tasks which make up the overall project and clearly identify the critical path of the project. They can provide planning and control information on the time, cost and hour aspects of a project large and complex projects. A complete net work should have only one point of entry a start event and only one exit a finish event. Networks proceed from left to right. Dummy activity
211 An activity which does not consume time or resources. It is represented on a network by dotted arrow. Network analysis Introduction Network analysis is the general name given to certain specific techniques which can be used for the planning, management and control of projects. One definition of a project: Project A project is a temporary endeavor undertaken to create a "unique" product or service A project is a series of activities directed to accomplishment of a desired objective. Plan your work first..then work your plan History CPM was developed by Du Pont and the emphasis was on the trade-off between the cost of the project and its overall completion time (e.g. for certain activities it may be possible to decrease their completion times by spending more money - how does this affect the overall completion time of the project?) PERT was developed by the US Navy for the planning and control of the Polaris missile program and the emphasis was on completing the program in the shortest possible time. In addition PERT had the ability to cope with uncertain activity completion times (e.g. for a particular activity the most likely completion time is 4 weeks but it could be anywhere between 3 weeks and 8 weeks). CPM - Critical Path Method Definition: In CPM activities are shown as a network of precedence relationships using activity-on-node network construction o Single estimate of activity time o Deterministic activity times USED IN : Production management - for the jobs of repetitive in nature where the activity time estimates can be predicted with considerable certainty due to the existence of past experience. PERT - Project Evaluation & Review Techniques Definition: In PERT activities are shown as a network of precedence relationships using activity-on-arrow network construction o Multiple time estimates o Probabilistic activity times USED IN : Project management - for non-repetitive jobs (research and development work), where the time and cost estimates tend to be quite uncertain. This technique uses probabilistic time estimates. Benefits of CPM/PERT
212 Useful at many stages of project management Mathematically simple Give critical path and slack time Provide project documentation Useful in monitoring costs Question: 1 PV Co is evaluating an investment proposal to manufacture Product W33, which has performed well in test marketing trials conducted recently by the company s research and development division. The following information relating to this investment proposal has now been prepared. Initial Investment Selling price (current price terms) Expected selling price inflation Variable operating costs (current price terms) Fixed operating costs (current price terms) Expected operating cost inflation Rs. 2 million Rs. 20 per unit 3% per year Rs. 8 per unit Rs. 170,000 per year 4% per year The research and development division has prepared the following demand forecast as a result of its test marketing trials. The forecast reflects expected technological change and its effects on the anticipated life-cycle of Product W33. Year Demand (units) 60,000 70, ,000 45,000
213 Calculation of operating costs Year Inflated variable cost (Rs./unit) Demand (units/year) 60,000 70, ,000 45,000 Variable costs (Rs./year) 499, ,500 1,080, ,200 Fixed costs (Rs./year) 176, , , ,876 Inflated costs (Rs./year) 676, ,372 1,271, ,076 It is expected that all units of Product W33 produced will be sold, in line with the company s policy of keeping no inventory of finished goods. No terminal value or machinery scrap value is expected at the end of four years, when production of Product W33 is planned to end. For investment appraisal purposes, PV Co uses a nominal (money) discount rate of 10% per year and a target return on capital employed of 30% per year. Ignore taxation. Required: (a) Calculate the following values for the investment proposal: (i) net present value; (ii) internal rate of return; (iii) return on capital employed (accounting rate of return) based on average investment; and (iv) discount payback period. (b) Discount your finding in each section of (b) above and advise whether the investment proposal is financially acceptable. Solution: 1 a. (i) Calculate of NPV Year Rs. Rs. Rs. Rs. Investment (2,000,000) Income 1,236,000 1,485,400 2,622,000 Operating costs 676, ,372 1,271,227 Net cash flow 2,000, , ,028 1,350,773 Discount at 10% Present value (2,000,000) 509, ,919 1,014,430 Net present value Rs. 366,722 Workings Calculation of income Year Inflated selling price (Rs./unit) Demand (unit/year) 60,000 70, ,000 Income (Rs./year) 1,236,000 1,485,400 2,622,000
214 (ii) Calculation of internal rate of return Year Rs. Rs. Rs. Rs. Rs. Net cash flow (2,000,000) 560, ,028 1,350, Discount at 20% Present value 2,000, , , , ,365 Net present value (Rs. 79,014) Internal rate of return = 10+((20-10) 366,722)/(366,722+79,014)=10+8.2=18.2% (iii) Calculate of return on capital employed Total cash inflow = 560, , ,350, ,874 = Rs. 2,999,675 Total depreciation and initial investment are same, as there is no scrap value Total account profit = 2,999,675-2,000,000 = Rs. 999,675 Average annaul accounting profit = 999,675/4 = Rs. 249,919 Average investment = 2,000,000/2 = Rs. 1,000,000 Return on capital employed = 100 x 249,919/1,000,000 = 25% Calculate of discount payback Year Rs. Rs. Rs. Rs. Rs. PV of cash flows (2,000,000) 509, ,919 1,014, ,333 Cumulative PV (2,000,000) (1,490,960) (916,041) 98, ,722 Discounted payback period = 2 + (916,041/1,014,430) = = 2.9 years
215 (b) The investment proposal has a positive net present value (NPV) of Rs. 366,722 and is therefore financially acceptable. The result of the other investment appraisal methods do not alter this financial acceptability as NPV decision rule will always offer the correct investment advice. The internal rate of return (IRR) method also recommends accepting the investment proposal since the IRR of 18.02% is greater than the 10% return required by PV Co. if the advise offered by the IRR method differed from that offer by the NPV method, the advise offer by the NPV method would be preferred. The calculated return on capital employed of 25% is less than the target return of 30%, but as indicated earlier, the investment proposal is financially acceptable as it has a positive NPV. The reason why PV Co. has a target return on capital employed of 30% should be investigated. This may be an out-of-date hurdle rate that has not been updated for changed economic circumstance. The discounted payback period of 2.9 year is significant proportion of the forecast life of the investment proposal of four years, a time period which the information provided suggest is limited by technological change. The sensitivity of the investment proposal to changes in demand and life-cycle should be analysed, since an earlier onset of technological obsolescence may have a significant impact on its financial acceptability. Question: 2 Detail of two machines under consideration is: Machine A B Initial Cost Rs. 50,000 Rs. 90,000 Life-years 4 7 Salvage value at the end of Machine A - 4 years Rs Machine B- 7 years 7000 Annual running cost Both machines fulfill the same function and have equal capacities. The appropriate discount rate is 10%. Required: Recommend which machine should be purchased and justify your recommendation. What should be the initial cost of Machine B, to make the both machines of equal financial attractiveness.
216 Solution: 2 One of the machines is necessary, and both machines are assumed to be equally effective at polishing. Such a machine will be required for an indefinite period, which we can assume could exceed the useful lives of either machine. Both machines will presumably have to be replaced at the end of their lives. Therefore it can be assumed that an annual equivalent value or cost is essential to a choice between the two machines. The calculations of the AEVs are as follows Note: Since this example is concerned mainly with costs, outflows are shown as positive, inflows as negative. Machine A Year Cash flows ( ) Disc. Factor PV ( ) 0 50, , , ,700 4 (5,000) (3,415) Cumulative discount factor for years 1 4 = AEV = 78,285/3.170 = 24,696 NPV = 78,285 Machine B Year Cash flows ( ) Disc. Factor PV ( ) 0 90, , , ,944 4 (7,000) (3,591) NPV = 125,353 Cumulative discount factor for years 1 7 = AEV = 125,353/4.868 = 25,750 Summary AEV machine A 24,696
217 AEV machine B 25,750 AEV machine B > machine A: 1,054 Since the AEV of machine A is less than that for machine B by an annual equivalent value of 1,054, machine A should be purchased, if cost is the only factor relevant to the decision. What should the initial cost of machine B be, to make the two machines of equal financial attractiveness? The AEV of machine B would have to decrease (by 1,054) to 24,696. Multiply this by the cumulative discount factor for years 1-7 (i.e.4.868), which gives 120,220. This is 5,133 ( 125, ,220) less than the present NPV. Since the PVs of the running costs and salvage value will not alter, then only the initial cost (discount factor of 1) will alter. Hence the initial cost of machine B will have to decrease by 5,133 to make both machine of equal financial attractiveness. This can be proved by recalculation of the figures for machine B: Year Cash flows ( ) Disc. Factor PV ( ) 0 Revised initial cost 84, , Annual running costs 8, ,944 4 Salvage value (7,000) (3,591) NPV = 120,220 Cumulative discount factor for years 1 7 = AEV = 120,220/4.868 = 24,696 Which is the same as for machine A.
218 Question: 3 A company with a cost of capital 14% is trying to determine the optimal replacement cycle for the computer used by its Research department. The following information is relevant to the decision. The cost of each laptop is Rs Maintenance cost are payable at the and of full each year of ownership, but not in the year of replacement e.g. if the computer owned for 2 years, then maintenance cost is payable at the end of year 1. Interval between Replacement ( years ) Trade in value Rs. Maintenance Cost Rs Zero (payable at end of Y1 ) (payable at end of Y2) Required: 1) Ignoring taxation, calculate equivalent annual cost of the three replacement cycles and recommend which should be adopted? 2) What other factors should the company take into account when determining the optimal cycle.
219 Solution: 3 Replace in 1 year Replace in 2 years Replace in 3 years Year Cash Flow NPV Cash Flow NPV Cash Flow NPV PVIF 14% PVIFA at AEV The computer should be replaced after every three years. Question: 4 Panther plc. Has a cost of capital of 18% per annum. It is the Board policy of expansion from internal resources only and will not have recourse to the market. The retention of profits generated an investment fund of Rs. 2,500,000 and the following projects are under consideration: (Rs. in thousands) Projects A B C D E F G H Life (In years) Required Investment (Rs.) Annual Cash Flow(Rs.) IRR 26% 24% 22% 20% 19% 17% 15% 12% Required: How should the available fund be invested?
220 Solution: 4 Calculation of Net Present Value: Project Life Annual Cash PV Factor PV of Initial NPV Inflow at 18% Cash Inflow Outflow A B C D E F G H Projects F,G and H show a negative NPV and can therefore be rejected straight away as not being worthwhile.
221 Project NPV Initial PI Ranking Outlay A = 18.48% I B = 11.90% II C = 7.82% III D = 3.16% IV E = 2.41% V Projects Initial Cost NPV A C Unused Fund Available fund should be invested in projects A and C to maximize NPV Rs thousand. However, because the problem of indivisibility of fund amounting to Rs. 400,000 remain unused and invested at 18%. A SINGLE IRR WILL RESULT ONLY WHEN THE CASH FLOW FOLLOW THE MORMAL PATTERN OF AN INITIAL OUT-FLOW FOLLOWED BY A SERIES OF INFOLWS OVER THE YEARS. WHERE THE CASH FLOW SIGNS CANGE BETWEEN POSITIVE AND NEGATIVE A NUMBER OF TIMES OVER THE YEARS, IT IS LIKELY THAT A NUMBER OF REAL SOLUTIONS MAY EXIST.
222 IRRS MIRR Assumptions All interim inflows are invested out side At the IRR of the project. Another criticism of IRR is that it cannot cope with variations in the cost of capital over the life the project. To overcome the shortcomings of IRR the MIRR is calculated
223 Question: 5 The Unity Mill is planning the installation of some new looms, a task which will also require various structural alterations to its building. A PERT cost analysis is to be used in controlling the project. The installation task has been subdivided into activities. Three estimates of the likely duration time of each activity have been made. The expected duration time of each activity can be calculated as the weighted average of the three estimates, the weights being one of the optimistic estimate, four for the most likely estimate, and one for the pessimistic estimate. The estimates are: Time estimates (in days) Activity Optimistic Most Likely Pessimistic * * Activity 3 4 is a dummy activity Required Set out the activities as a network and show the critical path, calculating the expected completion time and the slack at each event in the network.
224 Solution: 5 Activity Estimates (in days) Expected time (in days) Time (a) (m) (b) te = a+4m+b a = Optimistic Time m = Most likely Time b = Pessimistic
225 Event Earliest Time (E) Latest Time (L) Slack (L-E)
226
227 CHAPTER 10 RESPONSIBILITY ACCOUNTING
228 RESPONSIBILITY CENTERS RESPONSIBILITY ACCOUNTING A responsibility center is the point in an organization where the control over revenue or expense is located, e.g. division, department or a single machine. A responsibility center may be divided into three categories cost profit investment Introduction of Responsibility Accounting The establishment of responsibility with the help of accounting records is called as Responsibility Accounting. R.A.is a system that concentrates to establishes responsibility of a particular cost center and accumulates cost of it to facility. Pre-requisite of successful Responsibility Accounting Systems are: 1. Support of Management. 2. Support and understanding of supervision i.e. the system must be fully and thoroughly explained. 3. Accurate acceptable data. One should know it and must be consulted in presence of some targets. 4. give them job satisfaction. A progressive management climate. Responsibility is a means of developing and motivating executives and supervisors through self discipline. 5. Classification of management levels, functional divisionalisation and departmentalization. 6. Controllable and uncontrollable costs, variable and fixed costs. 7. Organization chart who is responsible for what to whom he is answerable. 8. Cost and benefit analysis. 9. Social responsibilities. There ways of controlling Business Activities: 1. By establishing administrative control, within a formal organization structure Budgetary Control. 2. By building up a team spirit so that subordinates are motivated as a group. 3. By encouraging the motivation of individuals, through the design of jobs which Benefits of Responsibility Accounting
229 1. Tying-in of accounting records and cost control system helps in controlling costs. 2. Analysis of cost of production and related units of production and services rendered. 3. Using a variable basis of allocating cost to various cost centers. 4. Responsibility Accounting provides a moral check upon the supervisor to be alert for controlling expenses. 5. Managers moral and job satisfaction are higher because of their participation in decision making. 6. Decisions are taken collectively and with mutual understanding at right time. 7. Autonomy of given to managers to let them work independently in the best interest of their department but keeping over all objectives of the company in forefront all the time. Return on Investment Return on investment is the ratio of income to the investment used to generate the income. Net Income ROI Investment Return on Investment Pepsi Company reports the following Net Income $ 30,000 Sales $ 500,000 Investment $ 200,000 Let s calculate ROI. Return on Investment ROI = 6% x 2.5 = 15% Net Income ROI Sales ROI $30,000 $500,000 Sales Investment $500,000 $200,000
230 Improving ROI Pepsi Company s manager was able to increase sales to $600,000 which increased net income to $42,000. There was no change in investment. Let s calculate the new ROI. Improving ROI ROI = 7% x 3 = 21% Net Income ROI Sales ROI $42,000 $600,000 Pepsi Company increased ROI from 15% to 21%. ROI - A Major Drawback Sales Investment $600,000 $200,000 As division manager at Pepsi Company, your compensation package includes a salary plus bonus based on your division s ROI -- the higher your ROI, the bigger your bonus. The company requires an ROI of 20% on all new investments -- your division has been producing an ROI of 30%. You have an opportunity to invest in a new project that will produce an ROI of 25%. As division manager would you invest in this project? Residual Income: Pepsi Company has an opportunity to invest $100,000 in a project that will earn $25,000. Pepsi Company has a 20 percent desired ROI and a 30 percent ROI on existing business. Let s calculate residual income. Profit 25,000 Desired return 20, ,000X.20=20,000 Residual income 5,000,
231 Question #1 Division Y has reported annual operating profits of 40.2 million. This was after charging 6 million for the full cost of launching a new product that is expected to last three years. Division Y has a risk adjusted cost of capital of 11% and is paying interest on a substantial bank loan at 8%. He historical cost of the assets in Division Y, as shown on its balance sheet, is 100 million, and the replacement cost has been estimated at 172 million. Answer: Adjustments needed are: For launch costs spread over 3 years; and Need to use replacement cost of net assets. So EVA = ( 40.2 million + 4 million) ( 172 million ā 11%) = million. Question # 2 A division is considering the purchase of a new machine which costs $1,500,000 and is expected to generate cost savings of $450,000 a year. The asset is expected to have a useful life of five years with no residual value. Depreciation is charged on a straight line basis. Divisional performance is evaluated on Residual Income (RI). The division s cost of capital is 10%. Calculate for this machine for each of the five years: (i) (ii) The Residual Income (RI); The Return on Investment (ROI). Note: When calculating performance measures the division always uses capital values as at the start of the year.
232 Solution # 2: Year 1($) Year 2($) Year 3($) Year 4($) Year 5($) Cost savings 450, , ,000 45, ,000 Depreciation 300, , , , ,000 Profit 150, , , , ,000 Cost of capital 150, ,000 90,000 60,000 30,000 RI Nil 30,000 60,000 90, ,000 ROI 10% 12.50% 16.70% 25% 50% Capital value Solution: Return = 320, , , ,000 = 690,000 Investment = 3 64 million million million = 3 69 million [(690,000 3,690,000) 100] = 18 7% Question # 3 ZP Plc operator two subsidiaries X and Y, X is component manufacturing subsidiary and Y is an assembly and final product subsidiary. Both subsidiaries produce one type of output only. Subsidiary Y needs one component from subsidiary X for every unit of Product W produced. Subsidiary X transfers to Subsidiary Y all of the components needed to produce Product W. Subsidiary X also sell components o the external market. The following budgeted information is available for each subsidiary: X Y Market price per component $800 Market price per unit of W $1,200 Production costs per component $600 Assembly costs per unit of W $400 Non production fixed costs $1-5m $1-3m External demand 10,000 units 12,000 units Capacity 22,000 units Taxation rates 25% 30%
233 The production cost per component is 60% variable. The fixed production costs are absorbed based on budgeted output. X sets a transfer price at marginal cost plus 70%. Calculate the post tax profit generated by each subsidiary. Solution # 3: X Y $ $ Sales 88,000,000 10, 000x $800 7,344,000 12,000 x $612 14,400,000 12,000 x $1,200 Cost 22,000 x $1,012 12,144,000 Fixed Costs Production 22,000 x $240 Non production 1, Profit 644, ,000 Tax 161, ,800 Profit after tax 483, ,200 Question # 4 Division L has reported a net profit after tax of 8.6m for the year ended 30 April Included in the costs used to calculate this profit are the following items: Interest payable of 2.3m; Development costs of 6.3m for a new product that was launched in May 2005, and is expected to have a life of three years; Is expected to have a life of three years; Advertising expenses of 1.6m that relate to the re-launch of a product in June The net assets invested in Division L are 30m. The cost of capital for Division L is 13% per year. Calculate the Economic Value Added for Division L for the year ended 30 April 2006.
234 Solution # 4: m m Net profit after tax 8.6 Add Interest 2.3 Development costs 6.3 Advertising Less 1/3 development costs Less capital charge: 30 * 13% 3.9 EVA 12.8 Question # 5 (i) Briefly explain the main features of Economic Value Added (EVA ) as it would be used to assess the performance of divisions. (ii) Briefly explain how the use of EVA to assess divisional performance might affect the behavior of divisional senior executives. Solution # 5: EVA attempts to modify accounting operating profit to become closer to an economic concept of income. To do this many of the accounting conventions and adjustments are altered, for example: Goodwill will be amortized over its effective life R&D expenditure will be written off over its useful life Depreciation will model the decline in asset values Assets will be valued at current cost not historical cost After this adjusted profit has been calculated, an interest rate charge is deducted to produce the EVA. The interest rate used in EVA is usually complex and it is usually based on the Capital Asset Pricing Model. All the above features require systems to be implemented so that the required data can be produced quickly and with minimum cost. For example, to compute EVA a separate depreciation calculation and separate records of assets are needed. The objective of EVA is to better measure the true economic performance of a division. Solution: It is argued that meeting an EVA target will usually require managers to act in the best interests of the firm. In particular, EVA is said to encourage long term decision making,
235 rather than decisions that maximize short-run profits. EVA proponents argue that it has strong motivational advantages because maximising EVA will maximise shareholder value. Providing incentives for managers and workers to maximise value creation for shareholders has been recognised as a significant problem for decades; this claim for EVA has made it popular. The adjustments that are made to accounting profit to derive EVA are designed to minimize any benefit that managers can obtain by manipulating accounting numbers. So, for example, there would be little gain to short run profit from failing to invest in new machinery, and at least part of the cost of advertising would be deferred until the benefits arose. Some companies set EVA targets and rewards are paid if these targets are reached. The adjustments to operating profit remove some of the accounting choices that can be used to manipulate profit, and so EVA provides an incentive to produce more shareholder value. Question # 6 Y and Z are two divisions of a large company that operate in similar markets. The divisions are treated as investment centres and every month they each prepare an operating statement to be submitted to the parent company. Operating statements for these two divisions for October are shown below: Operating Statements for October Y 000 Z 000 Sales revenue Less variable costs Contribution Less controllable fixed costs (includes depreciation on divisional assets) Controllable income Less apportioned central costs Net income before tax Total divisional net assets 9 76m 1 26m The company currently has a target return on capital of 12% per annum. However, the company believes its cost of capital is likely to rise and is considering increasing the target
236 return on capital. At present the performance of each division and the divisional management are assessed primarily on the basis of Return on Investment (ROI). Required: a. Calculate the annualised Return on Investment (ROI) for divisions Y and Z, and discuss the relative performance of the two divisions using the ROI data and other information given above. Calculate the annualised Residual Income (RI) for divisions Y and Z, and explain the implications of this information for the evaluation of the divisions performance. Briefly discuss the strengths and weaknesses of ROI and RI as methods of assessing the performance of divisions. Explain two further methods of assessment of divisional performance that could be used in addition to ROI or RI. ROI Y Z m m Monthly net income Annualised net income Divisional net assets ROI 15% 20% The following comments can be made regarding the relative performance of the two divisions: On pure ROI division Z is performing better than division Y; Division Y is earning a larger absolute amount by more than five times, and is exceeding the target return on capital, thus Y is increasing the wealth of the company more than Z, but this is not reflected in the ROI figures; The availability of capital and other projects are critical to the assessment of relative performance. If there is (virtually) unlimited availability of capital then any division earning more than the target rate of return is increasing the company s wealth and both divisions are making a positive contribution. If division Z could repeat its performance by adding similar projects, then it should be allocated more funds as its rate of return is higher; If there is a chance that the target rate of return will have to be raised, then division Y is at greater risk as its actual return is much closer to the current target; Controllable income return on sales is 51% (460 / 900) for division Y and 36% (201/555) for division Z. This indicates that the operations of division Y are producing income at a higher rate per of sales than division Z; The controllable income return on net assets is 57% for division Y and 191% for division Z. Thus division Z is earning its income with much less use of divisional net assets it could be argued that it is being more efficient;
237 b. The net income figures are being strongly influenced by the apportionment of central costs. More needs to be known about the basis of the apportionment before a more definite evaluation can be made. RI Y Z m m Annualised net income Interest charge at 12% of Divisional Net Assets Residual Income The following points could be made regarding the performance of the two divisions in the light of the RI calculations: c. If capital is freely available then the higher RI indicates the division that is contributing most to the company as a whole. Thus division Y is contributing more. This is the opposite conclusion to that indicated by ROI; The comments above concerning availability of capital and projects also apply; Overall the issue is that Y earns more income, but Z earns its income at a better rate. Strengths and weaknesses of ROI and RI can include: ROI gives a percentage result that is often considered to have intuitive appeal; ROI as a percentage is said to make comparison easier; ROI does not require a cost of capital to be specified; ROI has significant behavioral consequences that appear to make optimal decision making less likely; Maximizing RI leads to maximizing company wealth in most cases; Both ROI and RI can be affected by the age of assets and the method of asset valuation, resulting in a similar performance by two companies showing different values for ROI and RI if the assets are valued on a different basis. Different interest rates can be used in the calculation of RI for each division, to reflect the different risk characteristics of each division. Other methods of assessment that could be used alongside either ROI or RI include: Economic Value Added which is an adaption of RI; Balanced scorecards and other non-financial measures of divisional performance; Controllable profit, or other pure profit measures; Cash generated.
238 Question #7 (a) For each division suggest, with reasons, the behavioural consequences that might arise as a result of the current policy for the structure and performance evaluation of the divisions. (b) The senior management of C plc has requested a review of the cost-plus transfer pricing policy that is currently used. Suggest with reasons, an appropriate transfer pricing policy that could be used for transfers from PD to TD, indicating any problems that may arise as a consequence of the policy you suggest. Answer # 7(a) The senior management of C plc states that the three divisions should see themselves as independent businesses as far as possible. However, the primary issue is that they are highly related and dependent on each other. The WD sells approximately two-thirds of its output to the PD. Thus the profits of WD and PD depend crucially on the cost-plus transfer price. Further, with only one third of output being sold to external customers, these internal transfers will significantly affect the ROI measure that is used to assess performance. This may lead to a variety of behavioural problems, including: Attempts to manipulate internal pricing procedures, particularly by increasing costs; Attempts to manipulate internal pricing procedures, particularly by increasing costs; Lack of effort and incentive to control costs; Lack of effort in selling to external customers as the consequences may be small in relation to internal transfers; Short-term decisions may be made at the expense of long run profits. PD must sell all its output to the TD and buy all its timber from WD. Thus the problems mentioned for WD apply even more so to PD. It has little control over its business activities and thus cannot really be considered an independent business. The additional behavioural consequences for PD include: The major emphasis for PD should be quality and technical efficiency. Control through ROI is likely to divert attention away from this at best, and at worst may conflict with this aim. For example not replacing machinery because it would worsen ROI. PD needs to work very closely with WD and TD and being structured as a separate profit centre may inhibit this (maybe a cost centre would be more appropriate?) TD sells to the final market, and thus its sales revenue is not unduly affected by the structure of C. Its major costs are determined by internal transfers, so its ROI is not a good measure of performance, just as for the other two divisions. Other behavioural consequences include:
239 Problems with motivation if the transfer costs from PD mean that overall profit and ROI is low. Frustration if the management of TD believes it could substantially increase sales and ROI by having a wider product range. Question # 8 The annual operating statement for a company is shown below: 000 Sales revenue 800 Less variable costs 390 Contribution 410 Less fixed costs 90 Less depreciation 20 Net income 300 Assets 6.75m The cost of capital is 13% per annum. Solution # 8 The return on investment (ROI) for the company is closest to A 4 44% B 4 74% C 5 77% D 6 07% Solution: ROI 300,000 / 6,750,000 x 100 = 4 44% Question # 9 A company has reported annual operating profits for the year of 89 2m after charging 9 6m for the full development costs of a new product that is expected to last for the current year and two further years. The cost of capital is 13% per annum. The balance sheet for the company shows fixed assets with a historical cost of 120m. A note to the balance sheet estimates that the replacement cost of these fixed assets at the beginning of the year is 168m. The assets have been depreciated at 20% per year. The company has a working capital of 27 2m. Ignore the effects of taxation. The Economic Value Added (EVA) of the company is closest to
240 A 64 16m B 70 56m C 83 36m D m Solution # 9: m Profit Add Current depreciation (120 x 20%) Development costs (9 60 x 2/3) 6.40 Less Replacement depreciation (168 x 20%) Adjusted profit Less cost of capital charge (Working 1) EVA Working 1 Cost of capital charge Fixed assets ( ) 27.2 Working capital 6.4 Development costs x 13% = Question # 10 (Calculate Weighted Average Cost of Capital for EVA) Golden Gate construction Associates, a real estate developer and building contractor is San Francisco, has two sources of long-term capital: debt and equity. The cost to Golden Gate of issuing debt is the after-tax cost of the interest payments on the debt, taking into account the fact that the interest payments are tax deductible. The cost of Golden Gate s equity capital is the investment opportunity rate of Golden Gate s investors, that is, the rate they could earn on investments of similar risk to that of investing in Golden Gate Construction Associates The interest rate on Golden Gate s $60 million of long-term debt is 10 percent, and the company s tax rate is 40 percent. The cost of Golden Gate s equity capital is 15 percent. Moreover, the market value (and book value) of Golden Gate s equity is $90 million.
241 Required: Calculate Golden Gate Construction Associates weighted-average cost of capital Answer 10 OR Question # 11 WACC = ((60*(10%(1-0.4)) + 90*15%) / (60+90))*100 WACC = 11.40% Weight Cost WACC Debt 60 40% 6% 2.40% Equity 90 60% 15% 9.00% % (Economic Value Added (EVA); Continuation of Preceding Exercise) Refer to the data in the preceding exercise for Golden Gate Construction Associates. The company has two divisions: the real estate division and the construction division. The division s total assets, current liabilities, and before-tax operating income for the most recent year are as follows: Division Total Assets Current Liabilities Before-tax Operating Income ($) Real estate 100,000,000 6,000,000 20,000,000 Construction 60,000,000 4,000,000 18,000,000 Required: Calculate the economic value added (EVA) for each of Golden Gate Construction Associates divisions. Answer: 11 EVA = After tax operating income - [(Total assets - Current liabilities)*wacc] Real Estate Construction Profit before tax 20,000,000 18,000,000 Tax (40%) (8,000,000) (7,200,000) Profit after tax (a) $12,000,000 $10,800,000 Net assets 94,000,000 56,000,000
242 (100,000,000-6,000,000) (60,000,000-4,000,000) WACC 11.40% Expected return (b) $10,716,000 $6,384,000 EVA (a - b) $1,284,000 $4,416,000 Question # 12 (Improving ROI) The following data pertain to British Isles Aggregates Company, a producer of sand, gravel, and cement, for the year just ended. Sales revenue 2,000,000 Cost of goods sold 1,100,000 Operating expenses 800,000 Average invested capital 1,000,000 denotes the British Pound Sterling, the national monetary unit of Required: Compute the company s sales margin, capital turnover, and ROI. If the sales and average invested capital remain the same during the next year, to what level would total expenses have to be reduced in order to improve the firm s ROI to 15 percent? Assume expenses are reduced, as calculated in requirement (2). Compute the firm s new sales margin. Show how the new sales margin and the old capital turnover together result in a new ROI of 15 percent. Answer: 12 (1). Sales margin = (Income/ Sales revenue) *100 Sales margin = (100000/ )*100 Sales margin = 5% Capital turnover = Sales revenue/ Average invested capital Capital turnover = / Capital turnover = 2 times
243 Return On Investment= (Income/ Average invested capital) *100 Return On Investment= (100000/ )*100 Return On Investment= 10% Return On Investment= Sales margin* Capital turnover Return On Investment= 5% * 2 Return On Investment= 10% Working: Sales revenue $2,000,000 Less: COGS (1,100,000) Gross Profit 900,000 Less: Operating exp. (800,000) Net Income $100,000 (2). Desired return on capital invested is 15%, i.e. 1,000,000*15% = 150,000 Therefore, the Net Income should be amounting 150,000, if sales remain the same. Sales revenue $2,000,000 Less: COGS (1,100,000) Gross Profit 900,000 Less: Operating exp. (750,000) Net Income $150,000 The operating expenses are to be reduced by 800, ,000 = $50,000 Working: Gross profit - Operating exp. = Net income
244 i.e. Operating exp. = Gross Profit - Net income Operating exp. = Operating exp. = $750,000 (3). New sales margin = (New Income/ Sales revenue) *100 New sales margin = (150000/ )*100 New sales margin = 7.5% ROI = New sales margin*old capital turnover ROI = 7.5% * 2 ROI = 15% Note: If Sales and Capital Invested remaining the same, the Capital Turnover will also remain the same Economic Value Added EVA The principle objective of financial management is to maximize shareholders wealth. This raises two questions: How can we measure whether shareholders value is being created or destroyed? Which performance appraisal targets ensure that managers act in such a way as to generate shareholders value? Cash is Preferable to Profit: Cash flows have a higher correlation with shareholders wealth than profit. Exceeding the Cost of Capital: The return must be sufficient to cover not the cost of debt but also the cost of equity. Managing both Long & Short-term Perspective: Investors are increasingly looking at long-term value. When valuing a company s shares, the stock market places a value on the Company s future potential, not just the current profit level. ALTERNATES To survive in today s corporate world the imperative for the companies to create value for all stakeholders, not least of which is the shareholder The concept of economic profit, of which one of the best known variant is the economic value added Economic Profit recognizes that the one major cost that the conventional profit & loss account does not take into account is the cost of capital used in generating profit
245 Economic Profit = NOPAT (Invested capital x Cost of Capital) EP = Rs. 1m (Rs. 10m x 5%) = Rs. 0.5m Alternate Approach 1: Discounted Cash Flow (DCF) & Net Present Value (NPV) Most of us will be familiar with the NPV approach to project appraisal. This method involves the following steps: 1) Determine the relevant, incremental cash flows for the project 2) Discount the cash flows using an appropriate rate that reflects the risk of the project 3) Accept the project if the NPV > 0 Alternate Approach 2: Shareholder Value Analysis (SVA) The SVA approach described by Alfred Rappaport, is a variation of the DCF methodology in that it values the whole enterprise not just individual projects. Central to the approach are seven value drivers; Sales growth Operating Profit Margin tax rate Incremental working capital investment (IWCI) Fixed Capital Investment to support current activity level (replacement fixed capital investment (RFCI) to support future growth incremental fixed capital investment (IFCI)) Cost of Capital Competitive advantage period OR value growth duration during which the firm is expected to generate superior returns in excess of its cost of capital The SVA Method involves the following step: Estimate the free cash flows within the advantage period by reference to the value drivers Discount these cash flows using either a company-wise weighted average cost of capital (WACC) or separate business unit discount rates Add to the result the present value of the firm at the end of the forecast period This is known as the residual value, and is usually calculated by discounting simplified cash flows ( e.g Zero or constant growth) beyond the competitive advantage period Add the market value of non -trade or non- operational assets to the result to get the corporate value that belongs to all investor The value of Equity is then determined by deducting the value of debt Question 13:
246 You have been asked to value a potential acquisition. The following info regarding the target is available : Current sales Rs 10 Million per annum Competitive advantage period 5 years Value driver information Year Beyond Sales Growth (%) Operating Profit Margin (%) tax Rate (%) IFCI (%) IWCI (%) Cost of Capital (%) Depreciation - Rs. 5m pa Market value of short-term investments is Rs.10m Market value of debt is Rs.15m Operating Capital Rs.3m Value the business using SVA Note: IFCI & IWCI are given as percentages of the moment in sales from the period of the next Answer: 13 Rs. In Million onwards Sales Operating Profit Tax (0.65) (0.68) (0.62) (0.58) (0.49) (0.41) Profit after tax Depreciation Operating cash flow RFCI (Note) (5) (5) (5) (5) (5) (5)
247 IFCI (0.02) (0.02) (0.04) (0.03) (0.01) 0 IWCI (0.08) (0.05) (0.09) (0.06) (0.03) 0 Free Cash flows Discount factor 14% PV PV of free CFs Within the Competitive advantage period PV of residual value Plus: MV of non trade investments Corporate Value Less MV of Debt MV of equity 4.61 million 3.60 million million million million 3.21 million (W) DF = X 1/0.14 = Note: without further details, RFCI is often equated to the annual depreciation charge Alternate Approach 3: Economic Value Added (EVA TM ) EVA TM is the residual income that remains after net operating profit after tax (NOPAT) has been reduced by additional charge, this charge is based on the return investors can be expected to require, given the amount of the capital they have tied up in the business. Note that interest charges are not deducted to arrive at NOPAT, as financing costs are incorporated into the capital charge. Therefore we have: EVA TM = NOPAT Capital Charge = NOPAT (Capital Charge x Cost of Capital) It is therefore =very clear if profits are sufficient to cover the cost of capital. This link can be made more explicit by rewriting EVA TM, using the spread method as: EVA TM = (ROI Cost of Capital) x Capital, where ROI = NOPAT/capital Example 2: Using the same information as in Example 1, calculate the EVA TM for each year
248 Solution: In this example, a more complex calculation must be made to obtain the capital figure as depreciation must be deducted from the running total, and any further investment (IWCL, RFCI, IFCI) added: Rs. In Million onwards Capital b/f RFCI Depreciation (5) (5) (5) (5) (5) (5) IFCI IWCI Capital c/f The profit after tax figures obtained in Example 1 can then be used to calculate the EVA TM Profit after Tax Cost of Capital (0.42) (0.43) (0.44) (0.46) (0.47) (0.48) EVA TM NOTE: Cost of Capital has been calculated using the capital B/F figures making the cost of capital so visible to managers should result in being more careful when choosing to invest further funds, and exercising greater control over working capital investment Proponents of EVA TM argue that it also supports the NPV approach investment appraisal. To see this, the Present Value of future EVA TM figures can be calculated, given the market value added (MVA) to the business. To calculate the value of Equity, this needs to be added to the opening capital and then adjustments made for non trade assets and debt, as for SVA. Question 14: Using the EVA TM figures calculated in Question13, calculate the market value of equity for the acquisition: Solution:14 EVA TM Discount Factor (at 14%) PV Rs. m
249 MVA 5.22 Plus: Operating Capital 3.00 Plus: MV of investments Less: MV of debt (15.00) MV of Equity 3.22 (same as SVA approach, subject to rounding) Economic Value Added The main problem with EVA TM, however, is danger that managers with short-term horizon will reject activities that have negative EVA TM in the first year, even though these activities will deliver positive MVA over the longer term. The adjustments to capital described below, such as capitalizing research expenditure, should reduce such behavior cannot not eliminate it completely. The most common adjustments include: Replacing conventional depreciation with an estimate of the economic depreciation. Economic depreciation measures true fall in the value of the assets each year through wear & tear obsolescence. Although depreciation would not normally be charged in calculating discounted cash-flow, in this case economic depreciation must be recovered from a company s cash flow. Reversing out advertising costs from NOPAT and adding them to the capital figure instead. This is seen because advertising is seen as market-building investment. A small charge of advertising may remain in the profit & loss account to reflect the economic depreciation of the capitalized value In a similar way, research & development costs may be transferred from being expenses to becoming part of capital Adjusting the tax charge to exclude the tax relief on interest payments made Alternate Approach 4: Cash-flow Return on Investment (CFROI) Cash-flow return on investment (CFROI) is a product of Boston Consulting Group (BCG) and HOLT Value Associated. CFROI is the long-term internal rate of return of the firm, defined in a similar way to the more familiar IRR. The matter has the following steps: 1. Convert profitability data into inflation-adjusted gross cash-flows available to all capital owners of the firm. The approach works with real cash-flow rather than nominal flows, hence the need for inflation adjustments. 2. Calculate the implied investment based on real gross assets, again inflation-adjusted where necessary. Intangibles, such as goodwill, are normally excluded here.
250 3. Calculate the finite economic life of depreciating assets and the residual value of non-depreciating assets, such as land and working capital. 4. BCG then calculates CFROI as the internal rate of return that equates the present value of the future cash-flows with the estimate of the current value of gross investment. Conclusions: Shareholders value is a constant priority in many board rooms. The need for a wealth metric and a performance metric has generated a range of solutions, but with mixed success. Ultimately users choose the method best suit to their solution. CFROI is growing in use by potential investors, SVA is often chosen for corporate planning decision, but EVA TM appears to offer the simplest and most consistent overall solution.
251 Question # 1 TRANSFER PRICING Explain briefly what is meant by Transfer price and how it is fixed. Solution # 1: Cost Based Transfer Price: The simplest form of transfer price calculation is a cost based one, where the Transfer Pricing is simply taken to be the cost to the transferor. A transfer pricing based purely on cost is the only appropriate whenever profit responsibility is centralized and each division is operated on a cost-centre basis. It would be not appropriate to a profit-centre structure because the cost which is used as the transfer pricing will not contain any element of profit into cost figure. It is, of course, possible to adapt the technique for profit centres by incorporating an element of profit into cost figure. This profit element could be a lump sum per unit or it could be a percentage of cost in order to provide a contribution towards fixed costs and profit. Actual Cost: Sending goods and services to other divisions at actual cost incurred by the producing division. The use of actual cost insulates the transferor from any production inefficiencies by passing them on to the transferee. The inefficiencies of the transferor then become a cost to the transferee and the transferor is still guaranteed his profit margin. In fact, where the margin added to the actual cost for transfer pricing purposes is a percentage of the cost, the transferor is actually encouraged to become less efficient and increase his production cost and so his contribution. Standard Cost: A more widely used basis for the calculation of transfer prices is the standard cost of production. As with the use of actual cost, the standard cost data is available but this method is superior that it does not suffer from many of the disadvantages experienced under the actual cost method. The use of standard cost for pricing transfers ensures that the transferor is not able to pass on any production inefficiencies to the transferee. He is thus encouraged to improve his efficiency, as any benefits resulting from such an improvement will be affected by any inefficiency. It also means that any under utilization of the capacity by the transferor will affect his own performance assessment and not that of the transferee as before. Market Price Based Transfers: Some Transfer Pricing system adopts the external market price as being the transfer price. This policy is well suited to profit centre structure but it does not require a readily
252 accessible external market to exist for each item being transferred. The transfer pricing is set by external market forces. Which means that accounting profit is a comparatively fair representation of division performance and that meaningful comparison of divisional results with those of external companies can be made? Dual Pricing Techniques This is a technique used mainly in America, whereby the transacting divisions adopt different prices for the same transaction. For example, the transferor may be credited with the external market price for all transactions with the other divisions but the transferee may only be charge with the marginal cost of production of the goods. This is, of course an internal mechanism only and the prices which are adopted for each party are still subject to any previous comments made about each type of transfer Pricing system.. the technique has one major advantage on single-price systems. It enables the organization to achieve goal congruence more easily by setting prices individually for both parties, so motivating them both to act in best interests of the organization and at the same time to charge prices which will be competitive for each unit and so enable fair performance assessment. Negotiating transfer pricing: In this type of transfer pricing system the transfer price is determined solely as a result of negotiation between the divisional mangers concerned. Very often they will adopt one of the previous techniques as a base and negotiate the actual transfer price from this starting point.
253 Question: 2 Regins Engineering Company produces Thermostat Switches in its production facilities located at Landhi and Korangi. Landhi Division assembles the unit for which guage is manufactured by the Korangi Division. Landhi Division has the capacity to produce 350,000 units per year. It can sell 100,000 units in the open market at Rs. 450 each or 150,000 Rs Korangi Division has regular customer for 200,000 units who are ready to pay Rs. 900 per unit. With extra efforts it can sell 250,000 units at Rs Landhi Division s variable cost is Rs. 350 per unit and Korangi s Rs. 200 per unit excluding the transfer price which the Landhi Division Manger wants to charge at Rs. 450 whereas the Korangi division manager is ready to pay Rs Required: Advise management in fixing the inter-division transfer price and determining the volume to be produced and sold by the two divisions to achieve maximum profit for the Company. Answer: 2 Landi Division s profitability at different transfer prices and operating levels: Transfer Price = Rs.450 Transfer Price = Rs. 350 Sales in units 200, , , ,000 Sales Revenue (Rs. `000`) 90, ,500 70,000 87,500 Variable Rs. 35/unit) 70,000 87,500 70,000 87,500 Contribution Margin 20,000 25,000 Korangi Division s profitability at different transfer prices and operating levels.
254 Transfer Price = Rs.450 Transfer Price = Rs. 350 Sales in units 200, , , ,000 Sales Revenue (Rs. `000`) Variable Cost: 180, , , ,500 Transferred from Landhi Div. 90, ,500 70,000 87,500 Korangi Div s Cost 40,000 50,000 40,000 50,000 Contribution Margin 50,000 50,000 70,000 75,000 Total Contribution Margin 70,000 75,000 70,000 75,000 Recommendations: a. Volume to be produced and sold should be 250,000 units as it provides higher contribution margin. b. The transfer price should be Rs. 450/ units as it will satisfy Landhi Division s manager without effecting overall contribution margin of the company. Question # 3 WX has two divisions, Y and Z. The following budgeted information is available. Division Y manufactures motors and budgets to transfer 60,000 motors to Division Z and to sell 40,000 motors to external customers. Division Z assembles food mixers and uses one motor for each food mixer produced. The standard cost information per motor for Division Y is as follows: Direct materials 70 Direct labour 20 Variable production overhead 10 Fixed production overhead 40 Fixed selling and administration overhead 10 Total standard cost 150 In order to set the external selling price the company uses a 33 33% mark up on total standard cost. (i) Calculate the budgeted profit/(loss) for Division Y if the transfer price is set at marginal cost.
255 (ii) Calculate the budgeted profit/(loss) for Division Y if the transfer price is set at the total production cost. Solution # 3: (i) Budgeted loss marginal cost transfer price Sales 000 Internal 60,000 x 100 6,000 External 40,000 x ( 150 x 8, ) 14,000 Variable cost 100,000 x ,000 Contribution 4,000 Fixed costs Production 100,000 x 40 4,000 Administration 100,000 x 10 1,000 Loss (1,000) Solution: (ii) Budgeted profit absorption cost transfer price Sales 000 Internal 60,000 x 140 8,400 External 40,000 x ( 150 x ) 8,000 16,400 Variable cost 100,000 x ,000 Contribution 6,400 Fixed costs Production 100,000 x 40 4,000 Administration 100,000 x 10 1,000 profit 1,400 Question # 4 Division P produces plastic mouldings, all of which are used as components by Division Q. The cost schedule for one type of moulding item 103 is shown below. Direct material cost per unit 3 00 Direct labour cost per unit 4 00 Variable overhead cost per unit 2 00
256 Fixed production overhead costs each year 120,000 Annual demand from Division Q is expected to 20,000 units be Two methods of transfer pricing are being considered: (i) Full production cost plus 40% (ii) A two-part tariff with a fixed fee of 200,000 each year Calculate transfer price per unit of item 103 transferred to Division Q using both of the transfer pricing methods listed above. Variable cost 9 Fixed cost = 120,000/20,000= 6 Full cost 15 puls 40% 6 Total cost plus 21 Two-part tariff requires only variable cost of 9 for additional transfers Question 3 The DIN group has two divisions, X and Y. Each division produces only one type of product: X produce a component(c) and Y produces a finished product (FP).Each FP needs one C. it is the Current policy of the group for C to be transferred to Division Y at the marginal cost of 10 per component and that Y must buy all the components it need from X. The markets for the component and the finished product are competitive and price sensitive. Component C is produced by many other companies but it is thought that the external demand for the next year could increase to 1,000 units more than the volume shows in the current budget for Division X. Budgeted data, taken from the DIN Group internal information System, for the divisions for the next year is as follows: Division X (3,000 of which are transferred to Division Y) (Only 2,000 of which can be currently satisfies) Income Statement Sales 70,000 Cost of sales Variable costs 50,000 Contribution 20,000 Fixed costs (controllable) 15,000
257 Profit 5,000 Production/Sales (units) 5,000 External demand (units) 3,000 Capacity (units) 5,000 External market price per unit 20 Balance sheet extract Capital employed 60,000 Other information Cost of capital charge 10% Division Y Income Statement Sales 270,000 Cost of sales Variable costs 114,000 Contribution 156,000 Fixed costs (controllable) 100,000 Profit 56,000 Production/Sales (units) 3,000 Capacity (units) 7,000 Market price per unit 90 Balance sheet extract Capital employed 60,000 Other information Cost of capital charge 10% Four Measure are used to evaluate the performance of the division managers. Based on the data above: the budgeted performance measures for the two divisions are as follows: Division X Division Y Residual income ( 1,000) 45,000 Return on capital employed 8.33% 50.91% Operating profit margin 7.14% 20.74% Asset turnover 1.17% 2.46 Current policy: It is the current policy of the group C to the transfer to division Y at the marginal cost of 10 per component and that Y. Must by all the components that it needs form X. Proposed Policy:
258 DIN group is thinking of giving the divisional managers the freedom to set their on transfer price and to buy the components from external suppliers but there are concern about problems that could arise by granting such autonomy. Required: (a) (b) If the price of the components is set by the manager of division X at the current market price ( 20 per component), recalculate the budgeted performance measure for each division. Discuss the changes to the performance measures of the division that would arise as are result of altering the transfer price to per components. (c) (i) Explain the problem that could arise for each of division mangers and for DIN Group as whole as a result of giving full autonomy to the division managers. (ii) Discuss how the problem you have explained could be resolved without resorting to the policy of imposed transfer prices.
259 Solution: 4 a. Income Statements Division X Division Y Sales 100, ,000 Variable costs 50, ,000 Contribution 50, ,000 Fixed costs 15, ,000 Profit 35,000 26,000 Profit 35,000 26,000 Less cost of capital charge 6,000 11,000 Residual income 29,000 15,000 Return on capital employed 58.33% 23.64% Operating profit margin 35.00% 9.63% Asset turnover b. Division X Division X Division Y Division Y Current Current Transfer Transfer Transfer Transfer Price Transfer price is Price is is Market price is Marginal Market Price Marginal cost cost Price Residual Income - 1,000 29,000 45,000 15,000 Return on capital employed 8.33% 58.33% 50.91% 23.64% Operating Profit Margin 7.14% 35.00% 20.74% 9.63% Asset Turnover The residual income for division X has increase by 30k and for division Y it has decrease by 30k. This is due to the transfer Price being the set at the market price. Division X s revenue has increase by 10 per component transferred (3,000 transferred - 30,000) and division Y s marginal cost has increased by 10 per computer received (3,000received- 30,000). The ROCE for Division X has increased to 58.33%. That is; by seven times as the operating profit has increased seven fold ( 5k to 35k). Division Y s ROCE has decreased from 50.91% to23.64%, that is, by approximately 54% because profit has reduced by54% that is from 56k to 26k. The operating profit margin for Division X has incased by approximately 43%.For Division Y the operating profit margin has decreased by approximately 54% due ton profit decreasing by approximately 54% and the sales remaining the same.
260 The asset turnover ratio for Division X has increased to 1.67 due to an extra 30k sales being generated in relation to the same capital employed.whereas for Division Y, the asset turnover ratio has remained unchanged as there has been n change to the turnover generated in relation to the capital employed. Therefore in all the above cases Division X s performance has improved whereas Division Y performance has deteriorated with the exception of the asset turnover ratio which remains unchanged. The manger of Division X ill be happy to set a transfer price equal to market price Division Y will not willing to pay the market price due to the impact on performance. Division Y will either wish to negotiate a lower transfer price or alternatively source the component externally at perhaps a more competitive price. If DIN Group relaxes the imposed transfer pricing system and the divisional managers of X and Y negotiate the transfer price equal to the market price and the manager of Division Y will wish to retain the current transfer price equal to marginal cost, due to the impact on the performance ratios. This will mean that Division Y will either need to negotiate a lower transfer price with Division X or alternatively source the component externally at perhaps a more competitive price. If the managers of Division X and Division Y negotiate a transfer price it should be acceptable to both divisions since both managers have been responsible for the negotiations. However, there are disadvantages to the use of negotiated transfer price: The negotiations may be protracted and time consuming; The managers may find it impossible to reach agreement and then central autonomy to divisions; The managers may not be negotiating from an equal basis, that is, one may be more experienced than another an achieve a better result. This could lead to poor motivation and behavioural problems. If negotiations fail and DIN Group do not intervene then Division Y may source the component externally. If the components are sourced externally this will result in spare capacity of 2,000 components for Division X as there is only an external market for an additional 1,000 components. Assuming Division X s fixed costs remain constant and they cannot use the spare capacity to generate further profits for the group then this will have a negative impact on the overall profit for the DIN Group. (c) One of the main problems identified in C(i) is that Division X will want to set a transfer price equal to the market place and that the manager of Division Y will wish to retain the current transfer price equal to marginal cost, due to the impact on performance ratios. A recommended resolution to the problem could be a two-part tariff or dual pricing transfer pricing system. A two-part tariff works where the transfer is at marginal cost and a fixed fee is credited to Division X to compensate them for the lost additional contribution and the subsequence reduction in the performance ratios. Alternatively a dual pricing system could be used where the transfer is recorded in Division Y at marginal cost and in
261 Division X at market price and the discrepancy between the two prices is recorded in an autonomous and DIN Group to protect group profits. The Group could continue to measure performance based on the four key ratios and still motivate the divisional managers to improve their performance. The other issues identified when managers are negotiating a transfer price, that is, negotiating becoming protected and time consuming, difficulty in reaching an agreement and the possibility that one manager may be more skilled than another in such negotiating, could be overcome by head office appointing an arbitrator to assists the managers in arriving at a fair transfer price. If the divisional mangers fail to negotiate a transfer price then central management will have to intervene to avoid a reduction in group profit if Division Y sources the component externally. Aims of transfer price; Promote goal congruence Motivates managers Facilitates performance evaluation Retain divisional autonomy Ensure optimal allocation of resources PRICING DECISIONS OBJECTIVES The following factors to be considered while pricing the goods and services. 1. To understand the factors which may be considered in pricing? 2. To know the theoretical economic background to pricing. 3. To be able to use different calculations to find the optimal pricing. 4. To understand the limitations of classical theory. 5. To be able to use cost-plus pricing. 6. To know the differences between full cost pricing, rate of marginal pricing. Internal and External Pricing A firm may be concerned with two types of pricing decisions. Those for sales external to the firm, i.e. to its customers and those relating to prices used for internal transfers between division and department of the same organizations. The Pricing Problem
262 The pricing problem is a complex one with numerous, interacting factors and no simplistic solution. Typical of the factors which may need to be considered explicitly or implicitly in a pricing decision are the following: The firm s objective (s) Is the firm profit or revenue maximized or is it pursuing satisfying objectives? The market in which the firm operates Perfect or imperfect competition or oligopolistic or monopolistic conditions? The demand for the firm s product Are the quantities known which are expected to be sold at various prices? The elasticity of demand for the product Is the demand elastic or inelastic? The cost structure of the firm and the products What are the expected future marginal costs, fixed costs? The competition What is the extent and nature of the competition? The product What is the stage in the product life cycle? The relative position of the firm Is the firm dominant enough to be a price maker or is it a price taker? Level of activity Will the firm be working at full or below capacity? What is the position of competitors? Government restrictions or legislation Are there regulations or laws government prices? Inflation Is inflation rising, falling, high, and low? The availability of substitutes Is the product clearly differentiated or there close substitutes? Naturally not all these points are explicitly considered in every pricing decision and it is quite possible for some factor not included above to be significant for a particular situation.
263 PRICING IN PRACTICE Like many other of problem the pricing decision suffers from the lack of accurate and relevant Information. This Is particularly so In relation to demand Information and many firms Incur consideration costs In an attempt to discover likely demand and how demand will vary with changes In price Its elasticity. Ways In which this Is done Include: surveys, market research, econometric analysis, test marketing, simulation models, representative's feedback and other such methods. However difficult the task may be, it is Important to try to establish some form of information on demand because it Is a crucial element. Pricing Is not simply a cost based decision which has been a traditional view and accounts for the frequent use of some form of cost plus system. Pricing is always an important decision although the frequency of such decisions and the level at which they are taken varies from firm to firm. For example, the price for a car would be a decision taken at Board level in a car manufactures and, even in inflationary conditions, would only be infrequently altered. On the other hand, in a jobbing engineering company making a variety of items -to order, pricing decisions are frequent and likely to be delegated to a relatively low level in the organization. It is in such organizations that pricing formulae and prescribed market ups are found In this way senior management attempt to control pricing policy whilst at the same time avoiding the detailed, day to day work of setting individual prices. Cost plus Pricing System Empirical studies have shown that firms frequently employ some form of formula based on cost to arrive at a selling price. In general these systems are concerned with two elements what is the relevant cost to include in the price? and what is the "profit" Margin which must be added to the costs to arrive at the selling price? Two cost plus system are described below: full-cost pricing and rate of return pricing. Full Cost Pricing This system, sometimes known as absorption cost pricing, uses conventional cost accounting principles to establish the total cost for a product to which is added a markup, say 20%, to arrive at a selling price. The total cost includes all the variable costs, the measurement of which should present few problems, plus apportioned fixed costs 'based on normal volumes and normal production mixes. It is this latter point which causes the major problems. The costs so established will only be appropriate when the actual volume / mix is the same as the estimated volume / mix even assuming there was some non arbitrary way of assigning fixed costs to products which there is not. Alternations in selling prices affect the volume of sales which In turn affect the unit fixed costs which raises the possibility of future price changes thus causing a circular problem
264 to be ever present when full-cost pricing Is employed. A further problem with this method of pricing which is common to all cost-plus systems, Is the amount of the mark-up. There are numerous factors, which govern the mark-up percentage. For example, the mark-up many be related to risk and rates of stock turnover (e.g. higher for Jewelers then greengrocers), It may be Influenced by general market conditions and the expected elasticity of demand for the product and it may be governed by what is normal for a given trade. The most Inflexible system would be where a fixed percentage is applied to the total cost to each product regardless of changes in conditions. This approach could cause a firm that is operating below capacity to turn away business which is available at less than normal price even though such business may be priced above marginal cost and would thus make a contribution to fixed cost. However, it must be realized that in the long run prices must be sufficiently high to recover all costs, both fixed and variable, together with a reasonable rate of profit otherwise the survival of the firm will be in jeopardy. Rate of Return Pricing Where an organisation used the concept of return on capital employed, = Profit / Capital Employed as a measure of performance, management may wish to know what selling price would be necessary to achieves a given rate of return on capital employed, estimating the total costs for a normal production year, and the amount of capital employed. These figures can be used in the following formula: Planned rate of mark-up on cost = Capital employed x Return on Capital Employed Total Annual Costs For example, assume that the target rate of retune on capital employed is 18%, the amount of capital employed is Rs. 1.5m and the estimated annual total costs are Rs. 2.25m, what is the required mark up on cost: Markup = 1.5 x 18% / 2.25 = 12% Notes: a. The ratio capital employed: Total Annual Costs is known as the capital turnover ratio. Return on capital employed (ROCE) The method of calculating a mark-up does have the advantage of relating pricing to longer term financial objectives but it will be apparent that it is only a variant of full cost pricing with the same potential inflexibility. The claim is sometimes made that the method removes the arbitrary element from establishing what a 'fair' mark up is, but the arbitrariness is simply transferred to the target rate of return. A farther element of arbitrariness is that in order to make the calculation in multi-product firm it would be
265 necessary to apportion capital employed by product group, which could only be done in an arbitrary manner. Both full-cost and rate of return pricing are essentially long-term pricing strategies which, rigidly applied, lack the flexibility to deal with short-term pricing decisions. Using Cost plus Systems A number of criticisms can be leveled at cost plus system particularly when they are used in a mechanical fashion. a. The systems do not take demand explicitly into account and assume that prices are solely cost related. b. Where the systems are incorporated in routine decision making there is the tendency to base the costs on past cost levels rather than consider what the costs will be in the future. c. Cost plus systems tend to ignore the inherent arbitrations of fixed cost allocation and absorption procedures and the apportionment of capital employed in a multi product organization. d. Cost plus is long run pricing concept which lacks flexibility in dealing with short run pricing where the interaction of volume,. Price and profit are all important. Frequently, of course, cost plus system are used in more flexible fashion and the notional cost plus profit is the starting point in a pricing decisions. Management may vary the mark up percentage by some intuitive consideration of demand, competition, capacity and other relevant matters. Thus adjusting the price to suit current circumstance. Question # 1: Modern Electronics Ltd is a manufacturing undertaking engaged in production of a highly sophisticated electronic product Zeta. Their factory has been lying closed. The manufactures claim that the industry failed due to import of similar product from Korea and Singapore at dumping price. The Government took notice of the situation and carried out investigations. Thereafter authorities imposed a ban on import of this item altogether. This enabled the industry to operate at full capacity to produce and market 10,000 units of Zeta. Relevant data collected is reproduced below: Balance Sheet Positions The company has authorized Capital of Rs. 1,000,000. Issued a paid up capital amounted to Rs. 500,000. Long-term loan amounted to Rs. 100,000 and current liabilities to Rs. 33,000. The fixed assets consisting of land, plant and machinery and vehicle amounted to Rs. 370,000 and current assets to Rs. 263,000. OPERATING COSTS Rs.
266 (i) Material Used a. imported 2,000,000 b. Local Materials 1,400,000 (ii) Direct Labor 1,630,000 (iii) Manufacturing overheads: Variable 1,500,000 Fixed: Depreciation 2,90,000 (iv) Administrative Expenses. 8,10,000 (v) Selling Expenses 1,040,000 There were no opening and closing inventories of raw material work in process and finished goods. Required: From the above details: a. Prepare a statement of Cost to make and sell Zeta. b. Work out the ex-factory price of each unit of Zeta on the following basis: (i) 20% mark-up on Cost. (ii) 20% return on Capital. (iii) 20% return on Capital employed. Answer # 1 (a) Demand of Zeta (10,000 units) Rs. Rs. Issued Capital 500,000 Current assets 263,000 Long term loan 100,000 Fixed assets 370,000 Current Liabilities 33, , ,00 Demand of Zeta (10,000 units) Rs. Rs. Issued Capital 500,000 Current assets 263,000 Long term loan 100,000 Fixed assets 370,000 Current Liabilities 33, , ,00 Operating Costs Rs. Rs.
267 Admin Selling 1,400,000 1,850,000 Total cost to make and sell 8,670,000
268 Answer (b) Operating Cost i. Cost Rs. 8,670,000 Add 20% mark up 1,734,000 10,404,000 Total Units 10,000 Unit price Rs. 1, Cost 8,670,000 Return on Capital (500,000 x 20%) 100,000 8,770,000 Total Units 10,000 Unit price Rs. 877 Cost 8,670,000 Return on Capital employed (600,000 x 20%) 120,000 8,790,000 Total Units 10,000 Unit price Rs. 879 Question # 2 EXE WYE Stores Maintenance Admin Material (Rs. In Millions) General Overheads Other Variable Departmental usage (%) Maintenance Administration Stores Floor space (sq m) Required: Working may be Rs. 000 with unit price. a. Calculate the budgeted selling unit of EXE and WYE based on the mark up. b. Discuss how the company may reach of the following independent which represents additional business opportunities.
269 (i) (ii) an enquiry form an overseas for 3000 units only of WYE price of Rs. 35 per unit is offered. and enquiry for 50,000 units of WYE to be supplied in full a regular intervals during the forthcoming year at t a price which is equivalent to full cost plus 10%. In both cases support your discus calculations and comment on any as or matters on which you would see clarification. Assume current production product EXE is units and product wye is 70,000 units Answer:2 a. Computation of full costs and budgeted cost-plus selling price EXE SYE Stores Maintenance Admin Rs. Rs. Rs. Rs. Rs. Material (Rs. In Millions) Other factory Gen factory Admin reallocation (0.560) Maintenance reallocation (0.536) Stores (.986) Volume 150,000 70,000 Rs. Rs. Full cost (unit) Mark up (25%) Price
270 Answer:2 b. (i) The incremental costs for the order consist of the variable costs. The calculation of the unit variable cost is as follows: EXE SYE Stores Maintenance Admin Rs. Rs. Rs. Rs. Rs. Material Other variable Admin (0.200) Maintenance (0.320) Stores (0.320) Volume 150,000 70,000 Rs. Rs. Variable cost The proposed selling price exceeds the incremental cost and provides a contribution towards fixed costs and profits of Rs (Rs. 35 Rs ) per unit thus giving a total contribution of Rs Given that the company has spare capacity no lost business will be involved and it appears that the order is a one-off short-term special order. Therefore the order is acceptable provided it does not have an impact on the selling price in the existing market or utilize capacity that has alternative uses. Given that the markets are segregated the former would appear to be an unlikely event. However, if the order were to generate further regular business the longer-term cost considerations should be taken into account in determining an acceptable long-run price. ii. The proposed selling price is Rs (full cost of Rs plus 10%). This will generate a contribution of Rs (Rs Rs ) per unit. Un-utilized capacity is units but the order is for units. Therefore the order can only be met by reducing existing business by units. The financial evaluation is as follows:
271 Increase in contribution from existing business (50,000 units at a contribution of Rs ) Rs Lost contribution from existing business (20,000 units at a contribution of (Rs Rs )) 643,400 Net increase in contribution 646,100 Before accepting the order the longer term implications should be considered. The inability to meet the full demand from existing customers may result in a significant reduction in customer goodwill and the lost contribution from future sales to these customers may exceed the short-term gain of Rs Also the above analysis has not considered the alternative use of the un-utilized capacity of 30,000 units. If the cost savings from reducing the capacity exceed Rs. 646,100 for the period under consideration the order will not be worthwhile. The order will also result in the company operating at full capacity and it is possible that the cost structure may change if the company is operating outside its normal production range. If the company does not rely on customer repeat orders and customer goodwill it is unlikely to be affected and the order would appear to be profitable. It is important, however, that long-term considerations are taken into account when evaluating the order. In particular, consideration should be given to the negotiation of a longer-term contract on both price and volume. Question # 3 FP sells and repairs photocopiers. The company has operated for many years with two departments, the Sales Department and the Service Department, but the departments had no autonomy. The company is now thinking of restructuring so that the two departments will become profit centres. The Sales Department This department sells new photocopiers. The department sells 2,000 copies per year. Included in the selling price is 60 for a one year guarantee. All customers pay this fee. This means that during the first year of ownership if the photocopier needs to be repaired then the repair costs are not charged to the customer. On average 500 photocopiers per year need to be repaired under the guarantee. The repair work is carried out by the Service Department who, under the proposed changes, would charge the Sales Department for doing the repairs. It is estimated that on average the repairs will take 3 hours each and that the charge by the Service Department will be 136,500 for the 500 repairs. The Service Department This department has two sources of work: the work needed to satisfy the guarantees for the Sales Department and repair work for external customers. Customers are charged at full cost plus 40%. The details of the budget for the next year for the Service Department revealed standard costs of: Parts at cost
272 Labour Variable overheads Fixed overheads 15 per hour 10 per labour hour 22 per labour hour The calculation of these standards is based on the estimated maximum market demand and includes the expected 500 repairs for the Sales Department. The average cost of the parts needed for a repair is 54. This means that the charge to the Sales Department for the repair work, including the 40% mark-up, will be 136,500. Proposed Change It has now been suggested that FP should be structured so that the two departments become profit centres and that the managers of the Departments are given autonomy. The individual salaries of the managers would be linked to the profits of their respective departments. Budgets have been produced for each department on the assumption that the Service Department will repair 500 photocopiers for the Sales Department and that the transfer price for this work will be calculated in the same way as the price charged to external customers. However the manager of the Sales Department has now stated that he intends to have the repairs done by another company, RS, because they have offered to carry out the work for a fixed fee of 180 per repair and this is less than the price that the Sales Department would charge. Required: a. Calculate the individual profits of the Sales Department and the Service Department, and of FP as a whole from the guarantee scheme if: (i) (ii) (iii) b. (i) (ii) (iii) The repairs are carried out by the Service Department and are charged at full cost plus 40%; The repairs are carried out by the Service department and are charged at marginal cost; The repairs are carried out by RS. Explain, with reasons, why a full cost plus transfer pricing model may not be appropriate for FP. Comment on other issues that the managers of FP should consider if they decide to allow RS to carry out the repairs. Briefly explain the advantages and disadvantages of structuring the departments as profit centres.
273 Solution # 3: per repair total repair Parts 54 Labour 45 Variable overhead 30 Marginal cost ,500 Fixed overhead 66 33,000 Total cost ,500 Mark-up 78 39,000 Selling Price ,500 Transfers at 40% mark-up Sales Services FP Sales 120, , ,000 Costs 136,500 97,500 97,500 Profit (16,500) 39,000 22,500 Transfers at marginal cost Sales Services FP Sales 120,000 64, ,000 Costs 64,500 97,500 97,500 Profit (Loss) 55,500 (33,000) 22,500 b. i. Full cost plus may not be appropriate: Are the fixed costs committed? Why is the quote by RS lower than the cost of the Service department? Full cost would build in any inefficiency in the Services Department. Full cost would lead to implied poor performance by the Sales Department, Full cost would lead to implied poor performance by the Sales Department. The performance measures and reward system would lead to a sub-optimal decision by the manager of the Sales Department.
274 ii. Issues to consider include: The quality of the repairs by Rs; Is the offer by RS a short term offer? Would the price rise in the longer term? Why are the costs of the Service Department higher than the price charges by RS? Are the fixed costs avoidable? Can the Service Department find other work to take up the capacity released if RS do the guarantee repairs? Pricing Methods Question #4 A ltd make one product. the fixed cost per week is Rs.8000 and variable cost is Rs.30. Answer #4 The selling price is Rs.70 and units demanded 300 per week. The sales manager estimates that each successive Rs.10 increase 0r decrease in price will reduce or increase the demand by 100 units weekly proportionately. Required: calculate optimal sale price. Units Sale Price V. Cost Unit Contribution Contribution 6,000 10,000 12,000 12,250 12,000 Fixed Cost 8,000 8,000 8,000 8,000 8,000 Profit (Loss) (2,000) 2,000 4,000 4,250 4,000 The optimal price is Rs. 65 profit is Rs Question #5 A music co. is about to launch a new album, which has a short selling life. The market survey has produced the following results. Price Rs Demand (Units) 2,000 5,000 10,000 15,000 25,000 Plant capacity to produce is units: The fixed cost is Rs. 500,000 and variable cost is Rs. 28 per unit; Required:
275 Calculate optimal price. Factors to be considered in pricing in this case Answer #5 Price Rs V. Cost Contribution / Unit Sales Units (000) Total Contribution (Rs. 000) ,000 Fixed cost (Rs. 000) Profit (Loss) (180) The optimal price is Rs.34 The capacity is limited to 150,000 units FACTORS TO BE CONSIDERED Anticipated market demand Competing products in the market Cost 0f production of the product Inflation rate Firm objectives profit maximization The stage in the product life cycle The level of activity the firm is operating Government legislation or restrictions The availability of the substitutes
276 Question # 6 A music co. is about to launch a new album, which has a short selling life. The market survey has produced the following results. Plant capacity to produce is units: The fixed cost is Rs. 500,000 and variable cost is Rs. 28 per unit; Required Calculate optimal price. Factors to be considered in pricing in this case Answer #6 The optimal price is Rs.34 The capacity is limited to 150,000 units FACTORS TO BE CONSIDERED Anticipated market demand Competing products in the market Cost 0f production of the product Inflation rate Firm objectives profit maximization The stage in the product life cycle The level of activity the firm is operating Government legislation or restrictions The availability of the substitutes Question # 7 A Ltd received an enquiry from B Ltd for supply of 100 units. LAST YEAR DATA IS AS FOLLOWS: Rs. Material Opening 70,000 Purchases 720,000 Labor 240,000 Overheads 270,000 Material Closing 100,000
277 CONTINUED FINISHED GOODS OP(20units) Rs.160,000 FINISHED GOODS CL(30 units) SELL,DIST EXP(10% of selling price) GEN.ADMN EXP(5% of selling price) SALES(140 UNITS) Rs.1,600,000 The units to be quoted for are of uniform quality and make. However material and labour will increase by 20% and 25% per unit and overheads will decrease by 20% per units Required: Calculate the price to be quoted to achieve the same % of profit on sales as was realized last year. Answer # 7 No of units produced: =150 Material cost: = Material cost per unit=690000/150=4600 Labour cost per unit =240000/150=1600 0verheads per unit =270000/150=1800 Gross profit= = Gross profit % of sale=400000/ =25% Net profit % on sales=25%-(10%+5%)=10% Continued: New cost per unit; Material=4600*1.2= Rs Lobour =1600*1.25= Rs Overheads=1800*.8= Rs Total manufacturing cost per unit= Rs which is equal to 75% of sale price therefore price to be quoted will be 8960/.75= per unit. Continued Sales 100* = Rs. 1194,667 Production cost=100*8960 = 896,000 Gross profit = 298,667
278 Selling exp:10%* = 119,467 Admn exp: 5%* = 59,733 Profit = 119,467 The quote should be Rs. 1,200,000.
279 Question No 8: Al-Karam Company's budget for the year includes the following items for its five divisions: Divisions Operating Income (Rs. million) Divisional Assets (Rs. million) 1. Data entry network solutions 1,650 5, Computers (Hardware s) 125 1, Office appliances Cell phones Software programmes 60 1,250 2,140 9,225 The manager of each division is paid a salary plus commission related to return on investment (i.e., operating income divided by divisional assets). The company uses 12% required rate of return for new investments in all the divisions. The company's management is concerned about the commission element of the divisional managers' emoluments. The divisions have recently submitted their investment proposals for the forthcoming year's budget. These investment proposals are based on discounted cash flow with positive NPV using 12% required rate of return. Following is the expected increase in operating income and divisional assets during the year as submitted by the divisions: Year Increase in operating income (Rs. million) Increase in Assets (Rs. million) Data entry network solutions 375 1,565 Computers (Hardware s) Office appliances Cell phones Software programmes Total: 650 3,285 Required: (a) How do the divisional investment proposals effect their ROI? Calculate the divisional ROI on the following assumptions: (i) Before the proposed investment, (ii) Of the proposed investment, and (iii) The combined investment (original investment and proposed investment). (iv) Comment on the results thereof.
280 (b) How will the adoption of proposed investment affect the residual income of respective divisions? Calculate the residual income by divisions under three assumptions as mentioned/given in (a-i, ii & iii) above. Also comment on the results. DISCOUNT TABLE PRESENT VALUE OF RUPEE 1 Present value of Ordinary Annuity of Rupee 1 Period(s) 10% 12% 14% 16% 18% Period(s) 16%
281 Answer No.8: AL-Karam Company Note: Division are reported by their sequence number as given in the question. a. Divisional return on investment = Existing (i) DENW Comp. Alt. Ap. Cell Software Investments 5,160 I, ,250 Returns 1, *Return on investment 32% 10% 22% 16% 5% Return on proposed investment Proposed investment 1, Proposed return Return on investment 24% 13% 19% 19% 14% *Rounded to nearest whole %age. Return on investment incorporating proposed investment. Rupees Million Existing investment 5,160 I, ,250 Proposed investment 1, ,725 1,875 1, ,565 Earning after propose investment 2, *Return on investment 30% 11% 21% 17% 7% *Rounded to nearest it whole% Comments: The divisions dealing with Computer hard ware (s no.2) and software programmes (s no. 5) are below the required rate of 12% at the moments however according to proposals for 2007/2008 they are the above the required rate of return at the Combined return on the average for their two products have improved by1 and 2% respectively. The proposal should therefore be accepted the linkage of divisional manager composition package with uniform rate of return be demoralizing for some divisional managers. Motivation and Challenge factor should be have enhanced and in over to do so the peak age should be ravine.
282 b. Divisional residual income: (Rupees in Millions) Existing 5,160 I, ,250 Existing earnings 1, Required return at 12% Residual income (less) 1,031 (25) (90) (i) Residual income of proposed investment Proposed Earnings Required return Residual income (ii) Combined residual income/loss above (i) + (ii) 1,218 (20) (83) (iii) Comments: The proposed investments after surplus residual income for each division, of the proposals for 2007/2008 are accepted the residual income of all the divisions will improve. Hence the proposals should be accepted.
283
284 CHAPTER 11 WORKING CAPITAL MANAGEMENT
285 WORKING CAPITAL MANAGEMENT Working Capital, Definition Float Payment and Collection Instruments Short-Term Investing Short-Term Borrowing Working Capital Working Capital All the items in the short term part of the balance sheet e.g. cash, short term debt, investments, inventory, debtors (receivables), payables (creditors) etc Net Working Capital is the difference between Current Assets and Current Liabilities Cash Management, Liquidity Management Interconnected terms. CORPORATE DEFINITION OF CASH MANAGEMENT The effective planning, monitoring and management of liquid / near liquid resources including: Day-to-day cash control Money at the bank Receipts Payments S-T investments and borrowings
286 WORKING CAPITAL DEFINITION OF LIQUIDITY Having sufficient funds available to meet all foreseen and unforeseen obligations Liquidity has costs Cash is unproductive Spread between borrowing and deposit rates and between long and short term rates NEED FOR LIQUIDITY Day to day transactions Precautionary balances Compensating balances Obtaining discounts Acid tests Favourable opportunities Overall avoiding bankruptcy! Operating Cycle Purchase Resources Pay Sell on Credit Receive Cash Inventory Conversion Receivables Conversion Payables Period Operating Cycle Cash Conversion Cycle From: Fundamentals of Contemporary Financial Management, 2nd ed, by Moyer, McGuigan and Rao The Various Cycles Inventory Conversion Inventory x 365 Cost of Goods Sold Payables Conversion Payables/Creditors x 365 Cost of Goods Sold Receivables Conversion Receivables/Debtors x 365 Turnover
287 Balance Sheet Short Term Items Current assets Inventories 1,910 1,903 Trade and other receivables 1,713 1,625 Current tax assets 13 - Other financial assets Cash and short term assets ,412 4,523 Current liabilities Short term borrowings Trade and other payables 1,690 1,735 Current tax liabilities Other financial liabilities Short term provisions ,367 2,477 Turnover 9,577 Cost of goods sold 8,943
288 Operating Cycle Purchase Resources Pay Sell on Credit Receive Cash Inventory Conversion 78 days Receivables Conversion 65 days Payables Period Cash Conversion Cycle 69 days 74 days Operating Cycle 143 Cash Conversion We need to consider control in all areas of working capital to maximise return, reduce cost. Some areas are not controlled by the Finance Function Stock/inventory Some areas have shared control payables and receivables Float Some areas are controlled by the Finance Function short term borrowing and investment Any delay in the process of converting materials and labour to receipt of payment involves cost, float cost. Similarly, any delay in making payments will also give rise to float but this time to our advantage What is float? The time lost between a payer making a payment and a beneficiary receiving value Cost of Float principle amount due x no of days x cost of funds 360 or 365 WHY DOES FLOAT OCCUR? Deliberately Inefficiency Logistical situations Compensation mechanism
289 Controlling Float We need to look at controlling / influencing float in three areas * Ourselves * Our Customers * Our Banks HOW TO REDUCE/CONTROL FLOAT Your Own Actions Change own systems Educate customers Include costs in prices Negotiate with bank RECEIVABLES AND PAYABLES MANAGEMENT Good receivables and payables management aids in: Cash flow forecasting Long-term funding and investment decisions Reduced risk of bad debts Stronger liquidity Stronger balance sheet ratios RECEIVABLES IMPACT Important because of costs arising from Float Bad debts Management time Legal fees Impact on analysts and creditors RECEIVABLES MANAGEMENT Clear instructions Method of payment Documentation Account structures Terms of Trade
290 Controlling Float Payment Methods Payment methods are important because of - Cost - Risk - Value Dating - Finality RECEIVABLES MANAGEMENT Penalties Post dated cheques Legal process Internal process Stop supply But do not forget Relationship Critical questions: PAYABLES What is due? When is it due? Where the payment should be sent? How should the payment be sent? Are there funds to cover the payment? Is the payment properly authorized? PAYABLES MANAGEMENT The flip side of the coin So Hang on to it Consider float versus control Account structures Discounts But do not forget Relationship
291 SHORT-TERM INVESTING The Decision Process How much do I have to invest per currency? How long do I have to invest it? Where are the funds located? What is my appetite for risk? INVESTMENT GUIDELINES What are the company s policies regarding? Currency exposure and hedging Banks used and limits Investment instruments and limits Use of automated sweep accounts Bank / investment ratings FACTORS IN CHOOSING INVESTMENTS The need to make an adequate return The need to take into account areas of risk Credit risk Interest rate risk Capital risk Market risk The need to consider liquidity HOW RATES ARE QUOTED At a discount: Instrument issued at less than 100% Coupon: Specific interest payments made at specific times Yield to redemption: Interest payments over the lifetime of the instrument and principal repaid may be greater or less than 100% SHORT-TERM INVESTMENTS Commercial paper (CP) Banker s acceptances (BAs) Repurchase agreements Certificates of deposit (CDs) Money market funds
292 Treasury instruments (bills, notes, bonds) SHORT-TERM BORROWING The Decision Process How much needs to be financed and in what currency? How long does the deficit need to be financed? Where does it need it be financed? What is the maximum level of funding needed? FACTORS AFFECTING BORROWING These factors affect both amounts available and cost Financial strength of the company Key covenants Industry Available guarantee or security Company s ability to repay on time from bank s perspective SHORT-TERM FUNDING INSTRUMENTS Internal short-term funding Least expensive source of funding Cross-border and cross-currency intra-group financing can be difficult External short-term funding Can act as a built-in hedge if sourced in the same currency Can be inexpensive to borrow local currency in the currency center FACTORS IN CHOOSING FUNDING INSTRUMENTS All-in borrowing cost Security required Terms & conditions Tax & balance sheet aspects FACTORS IN CHOOSING FUNDING Are all-in borrowing costs being offered? Does the bank require security? What are the terms and conditions? Is interest able to be offset on tax returns?
293 OTHER SOURCES OF FUNDING Factoring Invoice discounting Trade bills Acceptance credits Financing Of Working Capital The financing of the components working capital is not always undertaken on a completely maturity matched basis. That is, whilst working capital is regarded as net current assets that arguably should be funded by short term source of finance, this is not always the case for two reasons. First, by construction, net current assets are funded by long term sources of finance to the extent that all short-term sources of finance have been exhausted. This can be demonstrated from a characterization of a typical balance sheet: Fixed Assets + Net Current Assets - Long-Term Loans = Capital and Reserves By simply re-arranging, we see that: Net Current Assets = Capital and Reserves + Long-Term Loans Fixed Assets That is, net current assets are funded by long-term sources of finance not otherwise tied-up in fixed assets. These amounts will vary-day to day because the components of working capital vary from day to day. However, to the extent that there exists positive net current assets, then adequate long-term financing needs have to be considered. Second, the liabilities component of working capital (trade creditors and bank overdrafts) represent sources of' finance. As such, they are normally regarded as short term sources of finance. ln reality, for many business there is likely to be a core of current assets that will always need funding whilst the components of current assets will change on a day to day basis, their level to an extent ñ will remain predictable. It is this predictable component that enables managers to utilize longer term sources of finance in the knowledge that the finance will always be required. The distinction is often made between fluctuating current assets and permanent current assets. To the extent that current assets are permanent, then they are more efficiently financed by longer-term sources. This will help avoid the higher interest cost (implicit or explicit) in shorter-term sources of finance. The distinction between fluctuating and permanent current assets is illustrated in the following diagram that indicates the relationship between asset variability and funding maturity.
294
295 Question: 1 All Weather Windows Co manufactures and fits windows for domestic customer. The company needs to forecast its working capital requirement for the year ahead. The following figures are available: Sales revenue $7,600,000 Cost as percentage of sales revenue Raw materials 22% Direct labour 18% Variable production overheads 7% Apportioned fixed production overheads 12% Other costs 5% Working capital statistics Average raw material holding period Average work-in-progress (WIP) holding period Average finished goods holding period Average trade receivable s collection period Average trade payables payment period on: Raw materials Direct labour Variable production overheads Fixed production overheads Other costs Other relevant information 6 weeks 3 weeks 5 weeks 2.5 weeks 8 weeks 2 weeks 4 weeks 6 weeks 3 weeks 1. All finished goods inventory and WIP values include raw materials, direct labour, variable production overheads and apportioned fixed production overhead costs. 2. Assume WIP is 80% complete as to materials; 75% complete as to direct labour; 50% complete as to variable production overheads and fixed production overheads. 3. Assume there are 52 weeks in one year. 4. Assume that production and sales volume are the same. 5. All working should be in $ 000, to the nearest $ 000. Required: Calculate the estimated average working capital required by All Weather Windows Co for the year, showing all necessary workings.
296 Answer: 1 All Weather Windows (a) Working capital requirements $ 000 Sales revenue for the year: 7,600 Raw material costs $7,600,000 x 22% 1,672 Direct labour costs $7,600,000 x 18% 1,368 Variable production overheads $7,600,000 x 7% 532 Variable production overheads $7,600,000 x 12% 912 Other costs $7,600,000 x 5% 380 4,864 Current Assets: Inventory $ 000 $ 000 Raw materials 6/52 x $1.672m 193 W-I-P Materials 3/52 x $1.672m x 80% 77 Direct labor 3/52 x $1.368m x 75% 59 Variable and fixed production overheads 3/52 x ($532k + 912k) x 50% Finished good Materials and direct labor 5/52 x ($1.672m + $1.368m) 292 Variable and fixed production overheads 5/52 x ($532k + $912k) Total inventory value 802 Trade receivables 2.5/52 x$7,600, Total value of current assets 1,167
297 Current Liabilities Accounts payable $ 000 $ 000 Materials 8/52 x $1.672m (257) Labor 2/52 x $1.368m (53) Variable production overheads 4/52 x $532k (41) Fixed production overhead 6/52 x $912k (105) Other costs 3/52 x $380k (22) Total value of current liabilities (478) Working Capital required 689
298 Question: 2 Extracts of recent accounts for Best plc, a manufacturer of sportswear, are given below. 000 Year ended 31/ Sales 5,000 6,000 Cost of sales 2,000 3,000 Purchase 1,000 1,300 Stocks: Raw materials Work in progress Finished goods Debtors 1,233 1,740 Creditors Notes 1. Work in progress is estimated to be 40% complete. 2. Figures for stocks, debtors and creditors represent average balance 3. Sales and production are spread evenly over the year. Required: (a) Calculate the length (in days) of the cash operating cycle (sometimes known as the working capital cycle) for Best plc for the years 2011 and (b) Explain what the length of the cash operating cycle means and comment on the implications of any changes in the length of the operating cycle between 2001 and 2002 for Best plc. (c) In an attempt to reduce the length of time customers take to settle bills Best is considering introducing a settlement discount of 2% for payment made within 30 days. assuming that customers who will take discount currently pay on average in 100 days, estimate the annual percentage (d) Suggest five other methods Best may use to prompt earlier settlement from overdue debtors.
299 Answers: 2. (a): Cash Operating Cycle Days Raw material holding period Production period Finished goods holding period Debtor days Creditor days (40.88) (30.88) Cash operating cycle Workings 180 days 202 days Raw material holding period 164/1,000 x 365 = /1,.00 x 365 = Production period 88/(2,000 x 0.4) x 365= /(3,000 x 0.4) x 365=35.89 Finished goods holding 170/2,000 x 365 = /3,000 x 365 = period Debtor days 1,233/5,000 x 365 = ,740/6,000 x 365 = Creditor days 112/1,000 x 365 = /1,300 x 365 = (b) Explanation and Comment Length of the cash measures the interval between a company paying cash at the start of its operations (normally for raw materials in a manufacturing business) and receiving cash from customers. Implications of any changes For Best plc the cycle appears to have lengthened. This has several implications: The amount of money tied up in working capital will increase; this will be detrimental to Best s cash flow. The finance cost of working capital will increase. Longer stock holding periods for finished goods may result I more stock losses due to damage, deterioration, obsolescence, theft etc Longer credit given to customers may result in more bad debts as long credit periods give more time for things to go wrong. On the other hand there could be some good new associated with the longer cycle.
300 Higher stock levels and longer credit periods may attract ore customers and increase sales and profits Quicker settlement of creditors may gain settlement discounts, or better service from suppliers. (c) In simple interest terms the discount costs 2/98 x 365/70 = 10.6% in compound (APR) terms it costs (1 + 2/98) 365/70 1 = 11.1%
301 Question: 3 On 1 st July 2012, the CFO of Decent Fabrics Ltd., wishes to know the working capital requirement for the current year to arrange the short-term financing. The following information is available: i. Issued and paid-up capital Rs. 4,000,000. ii. 10% TFCs Rs. 1,000,000. iii. iv. Fixed assets valued at RS.2, 500,000 on 30th June The depreciation for the current year is Rs. 250,000. Production during the previous year was 4,000 units. It is planned that this level of activity should be increased by 50% during the current year. v. The expected ratios of cost to selling price are - raw materials 60%, direct wages 10%, and overheads 20%. vi. vii. viii. ix. Required: Raw materials are expected to remain in stores for an average of two months before these are issued for production. Each unit of production is expected to be in process for one month Finished goods will stay in warehouse for approximately three months The suppliers grant credit for two months from the date of delivery of raw materials a. Calculate the working capital requirement for the current year. b. Prepare the forecast income statement and balance sheet for Answer 3.(a): Decent Fabrics Ltd. Forecast Working Capital Current Assets Rs. Rs. Cash in hand 100,000 Raw Material 600,000 Work-in-progress 450,000 Finished Goods 1,350,000 Alternatively Accounts receivable 1,350,000 1,500,000 3,850,000 4,000,000 Less: current Liabilities: Accounts Payable 600, ,000 Net Working Capital 3,250,000 3,400,000
302 Workings: Raw Materials: 2 Months consumption (3,600,000 x 2/12) 600,000 Work in Process (1 month s production): Raw Material (Rs. 3,600,000/12) 300,000 Direct Wages (600,000/12) 50,000 Overheads (1,200,000 /12) 100, ,000 Finished goods 5,400,000 x 3/12) 1,350,000 Accounts receivable (3 months cost of sale) (5,400,000 x 3/12) Accounts payable (2 months consumptions of raw material) (3,600,000 x 2/12) Answer 3.(b) i: Decent Fabrics Ltd. Forecast Income Statement For the year ended 30 th June 2013 Rupees Alternatively 1,350,000 1,500, ,000 (6,000,000 x 3/12 Sales 6,000 Rs. 1,000 1,200,000 Less: Cost of Sales: Raw Material (6,000 x 600) 3,600,000 Direct Wages (6,000 x 100) 600,000 Overheads (6,000 x 200) 1,200,000 5,400,000 Gross Profit 600,000 Selling and administrative expenses 300,000 EBIT 300,000 Less: Interest on TFCs 100,000 Net Profit 200,000
303 Answer 3 (b) ii: Decent Fabrics Ltd. Forecast Balance Sheet As on 30 th June, 2013 Liabilities and owners Equity Rs. Rs. Assets Rs. Rs. Accounts payable 600,000 Current Assets 10% TFC 1,000,000 Cash in hand 100,000 Owners equity Accounts 1,500,000 Receivable Share Capital 4,000,000 Raw Material 600,000 Work-in-process 450,000 Retained earnings (Balance figure) 450,000 Profit for the year 200,000 4,650,000 Finished goods 1,350,000 Fixed assets 2,500,000 Total 6,250,000 Less: depreciation 250,000 2,225,000 Total 6,250,000
304 Question: 4 A Ltd is a retailer of real wood flooring. It buys and sells 20,000 packs of flooring each year from its supplier B Ltd. The real wood flooring from Strong Ltd costs 35 per pack. There is an order processing charge of 150 per order irrespective of the quantity of packs ordered, and B Ltd takes 10 days to deliver the wood flooring. The average cost of holding one pack of real wood flooring for one year is 9. A new supplier of real wood flooring C Ltd, has offered A Ltd wood flooring on slightly different term. C Ltd guarantees that its wood will never arrive damaged since it uses special packaging designed for maximum protection. It charges per pack for the flooring. There is an order processing charge of 160 per order irrespective of the quantity of packs ordered, and CLtd takes 7 days to deliver the goods. The average cot of holding one pack of C Ltd s real wood flooring for one year is 12. this is because the special packaging takes additional storage space. The economic order quantity, which will minimize costs, is: Where Required: Co = the cost of placing one order D = the annual demand in unit Ch = the cost of holding one unit per annum (a) Calculate and conclude whether it is worth accepting the offer by ordering 2,000 packs at a time from Fake Ltd. (b) Answer: 4 (a) Current supplier EOQ Outline three non-financial factors that should be taken into account when deciding whether to change suppliers from Strong Ltd to Fake Ltd. Where: Co = the cost of placing one order D = the annual demand in unit Ch = the cost of holding one unit per annum
305 = 816 (i) Total cost: Holding cost: average stock x unit holding cost = (816 2) x 9 = 3,672 Ordering cost = number of order x 150 Number of order = annual demand EOQ = 20, = 24.5 Therefore ordering cost = 3,675 per annum Purchase cost = 20,000 x 35 = 700,000 Total cost for one year = 3, , ,000 = 707,347 b. New supplier i. EOQ = 730 ii. Total cost Holding cost: average stock x unit holding cost = (730 2) x 12 = 4,380 Ordering cost = number of orders x 160 Number of orders = annual demand EOQ = 20, = 27.4 Therefore ordering cost = 4,384 per annum Purchase cost = 20,000 x = 699,000 Total cost for one year = 4, , ,000 = 707,764 (c) Discount Holding cost = (2,000 2) x 12 = 12,000 Ordering cost = (2,000 2,000) x 160 = 1,600
306 Purchase cost = 699,000 x 99% = 692,010 Total cost for one year = 12, , ,010 = 705,610 The discount means that it is worth changing suppliers. (d) Non-financial factors Quality of C Ltd s wood. This may not be as good as B Ltd s wood, although it should be as there is very difference in price. The new wood should be closely inspected to ensure that it is of the same thickness as the current wood. Reliability of C Ltd. appears to have a shorter lead time for orders (seven days instead of 10 days) both they are not able to send stock consistently on time, A Ltd may end up running out of stock. This could mean customers go elsewhere, leading to lost revenue for the company. Packaging of C Ltd s wood. C Ltd s packaging needs to look attractive; otherwise customers will not buy if the addition, it needs to protect the wood well, as the guarantee claims. Range. There are many different types of wood, e.g. beech, maple and oak. A Ltd needs to ensure that all currently stocked types of wood are on offer from the new supplier. Returns policy. C Ltd appears to offer a guarantee that the wood will arrive undamaged but A Ltd may still need make returns. C Ltd s policy would need to be understood and the extent to which they are contactable to deal problems would be relevant.
307 Question: 5 Tostao plc is a manufacturer and distributor of a popular child s toy, the Rivelino. It sells 66,000 Rivelinos per year but demand is very seasonal with 50% of annual sales occurring in December and the remainder being spread evenly over the rest of the year. At present Tostao plc manufactures a constant 5,500 toys per month and builds up stocks of finished goods which are used to meet the high demand in December. By the end of December finished goods stocks are zero. The major raw material for the Rivelino is plastic which Tostao plc buys from a local supplier. Each Rivelino uses 1 kilogram of plastic costing 2 per kilogram. A material order is placed once a year for delivery of 66,000 kilograms of plastic at the beginning of January. There is a delivery charge of 2,000 per order and Tostao plc estimates that it costs 0.50 to store a kilogram of plastic for a year. Tostao plc is currently looking for ways to reduce its overdraft and the bank manager has suggested that it reviews its stock management policies. Required: (a) (b) Calculate the total annual holding, ordering and purchase cost for plastic under Tostao plc s current raw material stock policy. Calculate the economic order quantity for plastic assuming Tostao plc continues to manufacture 5,500 Rivelinos per month. The economic order quantity equation may be defined as: EOQ = Where Co = the cost of placing an order D = annual demand Ch = the cost of holding one unit for one year (c) The supplier of plastic finds it very convenient to deliver once per year and has indicated that it would be prepared to offer Tostao plc a bulk order discount if it continued to buy in lots of 66,000 kilograms. Calculate the minimum discount (to the nearest percentage point) required to persuade Tostao plc to continue to order once per year. (d) Explain the just-in-time approach to stock control and discuss the advantages and disadvantages to Tostao plc of adopting a just-in-time approach to its production of Rivelinos and raw material purchasing.
308 Answer:5 Current annual costs Ordering cost Number of order x cost per order 2,000 1 x 2,000 Holding cost Average stock x holding cost per annum 16,500 66,000 kg/2 x 0.50 Purchase cost Kg purchased x price per kg 132,000 66,000 kg x 2 per kg 150,00 (b) Economic order quantity Co = 2,000 Ch = 0.50 D = 66,000 kg (c) Minimum discount Revised annual costs Ordering cost Number of order x cost per order 5,745 66,000/22,978 x 2,000 Holding cost Average stock x holding cost per annum 22,978 kg/2 x ,745 Purchase cost Kg purchased x price per kg 132, ,490 Current annual cost {from (a)} 150,500 Saving from new policy 7,010
309 Using EOQ would generate saving of 7,010 per annum. To persuade Tostao plc to remain with its existing policy the supplier would need to offer a discount of 7,010/ 132,000 = 5.0% (d) Just in - (JIT) approach to stock to control JIT approach to control involves manufacturing the finished product at the last possible moment before it is required by customers and arranging delivery of raw materials at the possible moment when they are required to the production line. Advantages or disadvantages of adopting (JIT) approach (JIT) approach to the production Rivelinos would substantially reduce finished goods stock holding costs. At present Tosta pick is stockpiling finished products from January onwards. Under the (JIT) the toys required for December sales would be made in December, substantially reducing holding costs. (JIT) would also lead to low raw material stocks, again giving substantial saving in holding costs. Disadvantages: Adaption Of a (JIT) system would mean that production levels in December would need to be much higher then other months. This would involved an increase in the work force and possibly and extension to factory capacity for this one month. This may be not be possible or costs affective. (JIT) would involve more frequent deliveries of raw material and a close working relationship with suppliers. The supplier has already indicated reluctance to deliver more frequently and raw material cost may rise. Quality of raw material and manufacturing becomes absolutely vital under a (JIT) system as there are no safety-stock to fall back on. Any failures could lead to delayed delivery to customer and the potential for lost business. d. Many possibilities exist including Interest charges for late settlement Reminder letters Telephone calls Debt collection agencies Visits to the customer by credit control staff Legal action on overdue accounts
310 Question: 6 In your organization uses 1,000 packets of paper each year of 48 working weeks. The variable costs of placing an order; progressing delivery and payment have been estimated at RS.12 per order. Storage and interest costs have been estimated at RS.O.50 per packet per annum based on the average annual stock. The price from the usual supplier is Rs per packet for any quantity The usual supplier requires four weeks between order and delivery. A potential supplier has offered the following schedule of prices and quantities: Rs per packet for a minimum quantity of 500 at any one time. Rs per packet for a minimum quantity of 750 at any one time. Rs per packet for a minimum quantity of 1,000 at any one time. If more than 450 packets are received at the same time an additional fixed storage cost of Rs. 250 will be payable for the use of additional space for the year. Assume certainty. of demand, lead time and costs. You are required to: (a) (b) (c) (d) Calculate and state the EQO from the existing supplier. Calculate and state the stock level at which the orders will be placed; Calculate and state the total minimum cost for the year from the existing supplier; Calculate and state the total minimum cost if you change to the new supplier. Answer: 6 (a) (b) Re-order level = Usage during lead time + Safety Stock = Weekly usage x lead time in weeks + Safety Stock = 1000/48 x Re-order level = 83 Packets. Assuming certainty of delivery within four weeks i.e. Zero Safety Stock (c) No. of orders = 1000/219 = i.e. 5 orders Purchase Price Rs x Rs = 7,500 Carrying Cost = Average Inv. X per unit C.C. = 219/2 x 0.50 = Rs
311 Ordering Cost = No. of order x per order cost = 4.56 x Rs. 12 = Total Cost of existing supplier = Rs. 7, (d) Option-I Purchase Price = Rs per packet EOQ = 500 Packets Cost of Packet (1000 x Rs. 7.25) = Rs. 7,250 Carrying Cost (500/2 x Rs. 0.50) = 375 Ordering Cost (1000/500 x Rs. 12) = 24 Total Cost = Rs. 7,649 Option-III Purchase Price = Rs per packet EOQ = 1,000 Packets. No. of Orders = 1000/1000 = 1 order. Cost of Packet (1000 x Rs. 6.94) = Rs. 6,940 Carrying Cost (1,000/2 x 0.50) + Rs Ordering Cost (1000/1000 x Rs. 12) 12 Total Cost = Rs. 7,452 Thus, the minimum total annual cost is Rs. 7,452 with an order quantity of 1,000 Packet.
312 Question 7: Waset Co is a waste management company, with one sole shareholder / director, Mr. Trusty. It collects two types of waste from business recyclable waste and confidential waste. Since companies have increasingly become aware of both the need for recycling and the need to protect confidential information, Waste co s client base has expanded rapidly over the last two years. As the business has expanded Mr. Trusty has had less time available to focus on credit control. This ahs resulted in a steady deterioration in accounts receivable collection and a rapid increase in Mr. Trusty s overdraft, despite high profits. Mr. Trusty s bank has now refused to extend his overdraft any further and has suggested that he either employ a credit controller or factor his accounts receivable. The following information is available: 1. Credit sales for the year ending 30 November 2007 were $ 2,550,000 and average accounts receivable days were 60. Sales are expected to increase by 25% over the next year. 2. If Mr. Trusty employs a good credit controller, the cost to the business will be $47,000. it is anticipated that the accounts receivable days can then be reduced to 40 days. 3. A local factoring organization has offer a facto the company's accounts receivable on the following terms. i. An advance of 80% of the value sales invoices (which Mr. Trusty would fully utilize. ii. iii. iv. An estimated reduction in accounts receivable days to 35 days. An annual administration fee of 1.3% of turnover. Interest charge on advances of 12% per annum. 4. Current overdraft rates are 10% per annum. 5. Assume there are 365 days in a year. Required: a. Explain the meaning of debt factoring (accounts receivable factoring) to Mr. Trusty, distinguishing between with recourse and without recourse agreements. b. Explain how debt factoring is different form invoice discounting. c. Calculate whether it is financially beneficial for Waste Co to factor its accounts receivables for the next year, as compared to employing a credit controller. d. State four roles that a credit controller may plan.
313 Answer 7: a. Debt factoring: 'Debt factoring' is a service provided by factors whereby the factor collects accounts receivable on behalf of their client and often invoices their client's customers as well. The factor also advances, to its client, a proportion of the money it is due to collect (typically about 80% is advanced.) Mr. Trusty would find the service useful because he could both receive cash early and also delegate the administration of his invoicing, accounting and accounts receivable collection work. There are two types of factoring agreements: 'with recourse' and 'without recourse' agreements. With the first of these agreements, although the factor advances monies, the risk of non-payment of accounts receivable balances stays with the client. If a balance is not recovered, the factor has 'recourse' to their client for the money. If the agreement is 'without recourse' the factor bears the risk of non-payment. Debt factoring has to be paid for, usually as a percentage of the amounts advanced and as a percentage of turnovers. Agreements without recourse to the client obviously cost more. Mr. Trusty would have to compare the cost to those of employing an individual to do his invoicing and obtaining insurance against unpaid accounts receivable balances. In addition, there may be some stigma attached to debt factoring as clients sometimes assume that a business using a factor must be in financial difficulty. b. Difference from Invoice discounting Invoice discounting is a service whereby a provider (often a factoring company) purchases invoices from a client at a discount. In this case, they are merely advancing cash, rather than providing an accounts receivable collection service. For this reason, there is no administration fee payable (like there is for factoring), making invoice discounting a cheaper option. c. Whether to factor accounts receivables Cost of factoring New sales level = $2,550,000 x 125% $3,187,500 Accounts receivable reduced to 35 days: $3,187,500 x 35/365 $305,651 80% advanced by factor at 12%: $ $305,651 x 80% x 12% 29,342 $20% still financed by overdraft: $305,651 x 20% x 10% 6,113 Admin fee: $ 3m187m500 x 1.3% 41,438
314 76,893 Cost of not factoring but employing, staff accounts receivable reduced to 40 days: $3,187,500 x 40/365 $349,315 Overdraft cost $349,315 x 10% 34,932 Credit controller costs 47,000 b. Roles of a credit controller May include some/all of the following: - Updating the sales ledger - Dealing with customers queries - Assessing creditworthiness of new customers - Establishing / updating payment terms for customers - Regular review of the sales ledger - Pursuing overdue accounts receivable balances - Providing references for customers $ 81,932
315 Question: 8 (a) XYZ Ltd. requires advice on its debt collection policy. Should the current policy be discarded in favour of option 1 or option 2? Option 2 Current Policy Option 1 Expenditure on debt collection per annum Rs. 240,000 Rs.300, 000 Rs.400, 000 Bad debts losses (% of sales) 3% 2% 1 % Average collection period 2 months 1 ½ months 1 month Current sales are Rs. 4.8 million per annum and the variable cost of sales is 90% of sales value. The company requires a 15% return on its investment. (b) XYZ ltd. is considering a change of credit policy which will result in a slowing down in the average collection period from one month to two months. The relaxation in credit standards is expected to produce an increase in sales in each year amounting ton 25% of the current sales volume. Sales price per unit Rs.10, variable cost per unit Rs.8.50, current sales per annum Rs.2.4 million. The required rate of return on investment is 20%. Assuming that the 25% increase in sales would result in additional stocks of Rs.100, 000 and additional creditors of Rs.20, 000. Required: advise the company on whether or not to extend the credit period to customers if : All customers take the longer period 0f 2 months. Existing customers do not change their payment habits, only new customers take a full 2 months credit.
316 Answer: 8 (a) Recommendation: The company should discard the current policy in favour of option I Current Policy Option I Option II Rs.000 Rs.000 Rs.000 Current sales 4,800 4,800 4,800 Less variable cost of sales 90% 4,320 4,320 4,320 Contribution Less: Debt collection expenditure Bad debts 3% 144 2% 96 1% 48 Carrying Costs Rs. 4,800 x (2/12) x Rs. 4,800 x (1.5/12) x Rs. 4,800 x (1/12) x Profit (loss) before taxes (24) (6) (28) Answer: 8(b) XYZ Ltd. Current Rs. 000 Situation Situation Situation Rs. A Rs. B Rs. Sales (Rs x 2400,000) 2,400 3,000 3,000 Less: Variable cost 85% 2,080 2,550 2,550 Contribution Carrying costs Cost of addition working capital Rs. (80,000 x 20%) Total Cost Profit before taxes Carrying Cost (i) Rs x (1 /12) x 20% = 40 (ii) Rs x (2/12) x 20% = 100 (iii) Rs x (1 /12) x 20% = 40
317 (3,000-2,400) = 600 x (2 / 12) x 20% = 20 Plan B has an advantage of Rs. 19,440 over plan A which is very nominal compared with period of credit 45 days to 60 days. Before we decide to relax credit policy a detail study is required of all other factors relevant to credit policy, reliability of estimates etc. Note: Credit cost can be calculated by using cost rather Sales. 60
318 Question: 9 ABC Company is attempting to evaluate whether it should ease collection efforts, the firm sells 72,000 units per year at an average price of Rs.32 each. Bad debt expenses are 1 percent of sales and collection expenditures are Rs. 60,000. The average collection period is 40 days, and the variable cost per unit is Rs. 28. By easing the collection efforts, ABC Company expects to save Rs. 40,000 per year in collection expenses. Bad debts will increase to 2% of sales, and the average collection period will increase to 58 days. Sales will increase by 1000 units per year. If the firm has a required rate of return on equal risk investments of 24 percent, what recommendation would you give the firm? Use your analysis to justify you answer. Answer: 9 Current Situation Relax Policy Rs. Rs. Rs. Rs. Sales Variable cost Contribution (a) 4 4 Total contribution (a x sales) 288,00 292,000 Bad debts (W -1 ) 23,040 46,720 Collection charges 60,000 20,000 Credit cost: 72,000 x Rs. 32 = Rs. 2,304,000 x 40/360 x 24% 61, ,480 73,000 x Rs. 32 x 58/360 x 24% 90, ,045 Profit 143, ,955 '(W-1) Current situation - 72,000 x Rs. 32 = Rs. 2,304,000 x 1% = Rs. 23,040 Relax policy - 73,000 x Rs. 32 = Rs. 2,336,000 x 2% = Rs. 46,720 Recommendation: The credit policy should not be relaxed as it increase the cost of Bad Debts as well as credit cost, although there is saving of Rs. 40,000 in collection expenditure. an overall decrease of Rs. 8,565 in profit does not justify the relaxation in the credit policy.
319 Question: 10 Noor Ltd., is considering to raise working capital of Rs. 400,000 either by a commercial bank loan, secured by accounts receivable, or factoring accounts receivable. Noor Ltd: s bank has agreed to lend the firm 80% of its average monthly accounts receivable of RS.500,000 at an annual interest rate of 12%. The bank loan is in the form of a series of 30-day loans. The loan would be discounted, and a 15% compensating balance would also be required. Noor Ltd., can arrange from another commercial bank any shortfall in working capital up to 15% annual interest payable in arrear. A factor has agreed to purchase Noor Ltd.s 84% accounts receivable. The 16% of receivables would be held in a reserve account. The factor would charge Rs. 1,500 processing fee and 3% factoring commission on the invoice amount each month. The factor would also charge 10% on accounts receivable purchased. The factoring commission, processing fee and monthly interest payment would be deducted from the accounts receivable purchased on monthly basis. If Noor Ltd., chooses the factoring arrangement, it can eliminate its credit department and reduce operating expenses by Rs. 8,000 per month. In addition, bad debt losses of 2% of the monthly receivables will also be avoided. Required: i. Compute the annual cost associated with each financing arrangement. ii. Answer: 10 Discuss some considerations other than cost that may influence management s decision between factoring and bank loan. Annual Cost of financing: Shortfall of working capital in case of commercial bank loan: Rupees Amount of loan (0.80) (500,000) 400,000 Interest (0.12/12)(400,000) (4,000) Compensating balance (0.15) (400,000) (60,000) Amount received 336,000 Working capital required 400,000 Shortfall in working capital 64,000 Annual cost of commercial bank loan: Rupees Interest expense (0.12)(400,000) 48,000 Credit department (8,000)(12) 96,000 Bad debts (0.02)(500,000)(12) 120,000 Interest on short fall in working capital Rs. 64,000 x ,600 Total annuals costs 273,600 The cost of the credit department and bad debts expenses will be incurred if a bank loan is used, but these costs will be avoided if the company accepts the factoring arrangement.
320 Amount received form factor: Rupees Amount loaned (0.84) (500,000) 420,000 Commission (0.03)(500,000) (15,000) Prepaid interest (0.10/12) (420,000) (3,500) Process fee (1,500) Amount received 400,000 Annual cost of factoring: Rupees Annual commission (15,000)(12) 180,000 Annual interest (0.10)(420,000) 42,000 Processing fee (1,500)(12) 18,000 Total annual costs 240,000 The factoring costs are slightly lower by Rs. 33,600 (Rs. 273,600 Rs. 240,000) than the cost of the bank loan, and the factor is willing to advance a significantly greater amount. On the other hand, the elimination of the credit department could reduce the firm s options in the future.
321 Question: 11 Special Gift Supplies pic is a wholesale distributor of a variety of imported goods to a range of retail outlets. The company specializes in supplying ornaments, small works of art, high value furnishings (rugs. etc.) and other items that the chief buyer for the 'company feels would have a market in the UK. In seeking to improve working capital management, the financial controller has gathered the following information: Months Average period for which items held stock 3.5 Average debtors collection period 2.5 Average creditors payment period 2.0 Required: (a) Calculate Special Gift Supplies funding requirement for working capital measured in terms of months. (b) In looking to reduce the working capital funding; (c) Requirement, the financial controller of special Gift Supplies is considering factoring credit sales. The company's annual turnover is 2 5m of which 90% are credit sales. Bad debts are typically 3% of credit sales. The offer from the factor is conditional on the following: 1. The factor will take over the sales ledger of Special Gift Supplies completely % of the value of credit sales will be advanced immediately (as soon as sales are made to the customer) to Special Gift Supplies, the remaining 20% will be paid to the company one month later. The factor charges 15% per annum on credit sales for advancing funds in the manner suggested. The factor is normally able to reduce the debtor's collection period to one month. 3. The factor offers a 'no recourse facility whereby they take on the responsibility for dealing with bad debts. The factor is normally able to reduce bad debts to 2% of credit sales. 4. A charge for factoring services of 4% of credit sales will be made. 5. A one-off payment of 25,000 is payable to the factor. The salary of the Sales Ledger Administrator ( 12,500) would be saved under the proposals and overhead costs of the credit control department, amounting to 2,000 per annum, would have to be reallocated. Special Gift Supplies' cost of overdraft finance is 12% per annum. Special Gift Supplies pays its sales force on a commission only basis. The cost of this is 5% of credit sales and is payable immediately the sales are made. There is no intention to alter this arrangement under the factoring proposals. Required: Evaluate tile proposal to factor the sales ledger by comparing Special Gift Supplies existing debtor collection cost with those that would result from using the factor (assuming that the factor can reduce the debtor's collection period to one month).
322 Answer: 11 (a) The funding requirement for working capital is the sum of: Months Stock holding period 3.5 Debtors collection period 2.5 Creditors payment period (2.0) Working capital funding period 4.0 Diagrammatically, the funding requirement may be represented as: (b) Annual sales 2.5m Credit sales: 2.5m x 90% = 2.25m Factor will advance 80% of 2.25m = This is not adjusted for bad debts since the agreement is without recourse. Assuming sale are evenly spread, the factor will pay ( )/12 = 37,500 each month, in arrears by one month. Factor service charge is 4% x 2.25m = 90,000 Commission charges payable to the sale force are ignored in the following calculations since they are common to both. The allocated overheads are also irrelevant for the evaluation. The factor s better record with bad debts is not part of the evaluation of the proposal in terms of the benefits to Special Gift Supplies.
323 PAYABLE MANAGEMENT Question 1: ABC limited meets its Short-term fund requirements by stretching its account payable and borrowing from a finance company. at the close of June 30, 2006, the requirements of fund included maximum Rs. 40,000 fro finance company, attracting 24% per annum. The remaining fund requirement was met through accounts payable stretching. It has remained a matter of practice that 30%of funds requirement in accounts payable are normal payables and do not attract any charges, however, balance stretched payables are 30% per annum. One of the leading insurance company has offered financing of Rs. 18% per annum per for 5 years term. ABC Limited, in order to determine its advantages and to avoid expansive accounts payable stretching cost wanted to evaluate the proposal based on its requirements of funds under following conditions:
324 Existing position: Credit control salary 12,500 Bad debts 3% x 2.25m = 67,500 Annual funding costs for debtors:(2.5/12) x 12% x 2.25m = 66, ,250 Factor s offer: Factor finance charge: 2.25m x 80% x 15% x (1/12) = 22,500 Unfactored funding costs at Special Gift Supplies cost of capital: 2.25m x 20% x 12% x (1/12) = 4,500 Factor service charge: 4% x 2.25m 90,000 One off payment funding costs at Special Gift Supplies cost of capital: 25,000 x 12% 3,000 Hence it is worthwhile to factor the debt 120,000 Rupees Boom period Funds requirement 160,000 Normal Period Funds requirement 120,000 Recession period Funds requirement 90,000 Required: Prepare a comparative evaluation sheet for above proposals and give your recommendations. (Prepare and present all necessary workings). Answer 1: Cost of funds under current conditions (Rupees) Boom Normal Recession Funds requirements 160, ,000 90,000 Normal payable with no charge 48,000 36,000 27,000 Finance Co loan 40,000 40,000 40,000 Total 88,000 76,000 67,000 Stretches payable 72,000 44,000 23,000
325 Cost of Funds P.A Finance 24% 9,600 9,600 9,600 Stretched 30% (a) 21,600 13,200 6,900 Total Cost 31,200 22,800 16,500 Cost of Funds under Insurance co. Finance Funds requirement 160, ,000 90,000 Term loan insurance co. 80,000 80,000 80,000 Normal payable 48,000 36,000 10, , ,000 90,000 Borrowing from Finance 24% 32,000 4,000 Nil There is no need of stretching A/P Cost of Funds P.A Cost of Funds P.A Cost of term 18% x 80,000 14,400 14,400 14,400 Cost of Finance x 32,000 7, Total Cost (b) 22,080 15,360 14,400 Savings under Ins. Finance (a-b) 9,120 7,440 2,100 Financing from Insurance Co. would he advantageous
326 CASH MANAGEMENT Question: 1 The following information has been extracted from the books of XYZ Limited: Annual interest rate 12% Fixed cost per transaction Rs. 500 Total cash required Rs. 1,200,000 Required: (i) (ii) (iii) Answer:1 Calculate the target (optimum) cash balance using the Baumol model What are the opportunity costs of holding cash, the trading cost (transaction cost) and the total cost? What would be the total annual cash requirement if the target cash balance is Rs.75,000? Ecq= 2*conversion cost*demand for cash/opportunity cost(in decimal form) 2x500x1,200,000/.12 = Rs. 100,000 The average cash balance will be Rs. 100,000/2=Rs. 50,000 no of transaction will be 12 Transaction cost 12x500=Rs and opportunity cost t Rs. 50,000X.12%=Rs.6000 Average cash balance Rs. 75,000/2=Rs the opportunity cost=rs.37, 500X.12%=Rs. 4,500 No transactions will be 4500/500=9 The annual requirement Rs. 75,000x9=675,000 Baumol model ECQ= 2 X 30 X Rs. 1,500,000 /.08 =Rs received each time the cash is replenished There will 45 conversions during the year Average cash balance will be Rs. 33,541/2=Rs.16, 770 Cost of conversion =45x30=Rs.1, 350 Opportunity cost=rs.16, 770x.08=Rs.1, 342 Total cost=rs.2, 692
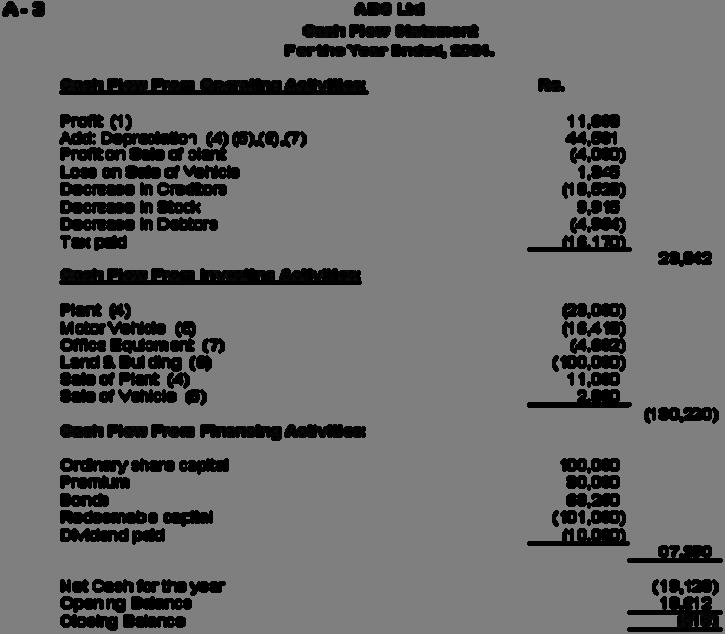
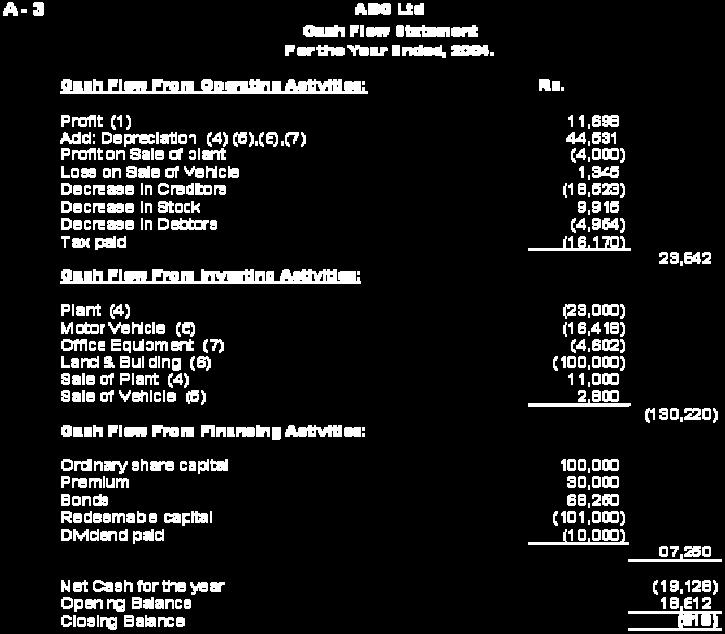
327
1 Cost Accounting - Basic Concepts & Treatment of Special Items
 1 Cost Accounting - Basic Concepts & Treatment of Special Items This Chapter Includes: Cost Accounting : Necessity & Importance; Cost Department, Costing System, Design of Forms & Records, Treatment of:
Introduction to Cost Accounting. Samir K Mahajan
 Introduction to Cost Accounting Samir K Mahajan MEANING OF COST, COSTING AND COS ACCOUNTING Cost is amount of resources given up in exchange for some goods and services. The resources given up are expressed
Introduction to Cost Accounting. Samir K Mahajan
 Introduction to Cost Accounting Samir K Mahajan MEANING OF COST, COSTING AND COS ACCOUNTING Cost is amount of resources given up in exchange for some goods and services. The resources given up are expressed
Introduction to Cost Accounting. Samir K Mahajan
 Introduction to Cost Accounting Samir K Mahajan MEANING OF COST, COSTING AND COS ACCOUNTING Cost is amount of resources given up in exchange for some goods and services. The resources given up are money
COST AND MANAGEMENT ACCOUNTING
 EXECUTIVE PROGRAMME COST AND MANAGEMENT ACCOUNTING SAMPLE TEST PAPER (This test paper is for practice and self study only and not to be sent to the institute) Time allowed: 3 hours Maximum marks : 100
ANIL SHARMA S CLASSES
 ANIL SHARMA S CLASSES {Marks: 100} (COSTING PAPER-FULL) {Time: 3 Hours} ----------------------------------------------------------------------------------------------------- Q-1: What is meant by cost
Managerial Accounting Prof. Dr. Varadraj Bapat School of Management Indian Institute of Technology, Bombay
 Managerial Accounting Prof. Dr. Varadraj Bapat School of Management Indian Institute of Technology, Bombay Module - 9 Lecture - 20 Accounting for Costs Dear students, in our last session we have started
1 Cost Accounting - Basic Concepts &
 1 Cost Accounting - Basic Concepts & Treatment of Special Items This Chapter Includes: Cost Accounting : Necessity & Importance; Cost Department, Costing System, Design of Forms & Records, Treatment of
COST C O S T COST 1/12/2011
 Chapter 3 COST CONCEPT AND DESIGN ECONOMICS C O S T Ir. Haery Sihombing/IP Pensyarah Fakulti Kejuruteraan Pembuatan Universiti Teknologi Malaysia Melaka COST Cost is not a simple concept. It is important
MANAGERIAL ACCOUNTING. 2 nd topic COST CLASSIFICATION
 MANAGERIAL ACCOUNTING 2 nd topic COST CLASSIFICATION Structureofthelecture2 2.1 Definition of cost and related terms 2.2 Types of cost classification 2.3 Identification of cost classification 2.4 Reporting
Chapter 02 - Cost Concepts and Cost Allocation
 Chapter 02 - Cost Concepts and Cost Allocation Student: 1. Product costs for a manufacturing company consist of direct materials, direct labor, and overhead. 2. Period cost and product cost are synonymous
Chapter 02 - Cost Concepts and Cost Allocation
 Chapter 02 - Cost Concepts and Cost Allocation Student: 1. Product costs for a manufacturing company consist of direct materials, direct labor, and overhead. 2. Period cost and product cost are synonymous
Question Paper Accounting For Decision Making - II (MB2D2): January 2009
: January 2009") Question Paper Accounting For Decision Making - II (MB2D2): January 2009 1. Prime cost plus variable overheads is Answer all 70 questions. Marks are indicated against each question. Total Marks : 100 Total
Question Paper Accounting For Decision Making - II (MB2D2): January 2009 1. Prime cost plus variable overheads is Answer all 70 questions. Marks are indicated against each question. Total Marks : 100 Total
B. Com (Hons.) III Semester Paper Title: Cost Accounting Paper Code: AS-2620
 III Semester Paper Title: Cost Accounting Paper Code: AS-2620") B. Com (Hons.) III Semester Paper Title: Cost Accounting Paper Code: AS-26 * Prepared by: Nilmani Tripathi, Assistant Professor, Department of Commerce, GGV Answer 1. Short answer question 1. Eight example
B. Com (Hons.) III Semester Paper Title: Cost Accounting Paper Code: AS-26 * Prepared by: Nilmani Tripathi, Assistant Professor, Department of Commerce, GGV Answer 1. Short answer question 1. Eight example
Full file at Chapter 02 - Basic Cost Management Concepts
 CHAPTER 2 BASIC COST MANAGEMENT CONCEPTS Learning Objectives 1. Explain what is meant by the word cost. 2. Distinguish among product costs, period costs, and expenses. 3. Describe the role of costs in
CHAPTER ONE: OVEVIEW OF MANAGERIAL ACCOUNTING
 CHAPTER ONE: OVEVIEW OF MANAGERIAL ACCOUNTING The Basic Objectives of Accounting Basic objective of accounting is to provide stakeholders with useful information about a business enterprise in order to
Full file at
 Chapter 2 Cost Concepts and Behavior rue/false Questions F 1. he cost of an item is the sacrifice made to acquire it. Answer: rue Difficulty: Simple Learning Objective: 1 F 2. A cost can either be an asset
COST C O S T COST. Cost is not a simple concept. It is important to distinguish between four different types - fixed,, variable, average and marginal.
 Ir. Haery Sihombing/IP Pensyarah Fakulti Kejuruteraan Pembuatan Universiti Teknologi Malaysia Melaka Chapter 3 DIRECT COST Chapter 4 INDIRECT COSTS C O S T COST Cost is not a simple concept. It is important
Relevant Costs for Decision Making
 Relevant Costs for Decision Making Chapter Thirteen 13-2 Learning Objective 1 Identify relevant and irrelevant costs and benefits in a decision. 13-3 Cost Concepts for Decision Making A relevant cost is
HUM 211: Financial & Managerial Accounting
 Chapter 20 HUM 211: Financial & Managerial Accounting Lecture 08: Managerial Accounting (Concepts & Principles) Masud Jahan Department of Science and Humanities Military Institute of Science and Technology
Chapter 2 - Basic Managerial Accounting Concepts
 1. It is beneficial to assign indirect costs to cost objects. True 2. Price must be greater than cost in order for the firm to generate revenue. False 3. Accumulating costs is the way that costs are measured
Model Answer / Suggested Solution. Subject: Financial and Cost Accounting
 Model Answer / Suggested Solution Code AR-7334 M.Com. II Semester Subject: Financial and Cost Accounting Que. 1. Short answers: i. Every businessman has to incur some expenses and he makes some income
Cost Behavior. Material Cost: Direct material: 1. seen in the final product 2. economic/visible to trace Indirect Material:
 1 Chapter 2 Introduction to Cost Terms and Purposes Cost A cost is the value of economic resources (e.g., money) sacrificed or used up to achieve a particular objective (e.g., produce a product or perform
Full file at
 Chapter 02 Cost Concepts and Behavior True / False Questions 1. The cost of an item is the sacrifice made to acquire it. True False 2. An expense is an expired cost matched with revenues in a specific
2 Cost Concepts and Behavior
 2 Cost Concepts and Behavior Solutions to Review Questions 2-1. Cost is a more general term that refers to a sacrifice of resources and may be either an opportunity cost or an outlay cost. An expense is
An accounting perspective: Business insight
 An accounting perspective: Business insight Engineers for automobile companies in the United States believe that Japanese manufacturers can build cars for considerably less than their US counterparts.
2 Cost Concepts and Behavior
 2 Cost Concepts and Behavior Solutions to Review Questions 2-1. Cost is a more general term that refers to a sacrifice of resources and may be either an opportunity cost or an outlay cost. An expense is
1 Cost Concept and Classification of Cost
 Star Rating On the basis of Maximum marks from a chapter On the basis of Questions included every year from a chapter On the basis of Compulsory questions from a chapter Nil Nil Nil 1 Cost Concept and
COST. Labour. Direct
 COMMERCIAL STUDIES STD: X Chapter 10. Fundamental Concepts of Cost Concept of Cost The term cost generally means the amount of expenditure (actual or notional) incurred on, or attributable to, a given
Chapter 02 Cost Concepts and Behavior
 Chapter 02 Cost Concepts and Behavior Solutions to Review Questions 2-1. Cost is a more general term that refers to a sacrifice of resources and may be either an opportunity cost or an outlay cost. An
10-1. Learning Objective. Identify relevant and irrelevant costs and benefits in a decision.
 10-1 Learning Objective Identify relevant and irrelevant costs and benefits in a decision. 10-2 Relevant Costs and Benefits A relevant cost is a cost that differs between alternatives. A relevant benefit
COST OF GOODS MANUFACTURED & SOLD STATEMENT
 COST OF GOODS MANUFACTURED & SOLD STATEMENT In order to understand the financial and cost statement of a concern we should clear about the procedure adopted by trading concern and manufacturing concern
TYPES OF COST CLASSIFICATIONS CLASSIFICATION BY BEHAVIOR
 18-11 C 2 Cost TYPES OF COST CLASSIFICATIONS CLASSIFICATION BY BEHAVIOR Cost Activity Activity Cost Cost behavior refers to how a cost will react to changes in the level of business activity. Total fixed
Cost concepts, Cost Classification and Estimation
 Cost concepts, Cost Classification and Estimation BY G H A N E N DR A F A G O Cost Concepts Cost refers the amount of expenses spent to generate product or services. Cost refers expenditure that may be
COST CONCEPTS Introduction: Cost: Types of cost: Direct cost or explicit cost:
 COST CONCEPTS Introduction: A firm carries out business to earn maximum profits. Profits are the revenues collected by a business firm after production and sale of their goods and services. But to gain
Chapter 02 Cost Concepts and Behavior
 Chapter 02 Cost Concepts and Behavior Solutions to Review Questions 2-1. Cost is a more general term that refers to a sacrifice of resources and may be either an opportunity cost or an outlay cost. An
LECTURE 10 DECISION MAKING
 LECTURE 10 DECISION MAKING INTRODUCTION TO DECISION MAKING Characteristics of Decision Information Information accumulated for decision-making will include many characteristics, but also some that are
1. The cost of an item is the sacrifice of resources made to acquire it. 2. An expense is a cost charged against revenue in an accounting period.
 Chapter 02 Cost Concepts and Behavior True / False Questions 1. The cost of an item is the sacrifice of resources made to acquire it. True False 2. An expense is a cost charged against revenue in an accounting
1 Introduction to Cost and Management Accounting
 1 Introduction to Cost and Management Accounting Concept of Cost Evolution of Cost Accounting Costing, Cost Accounting and Cost Accountancy Objectives, Importance and Scope of cost accounting Classifications
Institute of Certified Management Accountants of Sri Lanka Operational Level November 2018 Examination. Management Accounting (MA / OL 1-201)
") Copyright Reserved Serial No Institute of Certified Management Accountants of Sri Lanka Operational Level November 2018 Examination Examination Date : 17 th November 2018 Number of Pages : 06 Examination
Copyright Reserved Serial No Institute of Certified Management Accountants of Sri Lanka Operational Level November 2018 Examination Examination Date : 17 th November 2018 Number of Pages : 06 Examination
9.15 BOOKS RECOMMENDED
 241 5. What are the advantages of Cost Accounting? 6. What are the essentials of good costing system? 7. What are the various elements of costs? 8. Write short notes on: a) Cost centres b) Cost units c)
Basic Cost Management Concepts. M. En C. Eduardo Bustos as
 Basic Cost Management Concepts M. En C. Eduardo Bustos Farías as 1 Objectives 1. Explain what is meant by the word "cost." 2. Distinguish among product costs, period costs,, and expenses. 3. Describe the
Test Bank For Cost Accounting A Managerial Emphasis Fifth Canadian 5th Edition By Horngren Foster Datar And Gowing
 Test Bank For Cost Accounting A Managerial Emphasis Fifth Canadian 5th Edition By Horngren Foster Datar And Gowing Link full download: https://digitalcontentmarket.org/download/test-bank-for-cost-accounting-amanagerial-emphasis-fifth-canadian-5th-edition-by-horngren-foster-datar-andgowing/
Cost Accounting. Multiple Choice Questions:
 Multiple Choice Questions: 1- The Value Chain a- Involves external companies as well as internal activities. b- Is the sequence of business functions in which customer usefulness is added to products or
Chapter 2 Cost Classification & Cost Behaviour. Ibrahim Sameer (MBA - Specialized in Finance, B.Com Specialized in Accounting & Marketing)
") Chapter 2 Cost Classification & Cost Behaviour Ibrahim Sameer (MBA - Specialized in Finance, B.Com Specialized in Accounting & Marketing) Total Cost / Service Costs The total cost of making a product or
Chapter 2 Cost Classification & Cost Behaviour Ibrahim Sameer (MBA - Specialized in Finance, B.Com Specialized in Accounting & Marketing) Total Cost / Service Costs The total cost of making a product or
Identifying Relevant Costs. Identifying Relevant Costs. Identifying Relevant Costs. A relevant cost is a cost that differs between alternatives.
 Identifying Relevant Costs Relevant tcosts for Decision Making Cynthia, a Boston student, is considering visiting her friend in New York. She can drive or take the train. By car, it is 230 miles to her
Relevant Costs for Decision Making
 11-1 Management Accounting Lecture 17 (Chapter 11) Relevant Costs for Decision Making Today s Agenda Relevant Costs vs. Irrelevant Costs Differential Approach vs. Total Cost Approach Product Transfer Decision
Decision Making Using Cost Concepts and CVP Analysis
 2 Decision Making Using Cost Concepts and CVP Analysis Question 1 Panchwati Cement Ltd. produces 43 grade cement for which the company has an assured market. The output for 2004 has been budgeted at 1,80,000
COST AND CHAPTER 2 COSTING. LEARNING OBJECTIVES After completing this chapter learners would be able to: Define and classify of Food Cost
 CHAPTER 2 COST AND COSTING LEARNING OBJECTIVES After completing this chapter learners would be able to: (i) (ii) (iii) (v) Define and classify of Food Cost Understand Elements of food cost Explain Function
MBP1133 Managerial Accounting Prepared by Dr Khairul Anuar
 MBP1133 Managerial Accounting Prepared by Dr Khairul Anuar L2 Managerial Accounting and Costs Concepts www.notes638.wordpress.com 1 Summary of the Types of Cost Classifications Financial Reporting Predicting
Chapter 3--Product Costing: Manufacturing Processes, Cost Terminology, and Cost Flows
 Chapter 3--Product Costing: Manufacturing Processes, Cost Terminology, and Cost Flows Student: 1. Which of the following types of organizations is most likely to have a raw materials inventory account?
Chapter 02 - Cost Concepts and Behavior Solution manual for Fundamentals of Cost Accounting 4th by Lanen Anderson Maher
 Solution manual for Fundamentals of Cost Accounting 4th by Lanen Anderson Maher Link full download: http://testbankair.com/download/solution-manual-for-fundamentals-of-costaccounting-4th-by-lanen-anderson-maher/
Horngren's Financial & Managerial Accounting, 4e (Nobles) Chapter 16 Introduction to Managerial Accounting. Learning Objective 16-1
 Chapter 16 Introduction to Managerial Accounting. Learning Objective 16-1") Horngren's Financial & Managerial Accounting, 4e (Nobles) Chapter 16 Introduction to Managerial Accounting Learning Objective 16-1 1) Managerial accounting focuses on providing information for internal
Horngren's Financial & Managerial Accounting, 4e (Nobles) Chapter 16 Introduction to Managerial Accounting Learning Objective 16-1 1) Managerial accounting focuses on providing information for internal
CHAPTER 2 THEORITICAL FOUNDATION Definition of Cost As stated by Matz and Usry (1976:41), cost must be justified on relevant
, cost must be justified on relevant") CHAPTER 2 THEORITICAL FOUNDATION 2.1. Definition of Cost As stated by Matz and Usry (1976:41), cost must be justified on relevant facts, competently observed and considerably measured to facilitate management
CHAPTER 2 THEORITICAL FOUNDATION 2.1. Definition of Cost As stated by Matz and Usry (1976:41), cost must be justified on relevant facts, competently observed and considerably measured to facilitate management
DEFINITIONS AND CONCEPTS
 DEFINITIONS AND CONCEPTS ** CONCEPTS AND DEFINITIONS IN THIS MODULE APPEAR IN VARIOUS CHAPTERS ** Key Terms and Concepts to Know Major Management Activities Planning - formulating long and short-term plans
Chapter 2--Product Costing: Manufacturing Processes, Cost Terminology, and Cost Flows
 Chapter 2--Product Costing: Manufacturing Processes, Cost Terminology, and Cost Flows Student: 1. Which of the following types of organizations is most likely to have a raw materials inventory account?
1). Fixed cost per unit decreases when:
. Fixed cost per unit decreases when:") 1). Fixed cost per unit decreases when: a. Production volume increases. b. Production volume decreases. c. Variable cost per unit decreases. d. Variable cost per unit increases. 2). Prime cost + Factory
1). Fixed cost per unit decreases when: a. Production volume increases. b. Production volume decreases. c. Variable cost per unit decreases. d. Variable cost per unit increases. 2). Prime cost + Factory
III B.Com [ ] Semester V Core: Cost Accounting 502C Multiple Choice Questions.
![III B.Com [ ] Semester V Core: Cost Accounting 502C Multiple Choice Questions.](/thumbs/81/83995654.jpg "III B.Com [ ] Semester V Core: Cost Accounting 502C Multiple Choice Questions.") 1 of 36 8/28/2013 10:47 PM Dr.G.R.Damodaran College of Science (Autonomous, affiliated to the Bharathiar University, recognized by the UGC)Reaccredited at the 'A' Grade Level by the NAAC and ISO 9001:2008
1 of 36 8/28/2013 10:47 PM Dr.G.R.Damodaran College of Science (Autonomous, affiliated to the Bharathiar University, recognized by the UGC)Reaccredited at the 'A' Grade Level by the NAAC and ISO 9001:2008
Standard Costing and Variance Analysis
 5 Standard Costing and Variance Analysis Standard Costing and Variance Analysis 5 LEARNING OUTCOMES After completing this chapter, you should be able to: explain the difference between ascertaining costs
Chapter 02 Cost Terminology and Cost Behaviors. Lecture Outline. LO.1 Why are costs associated with a cost object? A. Introduction
 Solution Manual for Cost Accounting Foundations and Evolutions 8th Edition by Kinney and Raiborn Link full download of Solution Manual: https://digitalcontentmarket.org/download/solution-manual-for-costaccounting-foundations-and-evolutions-8th-edition-by-kinney-and-raiborn/
Chapter #2: Cost Concepts and Design Economics
 ENGINEERING ECONOMY Chapter #2: Cost Concepts and Design Economics By: Eng. Ahmed Y Manama Outline Fixed, Variable, and Incremental Cost Recurring and Nonrecurring Costs Direct, Indirect and Overhead Costs
Part 1 Study Unit 6. Cost Allocation Techniques Jim Clemons, CMA
 Part 1 Study Unit 6 Cost Allocation Techniques Jim Clemons, CMA Absorption versus Variable Costing You need to be able to answer the following: Under absorption costing, which cost are considered product
LOYOLA COLLEGE (AUTONOMOUS), CHENNAI
, CHENNAI") LOYOLA COLLEGE (AUTONOMOUS), CHENNAI 600 034 B.Com. DEGREE EXAMINATION CORPORATE SECRETARYSHIP FOURTH SEMESTER APRIL 2016 BC 4504/BC 5501 COST ACCOUNTING Date: 22-04-2016 Dept. No. Max. : 100 Marks Time:
LOYOLA COLLEGE (AUTONOMOUS), CHENNAI 600 034 B.Com. DEGREE EXAMINATION CORPORATE SECRETARYSHIP FOURTH SEMESTER APRIL 2016 BC 4504/BC 5501 COST ACCOUNTING Date: 22-04-2016 Dept. No. Max. : 100 Marks Time:
Cost Terms, Concepts and Classifications
 Cost Terms, Concepts and Classifications 2 Cost, a frequently used word in all types of organizationsmanufacturing, non-manufacturing, business, service and retail. The process of management functions
Link full download Test bank:
 Solution manual for Fundamentals of Cost Accounting 4th by William N. Lanen, Shannon Anderson, Michael W Maher Link full download Solutions: http://testbankcollection.com/download/solutionmanual-for-fundamentals-of-cost-accounting-4th-bylanen-anderson-maher/
CHAPTER 1 BASIC COST CONCEPTS 1. BASICS
 CHAPTER 1 BASIC COST CONCEPTS 1. BASICS 1. Define the term Cost. Compare it with Value and Price. 1) Meaning of Cost: (a) Cost refers to the expenditure incurred in producing a product or in rendering
UCP51 COST ACCOUNTING-I UNIT-I COST ACCOUNTING & COST SHEET Type: 20% Theory 80% Problem Question & Answers
 ACADEMIC YEAR: 2016 2017 REGULATION CBCS - 2012 UCP51 COST ACCOUNTING-I UNIT-I COST ACCOUNTING & COST SHEET Type: 20% Theory 80% Problem Question & Answers PART A ANSWERS 1.What is meant by cost accounting?
1. F; I 2. V ; D 3. V ; D 4. F; I 5. F; I 6. F; I 7. V ; D 8. F; I 9. F; I 10. V ; D 11. F; I 12. F; I 13. F; I 14. F; I
 SOLUTIONS TO EERCISES EERCISE 2-1 (15 minutes) 1. F; I 2. V ; D 3. V ; D 4. F; I 5. F; I 6. F; I 7. V ; D 8. F; I 9. F; I 10. V ; D 11. F; I 12. F; I 13. F; I 14. F; I EERCISE 2-2 (15 minutes) 1. Product
MARGINAL COSTING CATEGORY A CHAPTER HIGH MARKS COVERAGE IN EXAM
 1 MARGINAL COSTING CATEGORY A CHAPTER HIGH MARKS COVERAGE IN EXAM Question 1 Arnav Ltd. manufacture and sales its product R-9. The following figures have been collected from cost records of last year for
Which of the following is correct? Select correct option: Units sold=opening finished goods units + Units produced Closing finished goods units Units
 Which of the following is correct? Units sold=opening finished goods units + Units produced Closing finished goods units Units Sold = Units produced + Closing finished goods units - Opening finished goods
INTER CA MAY PAPER 3 : COST AND MANAGEMENT ACCOUTING Branch: Multiple Date: Page 1
 INTER CA MAY 2018 PAPER 3 : COST AND MANAGEMENT ACCOUTING Branch: Multiple Date: Note: Question 1 is compulsory. Attempt any five from the rest. Note: All questions are compulsory. Question 1 (5 Marks
Welcome to: FNSACC507A Provide Management Accounting Information
 Welcome to: FNSACC507A Provide Management Accounting Information Week 1 Chapter 1 COST CONCEPTS FNSACC507A Provide Management Accounting Information By the end of this lesson, you will be able to 1. Explain
COSTING- THEORY. Page 1
 COSTING- THEORY CHAPTER-1 Basic Concepts & Product Cost sheet Q1. Define Cost Accounting, its advantages and limitation? Cost Accounting: Cost accounting is accounting for cost, aimed at providing cost
SCHOOL OF ACCOUNTING AND BUSINESS BSc. (APPLIED ACCOUNTING) GENERAL / SPECIAL DEGREE PROGRAMME
 GENERAL / SPECIAL DEGREE PROGRAMME") All Rights Reserved No. of Pages - 13 No of Questions - 07 SCHOOL OF ACCOUNTING AND BUSINESS BSc. (APPLIED ACCOUNTING) GENERAL / SPECIAL DEGREE PROGRAMME YEAR I SEMESTER I (INTAKE VI GROUP A) END SEMESTER
All Rights Reserved No. of Pages - 13 No of Questions - 07 SCHOOL OF ACCOUNTING AND BUSINESS BSc. (APPLIED ACCOUNTING) GENERAL / SPECIAL DEGREE PROGRAMME YEAR I SEMESTER I (INTAKE VI GROUP A) END SEMESTER
a) Describe the main factors in classifying costs as either relevant or irrelevant for management decision-making purposes.
 Describe the main factors in classifying costs as either relevant or irrelevant for management decision-making purposes.") Chapter 5 Solutions Solution 5.1 a) Describe the main factors in classifying costs as either relevant or irrelevant for management decision-making purposes. The function of decision-making is to select
Chapter 5 Solutions Solution 5.1 a) Describe the main factors in classifying costs as either relevant or irrelevant for management decision-making purposes. The function of decision-making is to select
B.Com II Year (Hons.) Cost Accounting Model Paper I
 Cost Accounting Model Paper I") Max. Marks: 100 B.Com II Year (Hons.) Cost Accounting Model Paper I Durations: 3 Hrs. Attempt all the questions. All Questions are compulsory, each question carry 20 marks. Unit I 1. A Ltd. Is the manufacturer
Max. Marks: 100 B.Com II Year (Hons.) Cost Accounting Model Paper I Durations: 3 Hrs. Attempt all the questions. All Questions are compulsory, each question carry 20 marks. Unit I 1. A Ltd. Is the manufacturer
DECISION MAKING. Key Terms and Concepts to Know
 DECISION MAKING Key Terms and Concepts to Know Relevance: Relevant costs and benefits are those that differ among alternatives Total approach vs. differential approach and why relevant costs must be isolated.
Test Bank Horngren's Financial & Managerial Accounting The Managerial Chapters 5th Edition Miller-Nobles
 Test Bank Horngren's Financial & Managerial Accounting The Managerial Chapters 5th Edition Miller-Nobles TEST BANK for Horngren's Financial & Managerial Accounting The Managerial Chapters 5th Edition by
Full file at
 02 Student: 1. All costs incurred in a merchandising firm are considered to be period costs. True False 2. Amortization is always considered a product cost for external financial reporting purposes in
SM-Ch02-5e.pdf Lanen_5e_IM_Ch_02.pdf Chapter 02 - Solutions.pdf Lanen_02_Instructor_Final.pdf Chapter 02.pdf
 SM-Ch02-5e.pdf Lanen_5e_IM_Ch_02.pdf Chapter 02 - Solutions.pdf Lanen_02_Instructor_Final.pdf Chapter 02.pdf 2 Cost Concepts and Behavior Solutions to Review Questions 2-1. Cost is a more general term
Overheads/Job and Batch Costing. RST Ltd. has two production departments Machining and Finishing. There are three service
 CA R. K. Mehta Overheads/Job and Batch Costing CA Past Years Exam Question Question : 1 Nov, 2006 RST Ltd. has two production departments Machining and Finishing. There are three service departments Human
(ALL BATCHES) DATE: MAXIMUM MARKS: 100 TIMING: 3¼Hours
 DATE: MAXIMUM MARKS: 100 TIMING: 3¼Hours") (ALL BATCHES) DATE: 20.09.2018 MAXIMUM MARKS: 100 TIMING: 3¼Hours PAPER 3 : COST ACCOUNTING Answer to questions are to be given only in English except in the case of candidates who have opted for Hindi
(ALL BATCHES) DATE: 20.09.2018 MAXIMUM MARKS: 100 TIMING: 3¼Hours PAPER 3 : COST ACCOUNTING Answer to questions are to be given only in English except in the case of candidates who have opted for Hindi
10 hour 6 hour. 5 hour 3 hour
 Absorption and Marginal Costing HKDSE (2017, 6) (Cost-Volume-profit analysis) Nice Company commenced business on 1 January 2016. It produces a single product, M1. The income statement for the year ended
Inventory Cost Accounting Tips and Tricks. Nick Bergamo, Senior Manager Linda Pei, Senior Manager
 1 Inventory Cost Accounting Tips and Tricks Nick Bergamo, Senior Manager Linda Pei, Senior Manager 2 Disclaimer The material appearing in this presentation is for informational purposes only and is not
Management Accounting
 Management Accounting Suggested Solutions to Practice Questions Professional, Practical, Proven www.accountingtechniciansireland.ie Table of Contents Part 1:... 2 Part 2:... 8 Part 3:... 14 Part 4:...
IPCC, Paper 3, Costing, Chapter 4 B.N.Pattabhi., M.Com, FCA
 IPCC, Paper 3, Costing, Chapter 4 B.N.Pattabhi., M.Com, FCA Dedicated to my Noble, Ever Loving, Ever Inspiring Parents Lalitamma & Nanjappa 1 2 3 4 5 Understanding the Meaning of Overheads Difference between
The following are all product costs except: a. Direct materials b. Factory overhead c. Direct labor d. Sales and administrative expenses
 1 MULTIPLE CHOICE 1-2 I certify that I am taking this assessment alone and that I am receiving no help with it except through the use of my textbook and notes. I have not been given the questions in advance.
Exemplar for Internal Achievement Standard. Accounting Level 3
 Exemplar for Internal Achievement Standard Accounting Level 3 This exemplar supports assessment against: Achievement Standard 91409 Demonstrate understanding of a job cost subsystem for an entity An annotated
Gatsby s Accounting System and Policies Designed by Regina Rexrode Copyright - Armond Dalton
 Gatsby s Accounting System and Policies a Images used on the front cover and throughout this book were obtained under license from Shutterstock.com 2017, by Armond Dalton Publishers, Inc. All rights reserved.
Chapter 2--Measuring Product Costs
 Chapter 2--Measuring Product Costs Student: 1. Which of the following is notone of the three major manufacturing cost categories? A. Direct materials costs that can be easily traced to a product B. Direct
Section A: Summary Content Notes
 COST ACCOUNTING 30 JULY 2015 Section A: Summary Content Notes MANUFACTURING ACCOUNTS: NEW LEDGER ACCOUNTS New Ledger Accounts pertaining to manufacturing concerns are divided into the following categories:
Full file at
 Chapter 2 Job Order Costing ANSWERS TO QUESTIONS 1. The difference between job order costing and process costing relates to the type of product or service the company provides, and whether that product
Cost Accounting: A Managerial Emphasis, 16e, Global Edition (Horngren) Chapter 2 An Introduction to Cost Terms and Purposes
 Chapter 2 An Introduction to Cost Terms and Purposes") Cost Accounting: A Managerial Emphasis, 16e, Global Edition (Horngren) Chapter 2 An Introduction to Cost Terms and Purposes 2.1 Objective 2.1 1) Which of the following would be considered an actual cost
Cost Accounting: A Managerial Emphasis, 16e, Global Edition (Horngren) Chapter 2 An Introduction to Cost Terms and Purposes 2.1 Objective 2.1 1) Which of the following would be considered an actual cost
Costing of Service Sector
 6 Costing of Service Sector LEARNING OBJECTIVES After finishing this chapter, you will be able to understand and appreciate the peculiarities involved in the costing of service sector. Through this chapter
COST SHEET. Samir K Mahajan
 COST SHEET Samir K Mahajan COMPONENTS OF TOTAL COST Prime cost: It is the aggregate of direct material cost, direct labour cost and direct expenses. Prime cost or Direct cost = Direct materials + Direct
Financial Accounting and Auditing Paper-III Financial Accounting
 Revised Syllabus of the Courses of B.Com. Programme at T.Y.B.Com. with Effect from the Academic Year 2015-2016 for IDOL Students Financial Accounting and Auditing Paper-III Financial Accounting SECTION
Code No. : 5728 Sub. Code : C 41 K/CCA 41
 (8 pages) Reg. No. :... Sub. Code : C 41 K/CCA 41 M.Com. (CBCS) DEGREE EXAMINATION, APRIL 2015. Fourth Semester Commerce/Commerce with Computer Application ADVANCED COST ACCOUNTING (For those who joined
UNIT 8 COST CONCEPTS AND ANALYSIS I
 UNIT 8 COST CONCEPTS AND ANALYSIS I Objectives After going through this unit, you should be able to: understand some of the cost concepts that are frequently used in the managerial decision making process;