dbaccess Global Consumer Conference
|
|
|
- Muriel Rich
- 5 years ago
- Views:
Transcription


1 dbaccess Global Consumer Conference Edgewell Personal Care Company 14 June 2017 Page 1
2 Agenda Strategic Overview Strategic Growth Initiatives Fuel Growth and Margin Expansion David Hatfield Colin Hutchison Sandy Sheldon Page 2
3 Forward-Looking Statements Unless the context otherwise requires, references in this presentation to Edgewell, we, our, and the Company refer to Edgewell Personal Care Company, a Missouri corporation, and its consolidated subsidiaries. Forward-looking statements are not based on historical facts but instead reflect the Company's expectations, estimates or projections concerning future results or events, including, without limitation, the future earnings and performance of the Company or any of its businesses. These statements are not guarantees of performance and are inherently subject to known and unknown risks, uncertainties and assumptions that are difficult to predict and could cause the Company's actual results to differ materially from those indicated by those statements. The Company cannot assure you that any of its expectations, estimates or projections will be achieved. The forward-looking statements included in this presentation are only made as of the date of this presentation and the Company disclaims any obligation to publicly update any forward - looking statement to reflect subsequent events or circumstances. Numerous factors could cause the Company's actual results and events to differ materially from those expressed or implied by forward -looking statements. In addition, other risks and uncertainties not presently known to the Company or that it considers immaterial could affect the accuracy of any such forward-looking statements. All forward-looking statements should be evaluated with the understanding of their inherent uncertainty. Additional risks and uncertainties include those detailed from time to time in the Company's publicly filed documents, including the Company's annual report on Form 10 -K for the year ended September 30, 2016 and its quarterly reports on Form 10-Q for the quarters ended December 31, 2016, and March 31, Page 3
4 Non-GAAP Financial Measures While the Company reports financial results in accordance with accounting principles generally accepted in the U.S. ( GAAP ), this presentation also includes non-gaap measures. These non-gaap measures are generally referred to as adjusted or organic and exclude various items, which can include the impact of changes in foreign currency, the impact of acquisitions and dispositions, the impact of deconsolidation of the Company s Venezuelan operations, spin costs and restructuring charges. This Non-GAAP information is provided as a supplement to, not as a substitute for, or as superior to, measures of financial performance prepared in accordance with GAAP. The Company uses this Non-GAAP information internally to make operating decisions and believes it is helpful to investors because it allows more meaningful period-to-period comparisons of ongoing operating and provides insights into future performance. The information can also be used to perform analysis and to better identify operating trends that may otherwise be masked or distorted by the types of items that are excluded. The Company also believes that providing this information provides a higher degree of transparency. This presentation includes references to organic net sales, underlying net sales, go-to-market impacts, adjusted operating margin, adjusted EPS, free cash flow and working capital. For definitions of these terms and reconciliations to GAAP measures, refer to the Company s earnings release for the second quarter of the 2017 fiscal year and other materials that can be found on its Investor Relations website at Page 4
5 Overview We successfully spun-off Energizer Holdings in July We met our operational and financial objectives for fiscal For fiscal 2017, we expect adjusted EPS and adjusted operating margin to be in line with our financial algorithm*. The rapid transformation of CPG brings both disruption and opportunity. We are shifting the Company s focus, investments and organization to capture new growth opportunities. Edgewell is committed to its long term financial algorithm. * As of 4/02/17 Earnings Release Page 5


6 Edgewell Personal Care Attractive Categories Strong Brands 2016 Sales by Segment $2.4B Category Brands Key Geographies 6% Wet Shave US, Canada, Japan, Germany 18% 16% 60% Sun & Skin Care Feminine Care US, Mexico, Australia, UK US and Canada Infant & Other US and Canada Wet Shave Sun & Skin Care Feminine Care Infant & Other Page 6
7 2016: Met the Challenge in First Fiscal Year as a Standalone Personal Care Company 2016 Priorities: A Transition Year Fiscal 2016 Financial Results Go to market changes Segment Sales and Share Improvement Align Teams Around New Structure & Priorities Solidify North America Business Continue International Expansion Reported Sales -2.4% Organic Sales (1) +1.4% Underlying Sales(2) +2.8% North America + 1.7% International + 5.0% GAAP EPS $2.99 Adjusted EPS $3.57 Fiscal 2016 top and bottom line results exceeded expectations (1) Organic net sales exclude a -1.1% impact of currency movement and a -2.7% impact of Venezuela deconsolidation and Industrial sale charges (2) Underlying net sales also exclude a -1.4% impact of the Company s go-to-market initiative Page 7

8 Challenge To Win Edgewell s Long Term Financial Algorithm: + 2-3% Organic Net Sales growth + 50 Basis Points Adjusted Operating Margin Improvement High Single Digit Adjusted EPS growth 100%+ Earnings to Free Cash Flow Conversion Vision We will be the trailblazing personal care company leveraging our colleagues creativity and passion to challenge convention and drive growth Mission We will win through focus, insightful innovation and agility; delivering better solutions to our consumers and customers Page 8

9 Challenge To Win Deliver Algorithm Portfolio Objectives Grow Wet Shave 2-3% Organically through International Growth and Share Improvement Grow Sun and Skin 4-5% Organically through International Expansion and Category Growth In Feminine Care and Infant / Other, Improve Profit and Expand Margins Page 9

10 A Rapidly Changing CPG Landscape Which Brings Disruption and Opportunity Macroeconomics Greater uncertainty in trade Strengthening U.S. dollar Continued deceleration across traditional channels Rise of Micro brands Consumer Big middle continues to erode - Purchasing power to older, younger - Urban, diverse consumers Technologically empowered consumers - Customization / personalization - Always on instant info and access Competition Price and Promotional Intensity On-line Shave Clubs Shave Club expansion into brick and mortar - Downward pricing pressure - Shrinking shelf space Customer Online retail projected to be the #1 format by 2021 Shrinking physical retail square footage Greater consolidation of top 10 retailers: Alibaba, Wal-Mart, Amazon Page 10
 Enhance Organizational Capabilities 5) Drive Productivity and Cost Reduction")
11 Edgewell Strategic Plan Pillars Focus on the Fundamentals 1) Build Strong Brands 2) Deliver Category Solutions Re-configure into Growth Opportunities 3) Shift Investments and Resources to Capture New Growth Fuel Growth and Margin Expansion 4) Enhance Organizational Capabilities 5) Drive Productivity and Cost Reduction Page 11


12 Focus on the Fundamentals 1) Build Strong Brands Grow our Brand Equity consistently over time Strengthen capabilities in digital and social marketing Launch compelling new product innovation Page 12
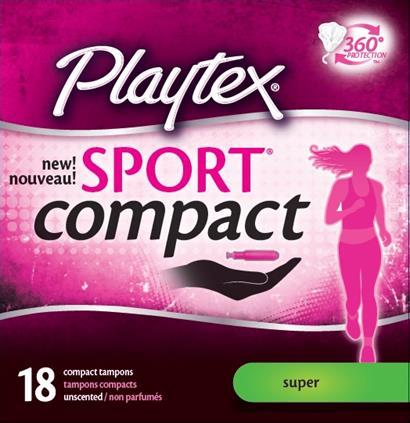
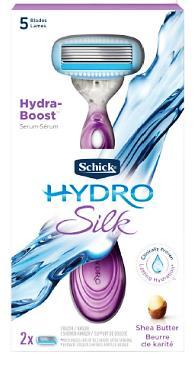


13 Launch Compelling Innovation Focus on the Fundamentals ** NEW in 2017 ** Page 13


14 Focus on the Fundamentals 2) Deliver Category Solutions Leverage full portfolio in Wet Shave Execute category visions in Fem Care and Infant Drive category growth in Sun and Skin Care Achieve Superior Reliability Exceed our customer s expectations Page 14

15 Leverage Full Portfolio Focus on the Fundamentals Edgewell is Uniquely Positioned to Leverage Its Full Portfolio in Wet Shave to drive holistic category solutions with retailers Branded Men s System Execute category visions in Fem Care and Infant Branded Women s System Branded Disposables Private Label Page 15
16 Leverage Full Portfolio Focus on the Fundamentals 2016 Global Sales Mix: Wet Shave Full Portfolio Supports 2-3% Organic EPC Growth Objective 19 % 12% 25% Drivers of Growth Innovation International Growth 24% 20% Geo Mix* N.A. 49% Inter. 51% Private Label New e-commerce Offerings Growth Channels Men's Systems Women's Systems Disposables Private Label Shave Prep * N.A. includes US and Canada, Inter. includes all other Page 16
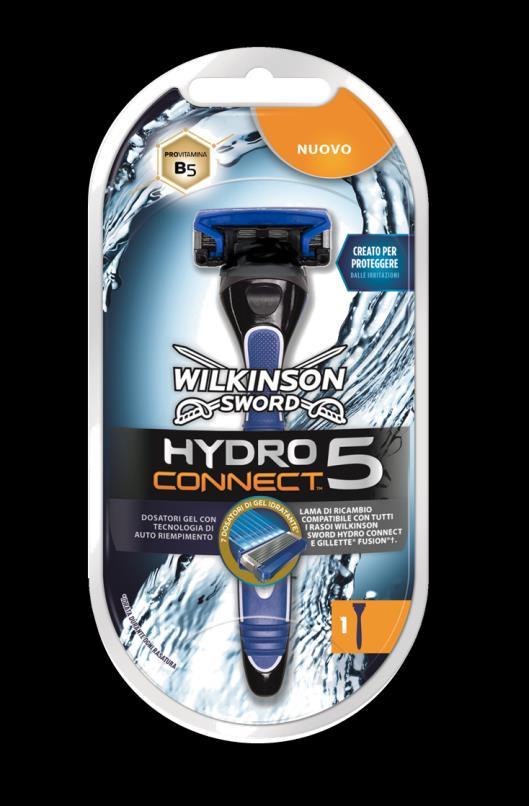
17 Leverage Full Portfolio Focus on the Fundamentals 2016 Global Sales Mix: Wet Shave Primary Impact of Competitive Price Actions International Men's Systems Women's Systems Private Label NA Men s 9%* NA Men's Systems Disposables Shave Prep Strengthen Competitive Position in Men s Wet Shave Launched Compelling Innovation and Value Ex. Hydro Connect Launched a Competitive Direct to Consumer Site Leveraging Private Label Increased Promotional Spend as Needed * N.A. includes US and Canada Page 17
 Shift")


18 Re-configure into Growth Opportunities 3) Shift Investments and Resources to Capture New Growth Accelerate growth in e-retail Leverage acquisitions to enter new growth categories Exploit opportunities in growth channels Expand international footprint/scale Page 18


19 Accelerate Growth in e-retail Re-configure into Growth Opportunities Razors & Blades e-retail Market ($MM) China U.S. $789 Western Europe $401 $237 $187 $88 $83 Online Penetration % 43% 10% 20% 8% 15% Note: China estimates split across T-mall, e-tailers, brick & click for DTC, Pure Play, Omni-Channel respectively Source: Slice, Euromonitor, Accenture Analysis Page 19

20 Accelerate Growth in e-retail Re-configure into Growth Opportunities Launched DTC Site in May ** NEW in 2017 ** Page 20


21 Accelerate Growth in e-retail Re-configure into Growth Opportunities Launched Hydro Connect in May ** NEW in 2017 ** Schick Hydro Connect TM Landing Page Schick Hydro Connect TM Video Ad Page 21

22 Accelerate Growth in e-retail Re-configure into Growth Opportunities Launched Amazon Home Page ** NEW in 2017 ** Page 22

23 Accelerate Growth in e-retail Launched TMall Flagship Store in March ** NEW in 2017 ** Re-configure into Growth Opportunities Page 23


24 Leverage Acquisitions Re-configure into Growth Opportunities ** NEW in 2017 ** Page 24


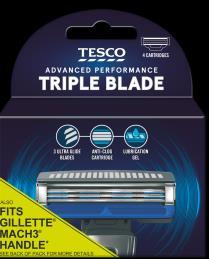
25 Expand in International Re-configure into Growth Opportunities ** NEW in 2017 ** Launched Hydro Connect in Italy Launched Hydro Connect in Central Europe Launched T-Mall site in China Launched Fits3 in International Launched Banana Boat in Spain Page 25
 Enhance")


26 Fuel Growth and Margin Expansion 4) Enhance Organizational Capabilities Expand ownership culture Put people development at the heart of Edgewell Improve colleague engagement Embed targeted organizational capabilities Page 26
 Drive")


27 Fuel Growth and Margin Expansion 5) Drive Productivity and Cost Reduction Strengthen Marketing and Trade Spend ROI COGS & Supply Chain optimization Embed ZBS philosophy and drive savings Gain an advantage in working capital management Page 27
28 Long-Term Objectives Areas of Focus Productivity and Cost Reduction Roadmap Fuel Growth and Margin Expansion 60% of Total Spending 23% of Total Spending 17% of Total Spending COGS/Supply Chain Commercial / R&D SG&A Global Footprint Initiatives Trade Spend Productivity Procurement Initiatives Procurement Initiatives Brand Investment Effectiveness ZBS/ZBB ZBS/ZBB R&D Effectiveness ERP enhancements ERP enhancements Procurement Initiatives ZBS/ZBB +50 Basis Point Adjusted Operating Margin Expansion Per Year Page 28
29 Embed ZBS Philosophy and Drive Savings Fuel Growth and Margin Expansion Embed Cost Conscious Culture Lower costs Eliminate non-productive spend; improve ROI Improve visibility, accountability, ownership Develop organizational capability to continue ZBS as a sustainable way of doing business $45m $40m $35m $30m $25m $20m $15m $10m Two-Year Net Savings Commitment $35-45 million Estimated FY17 Net Savings $5m Progress through Q2 FY17 $0 Page 29
30 COGS & Supply Chain Optimization Fuel Growth and Margin Expansion Current Restructuring Initiatives Rationalization and Streamlining of Global Operating Facilities Feminine Care Manufacturing Consolidation from Montreal to Dover, U.S. Wet Shave Footprint Optimization in North America and Europe Sun Care Insourcing in North America Savings Through FY 2016: $128 million USD Estimated FY17 Savings: $20-25 million USD Estimated FY18/19 Savings: $20-25 million USD Estimated Total Project Savings: $ million USD Page 30
31 Fuel Growth and Margin Expansion Meeting our Financial Algorithm A Systematic Approach to Cost Savings Strong Execution on Mix Management, Pricing, and Trade Up through the entire portfolio Improving Trade and Marketing Spend ROI Investment Behind our Growth Initiatives A Balanced Approach to Investment and Margin Expansion Drive 50 BPS Adjusted Operating Margin Expansion Annually Invest for Growth: 2-3% Organic topline Annually Page 31
32 Working Capital Management Fuel Growth and Margin Expansion 22.9% Actions 16.6% 17.5% 16.1% Significant sustained improvement from FY11 baseline Opportunities remain over medium term to reduce inventory, improve efficiency FY11 Baseline FY14 FY15 FY16 LT Trend Page 32
33 Edgewell s Long Term Investment Case Goals: Meet our Long Term Financial Algorithm + 2-3% Organic Net Sales growth + 50 BPS Adjusted Operating Margin Improvement High Single Digit Adjusted Diluted EPS growth 100%+ Earnings to Free Cash Flow Conversion Fuel Growth - Colleague Engagement - Enhance Organizational Capabilities - Systematic Cost reduction - ZBS, Productivity Focus on the fundamentals - Build Brand Equity/ Consumer Engagement - Compelling Innovation - Leverage the Full Portfolio - Category Solutions Re-configure into Growth Opportunities - Grow share in E-Retail, Growth Channels - Expand International footprint / scale - Build E-Comm & Digital Capabilities - Enter new growth Categories via M&A Page 33
34 dbaccess Global Consumer Conference Q&A Page 34