Evaluation of Agricultural Business Climate Index in Ukraine
|
|
|
- Leslie Blair
- 5 years ago
- Views:
Transcription
1 At the Institute for Economic Research and Policy Consulting Agricultural Policy Report APD/APR/05/2017 Evaluation of Agricultural Business Climate Index in Ukraine Klaus Wohlrabe, Ifo Institute Leibniz-Institute for Economic Kyiv, May 2017
2 About the Project German-Ukrainian Agricultural Policy Dialogue (APD) The project German-Ukrainian Agricultural Policy Dialogue (APD) started 2006 and is supported up to 2018 by the Federal Ministry of Food and Agriculture of Germany (BMEL). On behalf of BMEL, it is carried out by the mandatary, GFA Consulting Group GmbH, and a working group consisting of IAK AGRAR CONSULTING GmbH (IAK), Leibniz-Institut für Agrarentwicklung in Transformationsökonomien (IAMO) and AFC Consultants International GmbH. Project executing organization is the Institute of Economic Research and Policy Consulting in Kyiv. The APD cooperates with the BVVG Bodenverwertungs- und -verwaltungs GmbH on the implementation of key components related to the development of an effective and transparent land administration system in Ukraine. Beneficiary of the project is the Ministry of Agrarian Policy and Food of Ukraine. In accordance with the principles of market economy and public regulation, taking into account the potentials, arising from the EU-Ukraine Association Agreement, the project aims at supporting Ukraine in the development of sustainable agriculture, efficient processing industries and enhancing its competitiveness on the world market. With regard to the above purpose, mainly German, but also East German and international, especially EU experience are provided by APD when designing the agricultural policy framework and establishing of relevant institutions in the agriculture sector of Ukraine. Author: Klaus Wohlrabe wohlrabe@ifo.de 2016 German-Ukrainian Agricultural Policy Dialogue All rights reserved. 2
3 Content 1. Background Review of the methodology A look at the results Critique and suggestions for further improvements General Issues Survey Programme Aggregation Issues Public Relations What is next? Appendix: Example of a Press Release
4 1. Background Agricultural Business Climate (ABI henceforth) is an ambitious project to monitor the agricultural sector in the Ukraine. Until now six surveys have been conducted. In this report I review the all aspects of the ABI. First, I summarize the basic methodology of the ABI which builds upon the idea of the ifo survey in Germany. I continue with a short look of the results and uncover some facts. Then I provide detailed feedback on the methodology of the survey. I comment both on the questionnaire and the aggregation. For both aspects there space for improvements. I will also provide support how to write a press release. Finally, I summarize the report shortly by stating the four most important to-dos. 2. Review of the methodology 1. The Agricultural Business Climate (ABI henceforth) builds is a survey among agricultural producers in the Ukraine. Its aim is to provide insights to policy decision makers as well as to the business community. 2. The general methodology builds upon the survey framework of the ifo Institute in Munich. The ifo started its surveys in 1949 for the industry sector. The term Business Climate was introduced in Its original intention was to link the present and the future by combining the two main questions from the questionnaire: the current business situation and the expectations for the next six months. 3. The questionnaire consists in total of 22 questions: 11 refer to the current situation and 11 to the future. The latter ones are expectations whereas the former are actual assessments. The expectations questions refer to the next 12 months not to 6 months as in the ifo case. 4. The survey is implemented via telephone interviews. No printed or online questionnaires are used. 5. The level of aspired units is 400, which is considered to be sufficient for statistical reliable results. 6. There are three clusters: regions (4), ownership (4) and specialization (2). The specialization does not apply to private households. Given different levels of aggregation 34 indices for each question can be calculated. 7. The number of respondents is drawn from the population given the relative shares of the clusters in the agricultural GDP. 8. All questions use a three-answer-scale: positive, neutral and negative. 9. The microdata aggregated using the balance score, where the share of negative answers is subtracted from the corresponding share of positive answers. 10. For publication purposes an index is calculated which rebases the balances statistics to the starting value. It is supposed to be used for comparison reasons. 11. No weighting of the individual survey unit is employed. 12. There are two main indices: The Business Climate, which is the geometric mean of the current situation and the expectation balance indicator and Business Index which relates the latest observation to the first published value. 4
5 3. A look at the results 1. I was able to reconstruct the basic results with a different programme (Matlab). 2. There seems to be a seasonal component. The balances seem to drop every year in February. This might be to whether conditions. In the future when a longer time series is available then seasonal adjustment should be considered. The dummy approach could be useful for that. One should have at least 4 years of observations before seasonal adjustment can be applied. 3. It is eye-catching that the results between assessment and expectations are in many cases quite similar. This point to the fact that the respondents give the same answer to each question. In some cases this might be due to structural problems in the questionnaire (see the corresponding chapter). It should be supervised in the near future whether this phenomenon persist. 4. If identifiers would have been available one could check the answering behaviour of respondents over time. 4. Critique and suggestions for further improvements 4.1. General Issues 1. For each questions the underlying purpose should be made clear. Is it a rather policyoriented questions or should it be used, e.g., for forecasting purposes (see survey programme section)? This is useful how the results are communicated both to the public, professional users and to the respondents (see public relation section) Otherwise the users might get the impression it is just a mere collection of questions which do not provide a coherent story. 2. The survey frequency should be increased from three times to four times a year. This would correspond to the usual quarterly frequency of many macroeconomic time series. In the future, when there is a longer time series, this would make it much easier to compare the results to official statistics. 3. The interviews should take place in the last month of each quarter (March, June, September, December). The respondents can assess the current quarter, which is almost finished. 4. Are the results provided to the respondents? If not, this should be done! The best thing would be to provide them with a pdf-file with all the detailed results Survey Programme In general, it is a good idea to have an assessment of the current situation and a corresponding expectation question. But in some cases it does not make sense or the interpretation is rather vague or unclear. An additional problem is that all questions ask for a general assessment. In some case it would be better to have a specific assessment with respect to a quantitate figure, e.g. the actual production level. In the following I will comment on each question and if applicable make a suggestion how to revise it. Additionally, I suggest some additional questions. Furthermore I would suggest changing the forecast horizon from 12 to 6 months. One year ahead forecast can be too uncertain. The more far ahead the respondents have to 5
6 make their forecasts the higher the probability that feel unsure about the answer. So it could be that they just guess. 1. your current economic situation as an agriculture producer? This question is fine also for the expectations. Please note that the term economic situation is undefined in a strict sense. So it is probable that the interpretation differs among respondents. One can think of turnover, production, profits, or earnings. It is also possible that it refers to a mood of the respondent. 2. productivity level of your business This question is problematic. I suppose it refers to the level of production and not to productivity in a strict sense, which relates inputs and outputs. It would be better to ask if the level of production has change compared to the previous quarter. This would have a clear quantitative interpretation on the aggregate level. I would suggest to rephrase the question in the following way: Compared to the previous quarter our production in the current quarter has increased/remained approximately the same/decreased. For the expectations Our productions over the next two quarters will probably increase/remain approximately the same/decrease. 3. cost level of your business? Here the same argumentation applies as before (Point 2). This question has no real macroeconomic implications, as there is no official time series you could compare the aggregated series to. It is rather interesting question for some lobby groups, whether the costs have risen for farmers. But I would to suggest also to rephrase the question to: Compared to the previous quarter our cost level in the current quarter has increased/remained approximately the same/decreased. For the expectations Our cost level over the next two quarters will probably increase/remain approximately the same/decrease. A problem could be how are costs define. So for the interviews you should determine how costs are defined. 4. extent of your business (in terms of land bank, number of animals etc.)? I understand the purpose of the question, but it is to general to draw reliable conclusions. During the aggregation process things are added up that should not be summarized. For example: One respondent increased the number of its animals by 100, so he picks the up-category. Another responded sold more than 1000 ha of its lands. So he picks the down-category. During the aggregation these two answers cancel out but have different implications for the output level. I would suggest skipping this question, to split it or to make it more specific. In the latter case one could ask for the land bank or the number of animals. With respect to expectations you could ask if they plan to increase to number of animals. 5. your access to third party capital, e.g. credits? This question is problematic as the producer does not need access to any external capital. So what does he answer? This introduces a potential bias to the results. I would suggest ask it in two stages 6
7 Have you needed external capital/finance (e.g. credits) in the current quarter YES/NO -> if YES The access was. Accommodating/normal/restrictive With respect to the expectations this question does not make any sense. The respondent does not know what the conditions will be in the future. So I suggest to skip it. 6. your access to qualified employees?/professional knowledge (for individual households) Again, this wording is unfortunate. The same arguments as for the production question apply. It would be better to ask whether the number of employees have changed. Suggestion: Compared to the previous quarter the number of employees in the current quarter has increased/remained approximately the same/decreased. For the expectations The number of employees in over the next two quarters will probably increase/remain approximately the same/decrease. 7. your access to modern machinery and equipment? I would not use this question. The interpretational value is rather lower. This holds also for the corresponding expectation question. Instead I would suggest asking for the investment level for the current and the next year. But this is a yearly question. Suggestion: Our capital expenditures in 2017 compared to 2016 will be higher/approximately the same/lower. Our capital expenditures in 2018 compared to 2017 will be higher/approximately the same/lower. The questions could be asked in the second quarter. 8. The last four questions I would skip. The balance statistic does not make much sense in these cases. I suggest to rephrase it in the following way: Our business activity is currently being constraint YES/NO If YES by - weak demand - financing difficulties - shortage of skilled workers - shortage of suitable machineries - unfavourable weather conditions - political situation in the Ukraine - bureaucracy - others, namely For this question one can calculate simple relative shares. 9. I would include four additional questions which deal with prices, exports and sales: In the past quarter our sale prices have increased/remained the same/decreased. Over the next two quarters our sale prices will probably increase/remain the same/decrease. 7
8 Taking into account the foreign orders received to date and the sales negotiations being conducted, the volume of our exports will probably be increase/remain the same/decrease. In the last quarter our turnover compared to the same quarter last year was higher/about the same/lower. The question with respect to the prices is interesting to detect any inflationary tendencies in the agricultural sector Aggregation Issues 1. There is a mistake in the calculations. The item nonresponse (coded as 0 ) is treated as neutral, as they are included in the sum for calculating the balance statistic. This should not be done as it leads to biased results. An example: Assume the following answering distribution 0:100, 1:111, 2:121 and 3:61 Your balance statistic is (111/393-61/393)*100 = 12.7 The correct balance statistic is (111/292-61/292) = As a consequence all results should be revised and corrected. 3. The distribution of answers given the actual relative shares (i.e. regions, branch and legal status of the firm) with respect to agricultural GDP is very good. This avoids biases in the results. 4. There is a main problem: The individual answers are not weighted given the actual size of the firm. This means the answers of a household has the same weight as a large holding. This can introduce a severe bias. 5. The basic aggregation idea is as follows: - Each firm gets an individual weight given its size. This weight can be determined by its employees, turnover or production. In case of the agricultural production I would think the production level might be sufficient. Often this weighting unit is transformed into weighting points which rely on a logarithmic scale. This avoids an overweighting of large firms. - In the next step the aggregation from the micro to the macro level is along the product line. In this case: animal and crop production plus the individual households. A balance is calculated for each branch. The main balance score is calculated by aggregating the branch balances using weights given by its grossvalue added (animal: 24%, crop 76% plus the households assuming they have the same distribution). 6. The current results are unbiased if 1. The answers are distributed across branches given its official distribution. 2. The firm size is evenly distributed across all answers. The first point is fulfilled, but not the second one. The results are potentially biased. 7. I want to illustrate this issue using an artificial example. I assume 250 agricultural producers, 60 for animal and 190 for crop production (as the official distribution). I abstract from individual household production. Furthermore I assume that from the 60 animal producers there are 50 small to medium size firms and 10 large firms. For 190 crop producers I assume 40 large and 150 small and medium sized firms. The weights 8
9 (measured as weighting points) are drawn randomly. The same applies to the answers (1, 2 and 3); these are drawn from a uniform distribution. I simulate 15 surveys. Given the simulated data I calculate four balance statistics: 1. Pooling all answers without any weights (no firm and branch weights) 2. Pooling all answers using individual weights but no branch weights 3. Calculating a balance both for the crop and animal producers and aggregate them to the main balance using the official weights. But there are no firm weights. 4. As before but now using also individual firm weights. In Figure 1 I plot the corresponding balance statistics. The results show that if the answering distribution is optimal, i.e. given the official distribution, an aggregation along the branches is not necessary. The results are identical. The main difference arises if we introduce individual firm weights. Then the results differ partly substantially. The aggregation along the branches becomes necessary when the answers are not distributed compared to the official distribution. This is illustrated in Figure 2, where I increased the number of animal producers to 150. Then the pooled results are clearly biased. 8. Currently for each question a business climate is calculated. This should not be done. The main reason is, that it destroys information. There is an information value both in the assessment of the current situation and the corresponding expectations. By commenting only the business climate the user/reader never knows whether the level or the change of the business climate is due to the current situation or the expectations or both. In case it is explained additionally it becomes tedious to read. 9. The original idea of the business climate of the ifo Institute was to provide one figure for the press. So I clearly recommend calculating the business climate only for the two main questions. For the questions a balance should be calculated separately. This makes the interpretation much easier and more intuitive. 10. I clearly recommend dropping the Business Climate Index. This index refers always to the first published value. The more the surveys are conducted along the business cycle the less informative is this value. 11. The well-known ifo Business Climate Index is just the index (for a given base year) of the corresponding balance statistic. I would do the same for the BCI. An index should only be calculated for the main business climate. More will be outlined in the next section. 9
10 Figure 1: Comparison of balance statistics with optimal answering distribution Figure 2: Comparison of balance statistics with biased answering distribution 5. Public Relations 1. I took a look at the last three press releases published on the website. 2. The text is definitely too long. The reader is overwhelmed by too many numbers and facts. It is rather tedious to read this. 3. It is a mixture between a press release and a longer report describing the full results. 4. Here it should be decided what the intention actually is. I would suggest making a split. There should be one press release and the separate report with tables and figures. 10
11 5. I enclose an example of a press release how it could be done in the future. I used the results from the last survey. 6. As already mentioned I would skip the Business Climate Index as it is defined here. It is confusing for the reader. In any case trends or comparisons to historical results can be done verbally in the text. 7. The term Agricultural Business Climate can be quite easily abbreviated as ABC. You should make heavily use of this in the public. 8. The wording is sometimes a little misleading. Producers cannot assess their business climate. This term refers to the aggregate indicator. The climate can improve or worsen, but never increase or decrease. This can only an indicator or index. 9. You should provide a pdf-file with detailed results. It should include for the Ukraine, the regions and the type of production all balance statistics. 6. What is next? Here are the four major points (to-do s): 1. Change the survey frequency to four times a year. 2. Revise the questionnaire as advised. 3. Change the aggregation. Consider size weights for each respondent. 4. Revise the press release. 11

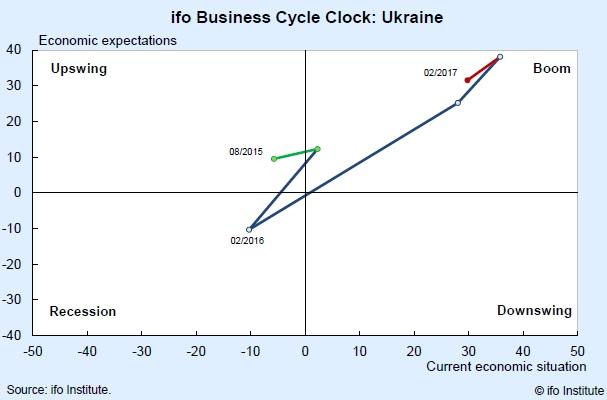
12 Appendix: Example of a Press Release Agriculture Business Climate Results of the survey from February 2017 Business Climate drops Kiew, 09. March 2017 Sentiment among agrarian producers weakened somewhat recently. The Agricultural Business Climate fell in February from 35.8 to 29.8 points. Both the current business situation and the expectations for the next twelve months were assessed somewhat more poorly by the companies than in the previous survey. The Ukrainian agricultural sector made a less confident start to the year. The drop in the main index was caused by worsening of the business climate in region Center and South. In both areas the agricultural producers assessed the current situation and the upcoming months less confident compared to the previous survey. In contrast, in the North- East and the West the business climate improved. Here some information concerning cattle, plant and households. Enquiries: Klaus Wohlrabe Tel. +49 (0)89/ Wohlrabe@ifo.de Agriculture Business Climate (Balances statistics, not seasonal adjusted) Date 08/15 11/15 02/16 08/16 11/16 02/17 08/17 11/17 02/18 08/18 11/18 02/19 08/19 Climate Situation Expectations Source: APD. For further details consult 12

13 Agriculture Business Climate by region (Balances, not seasonal adjusted) Date 08/15 11/15 02/16 08/16 11/16 02/17 08/17 11/17 02/18 08/18 11/18 02/19 08/19 Center South North East West Source: APD Explanatory note: The ABC Business Climate Index is based on ca. 400 survey responses from firms in the agricultural sector. The firms are asked to give their assessments of the current business situation and their expectations for the next six months. They can characterise their situation as good, satisfactory or poor and their business expectations for the next six months as more favourable, unchanged or more unfavourable. The balance value of the current business situation is the difference between the percentages of the responses good and poor ; the balance value of the expecta-tions is the difference between the percentages of the responses more favourable and more unfavourable. The business climate is a transformed mean of the balances of the business situation and the expectations. 13
14 14