IMM Quarterly Report: Spring 2018
|
|
|
- Rodger Montgomery
- 5 years ago
- Views:
Transcription

1 IMM Quarterly Report: Spring 2018 MISO Independent Market Monitor David Patton, Ph.D. Potomac Economics June 19, 2018
2 Highlights and Findings: Spring 2018 The MISO markets performed competitively this spring. Energy prices were unchanged from last year as natural gas prices fell 12 percent, which was offset by a 4 percent increase in load. Market power mitigation was infrequent and offers were competitive overall. Temperatures departed significantly from historical averages: Temperatures in March and April were well below average. In April, a cold front in the Midwest put upward pressure on gas prices. Gas prices at Chicago increased nearly 50% over 5 days in mid-april. Record-high temperatures in May contributed to challenging operating conditions, Max Gen Alerts, high prices and congestion. Peak load this Spring was 20 percent higher than last year at GW. Day-ahead congestion fell by 17 percent over last year and real-time congestion fell by 7 percent largely because of lower gas prices. A new wind output record of 15.6 GW was set on March 31. In April, the PRA again cleared at close to zero: $10 per MW-day except in Zone 1, which cleared at $1 per MW-day. We evaluated the CTS and ELMP processes, which are not performing well. -2-

3 Quarterly Summary -3-
4 Highlights for Spring 2018 Hot Weather in May, High Prices, and Congestion (Slides 12, 13, 16, 18) In late May, record-high temperatures, high load, and transmission outages contributed to high prices and congestion. Nearly 10 percent of total quarterly congestion occurred on the last three days of May, and $33 million of real-time congestion occurred on a single day. MISO declared Hot Weather Alerts for May 27 through May 29. On May 28, Minneapolis hit a record 100 degrees. High river temps caused deratings and one unit outage in the Central Region. On May 29, challenging conditions led to several out of market actions: MISO declared a Local Transmission Emergency in Michigan in order to commit AME resources and access generator emergency ranges. 13 units were manually re-dispatched throughout the footprint. Forced transmission outages led MISO to declare multiple TLRs. Transmission ratings were lowered because of hot weather. Hot temperatures, and high forced outages, and high forecasted load led MISO to issue Max Gen Alerts for May that were later canceled as conditions improved. -4-
5 Highlights for Spring 2018 Outages (Slides 36, 37) Outages were slightly lower this Spring than in During tight anticipated conditions in mid-may, several generators moved outages to increase available capacity and enabled MISO to cancel Maximum Generation Alerts it had declared. Overall, planned outages were slightly lower this Spring than in 2016, but: Planned outages remained much higher in the South than in the North. Short-notice planned outages have increased substantially (those that are planned less than 7 days prior to the start of the outage or extended). They were especially high in May and contributed to the high prices. A large share of these outages were extensions of planned outages. This raises concerns because MISO has not planned for them. We continue to recommend (SOM ) that pursue expanded authority to coordinate transmission and generation outages. -5-
6 Highlights for Spring Planning Resource Auction (Slide 38) MISO s PRA cleared at $10 per MW-day in all zones, except Zone 1 that was export-constrained and cleared at $1 per MW-day. This is a slight increase from the $1.50 per MW price in the prior year, but remains close to zero. This is the direct result of a flaw in the design of the capacity market that undermine suppliers long-term decisions. Cleared LMRs increased 17 percent over last year, driven by nearly 1 GW and 0.6 GW of additional cleared DR and BTMG, respectively. We have concerns about the increasing amount of cleared LMRs because the majority of these resources are not available under critical conditions since: MISO has to first declare an emergency before calling them; and These resources have notification times of up to 12 hours. Response during past emergencies have also been well below 100 percent. In March, MISO filed Tariff changes to create External Resource Zones. Provides better price signals for external capacity resources. With limited exceptions, it prevents external capacity resources from offsetting Local Clearing Requirements. FERC has issued a deficiency letter to address outstanding questions. -6-
7 Highlights for Spring 2018 Coordinated Transaction Scheduling (Slide 30) On October 3, 2017, MISO implemented CTS with PJM. Participants submit offers to schedule imports and exports that clear intrahour if forecasted price spreads between markets exceed offer prices. The economic dispatch of external transactions through CTS can achieve sizable efficiency savings. Unfortunately, it was implemented in a manner that has removed the incentive for participants to submit transactions. Participants pay transmission reservation fees to submit CTS offers, even if they do not clear. These fees averaged $49 and $21 per cleared MWh of imports and exports, respectively. These fees explain the lack of participation shown in the figure. CTS continues to offer large potential benefits. We recommend that MISO remove transmission reservation fees unilaterally and work with PJM to agree to eliminate their charges to CTS transactions. This also underscores the importance of adhering to sound economic principles in developing new market products and rules because this outcome was predictable. -7-
8 Highlights for Spring 2018 Effectiveness of ELMP (Slide 22) The hot conditions in May led to an increased reliance on peaking resources, which are useful conditions under which to evaluate the effects of ELMP. ELMP reforms pricing by allowing peaking resources to set prices when they are: Online and deemed economic and needed to satisfy the system s needs; or Offline and deemed economic during transmission or energy shortage conditions. We have found the offline pricing under ELMP to be inefficient, muting legitimate shortage pricing signals, and we have recommended that it be disabled. The online pricing is critical because it: Allows prices to fully reflect the costs of the resources needed by the system; Improves the real-time price signals that govern day-ahead outcomes and decisions to import and export; and Reduces reliance on RSG that compensates for understated real-time prices. ELMP s online pricing has had a small effect on MISO s prices since its inception. Our prior evaluations concluded that the small effects were due to the limited eligibility of resources to set prices under ELMP. This was expanded under Phase 2 in May 17, but the effects are still small. -8-
9 Highlights for Spring 2018 Effectiveness of ELMP s Online Pricing (Slide 22) We recommend further expansion to include day-ahead scheduled units. This will substantially increase the eligibility of peaking units, particularly under high-load conditions, which lead to higher day-ahead scheduling of peaking units. We also evaluated a key assumption that determines when a unit will set price: Currently, units ramped down by ELMP at their max ramp rate will not set price. Both the ISO-NE and NYISO variants of ELMP more accurately test whether a unit is needed and should set price by testing whether it should ramp to zero. Our evaluation estimates the effects of modifying this assumption and allowing day-ahead scheduled peaking units to be eligible in the real-time market. The figure shows that: Expanding eligibility would have increased the price effects by almost 300 percent, from $0.58 per MWh to $2.25 per MWh. Relaxing the ramp rate assumption would raise the effectiveness further to $4.19. The effects are highest in the afternoon hours rising to more than $12 per MWh on average in the 3 pm hour. If reflected back into the day-ahead market, these prices would improve the generator commitments and lower the costs of meeting the system s demands. -9-
10 Submittals to External Entities and Other Issues We responded to FERC questions related to prior referrals and continued to meet with FERC on a weekly basis. We responded to several data requests related to prior referrals. We made several notifications of other potential Tariff violations. We presented a review of monitoring screens and indices to FERC staff. We participated in the following FERC dockets. We participated in stakeholder discussions and supported MISO s filing to authorize mitigation authority on the SRPBC in the N-S direction. We will also be supporting MISO s response to FERC s deficiency letter seeking clarifications and supporting data. We provided review and input for MISO s filing to improve PVMWP related to manually redispatched resources. We filed comments in the Grid Resiliency docket, generally supporting MISO s resiliency conclusions and opposing PJM s pricing proposals. -10-
11 Submittals to External Entities and Other Issues We sent MISO an additional memo recommending sanctions for resources for uneconomic production under Module D. We participated in a number of stakeholder discussions and working groups. We continued to work with MISO and stakeholders on proposed improvements to the Uninstructed Deviation Thresholds (SOM ) and improved incentives for PVWMP (SOM ). MISO has worked with us and its stakeholders to develop a very good proposal and plans to file proposed tariff revisions in the 3 rd Quarter. We ve also recommended that MISO address a gaming issue we have observed that leads to RTORSGP, which accounted for more than 40 percent of these payments in the Spring quarter. -11-

12 Day-Ahead Average Monthly Hub Prices Spring


13 All-In Price Spring
14 Monthly Average Ancillary Service Prices Spring $/MWh $14 $12 $10 $8 $6 $4 Regulation Price (exclude shortages) MCP Impact from Reg Shortages Spinning Reserve Price (exclude shortages) MCP Impact from Spin Shortages Supp Reserve Price (exclude shortages) MCP Impact from OR Shortages Day-Ahead Premium Spring Average of Five Years $2 $0 -$2 MAM J J A S OND J FMAM MAM J J A S OND J FMAM MAM J J A S OND J FMAM Regulation Spinning Reserve Supplemental Reserve -14-
15 MISO Fuel Prices $/MMBtu $5.50 $5.00 $4.50 $4.00 $3.50 $3.00 $2.50 $2.00 $1.50 $1.00 $0.50 $0.00 $9.01 J F M A M J J A S O N D J F M A M J J A S O N D J F M A M Spring Average Spring 17 Average Chicago NG $1.87 $2.94 $2.58 Henry NG $1.82 $3.02 $2.73 IB Coal $1.24 $1.45 $1.47 PRB Coal $0.52 $0.66 $

16 Load and Weather Patterns Spring Note: Midwest degree day calculations include four representative cities in the Midwest: Indianapolis, Detroit, Milwaukee and Minneapolis. The South region includes Little Rock and New Orleans. -16-

17 Day-Ahead Congestion, Balancing Congestion and FTR Underfunding,

18 Value of Real-Time Congestion Spring


19 MISO Congestion Value and JOA Settlement Constraints Impacted by Pseudo-Ties -19-
20 Real-Time Hourly Inter-Regional Flows RDT Flow South to North (MW) 4,000 3,000 2,000 1, ,000-2,000 Hourly Average Daily Average Monthly Average 2500 MW RDT Limit -3,000-4,000 S O N D J F M A M Monthly Avg MW RDT Limit March April May -20-
21 Wind Output in Real-Time and Day-Ahead Monthly and Daily Average Quantity (MW) 20,000 18,000 16,000 14,000 12,000 10,000 8,000 6,000 4,000 2, ,000 Spring Avg Net Virtual Supply Day-Ahead Wind 5,048 5,621 5,195 Real-Time Wind 5,595 6,506 5,926 A M J J A S O N D J F M A M Mar Apr May Monthly Average Daily Average -21-
22 SMP Increase from Ex-Ante ($/MWh) $18 $16 $14 $12 $10 $8 $6 $4 $2 Evaluation of ELMP Assumptions May 2018 Alternative ELMP Methods Avg. Price Increase ($/MWh) % of Peaking Output Eligible % of Intervals Affected Current Phase II $ % 11.8% Plus Day-Ahead Units $ % 37.5% No Ramp Limitation $ % Plus DA Units & No Ramp Limit $ % $ Hour Ending -22-

23 Day-Ahead and Real-Time Price Convergence Spring

24 Day-Ahead Peak Hour Load Scheduling Spring
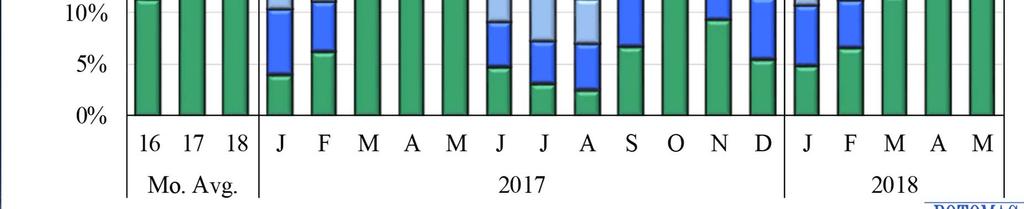
25 Average Hourly Volume (MW) Supply Demand 28,000 24,000 20,000 16,000 12,000 8,000 4, ,000 8,000 12,000 16,000 20,000 24,000 28,000 32,000 Virtual Load and Supply Spring M A M J J A S O N D J F M A M M A M J J A S O N D J F M A M Mo. Avg Mo. Avg. Midwest -25- Uncleared Cleared, Price Sensitive Cleared, Price Insensitive Cleared, Screened Transactions South
26 Virtual Load and Supply by Participant Type Spring Average Hourly Volume (MW) Supply Demand 35,000 30,000 25,000 20,000 15,000 10,000 5, ,000 10,000 15,000 20,000 25,000 30,000 35,000 40, MAM J J A S OND J FMAM161718MAM J J A S OND J FMAM Mo. Avg Mo. Avg. Financial-Only Participants Uncleared Cleared, Price Sensitive Cleared, Price Insensitive Cleared, Screened Transactions Generators / LSEs -26-
27 Virtual Profitability Spring Total Profits (Millions) $45 M $40 M $35 M $30 M $25 M $20 M $15 M $10 M $5 M $0 M -$5 M Supply Demand Gross M A M J J A S O N D J F M A M $4 $2 $0 -$2 Profits per MW Mo. Avg Percent Screened Demand Supply Total
28 Day-Ahead and Real-Time Ramp Up Price Ramp Up MCP ($ per MWh) $2.00 $1.80 $1.60 $1.40 $1.20 $1.00 $0.80 $0.60 $0.40 $0.20 $0.00 Average RT Ramp Up MCP Average DA Ramp Up MCP N D J F M A M J J A S O N D J F M A M
29 Common Interface Pricing with PJM Spring
30 Coordinated Transaction Scheduling (CTS) Winter

31 Peaking Resource Dispatch
32 Day-Ahead RSG Payments

33 Real-Time RSG Payments
34 RDT Commitment RSG Payments

35 Price Volatility Make Whole Payments

36 Generation Outage Rates


37 Generation Outage Rates South:
38 MW 45,000 40,000 35,000 30,000 25,000 20,000 15,000 10,000 5,000 Planning Resource Auction Results PRA Results MISO (MW) Offered Not Cleared 6,602 Cleared in Annual Auction 88,149 Fixed Resource Adequacy Plan 47,030 Total Capacity Procured 135,179 Maximum Zonal Limit Minimum Zonal Requirement ACP ($/MWd) 0 Z1 Z2 Z3 Z4 Z5 Z6 Z7 Z8 Z9 Z10 MN, ND, WI, MI IA IL MO IN, KY MI AR LA, TX MS WI
39 Monthly Output Gap
40 Day-Ahead And Real-Time Energy Mitigation

41 Day-Ahead and Real-Time RSG Mitigation
42 List of Acronyms AMP Automated Mitigation Procedures BCA Broad Constrained Area CDD Cooling Degree Days CMC Constraint Management Charge CTS Coordinated Transaction Scheduling DAMAP Day-Ahead Margin Assurance Payment DDC Day-Ahead Deviation & Headroom Charge DIR Dispatchable Intermittent Resource HDD Heating Degree Days ELMP Extended Locational Marginal Price JCM Joint and Common Market Initiative JOA Joint Operating Agreement LAC Look-Ahead Commitment LSE Load-Serving Entities M2M Market-to-Market MSC MISO Market Subcommittee NCA Narrow Constrained Area ORDC Operating Reserve Demand Curve PITT Pseudo-Tie Issues Task Team PRA Planning Resource Auction PVMWP Price Volatility Make Whole Payment RAC Resource Adequacy Construct RDT Regional Directional Transfer RSG Revenue Sufficiency Guarantee RTORSGPReal-Time Offer Revenue Sufficiency Guarantee Payment SMP System Marginal Price SOM State of the Market TLR Transmission Line Loading Relief TCDC Transmission Constraint Demand Curve VLR Voltage and Local Reliability WUMS Wisconsin Upper Michigan System -42-