When Automatic Forecasting Doesn t Do the Job
|
|
|
- Hubert Barrett
- 5 years ago
- Views:
Transcription

1 When Automatic Forecasting Doesn t Do the Job Presented by Eric Stellwagen Vice President & Cofounder Business Forecast Systems, Inc. estellwagen@forecastpro.com Eric Stellwagen Vice President & Cofounder of Business Forecast Systems, Inc. Coauthor of Forecast Pro product line. Over 27 years in forecasting. Currently serving on the board of directors of the International Institute of Forecasters and on the practitioner advisory board of Foresight: The International Journal of Applied Forecasting. 1
2 What We ll Cover Overview The Role of Judgment Automatic Forecasting Exponential Smoothing New Product Forecasting Top down Approaches Multivariate Approaches Summary Three Common Approaches to Forecasting Judgmental Methods Methods which rely not on statistical analysis of the historical data, but rather on human intuition. Time Series Methods Methods which capture patterns in historical data and extrapolate them into the future. Multivariate Techniques Methods which capture relationships betweena dependentvariable (the variable to be forecasted) and independent (explanatory) variables. Multivariate models can also include time series components. 2
3 Common Forecasting Methods Judgmental Approaches SimpleTimeSeries Series Methods: Moving Averages Same as Last Year Percentage Growth Statistical Time Series Methods: Exponential Smoothing Box Jenkins (ARIMA) Croston s Intermittent Demand Model Multivariate Methods: Event index Models Dynamic Regression New Product Methods: Forecast by Analogy (looks like) Assumption based Models Diffusion Models (e.g., Bass) There is No Best Method The best method depends on the data, the purpose, the organizational environment and the perspective of the forecaster. Data properties vary widely Daily, weekly, monthly, quarterly or annual Long or short series Trended or untrended Seasonal or non seasonal Noisy or regular Stable or changing patterns Univariate or multivariate 3
4 There is No Best Method The environment varies widely Inventory and production control Product management Revenue planning Board room strategy Volume of forecasts 1, 100, 1000, Integration with corporate database and other systems No one forecasting method fully satisfies this diversity of needs. Evolution of Forecasting Process Phase 1 Phase 2 Phase 3 Judgment & Spreadsheets Automatic Time Series Approaches Customized Approaches 4
5 The Role of Judgment Judgmental Forecasting Pros: Does not require statistical expertise. Allows forecaster to incorporate domain knowledge. This knowledge can come from many sources including experience with similar products, feedback from sales staff, customer surveys, focus group, etc. Does not require historical i data. dt 5
6 Judgmental Forecasting Cons: Is subjective. Can be biased by company politics, sales goals, etc. Is difficult to monitor performance and fine tune future forecasts. Is not automatic can be very time consuming. Judgmental Forecasting Judgment often plays an important role in forecasting, particularly with new products, short product life cycle products, rapidly changing environments and instances where the forecaster s domain knowledge is not captured in the statistical forecasting model. A strong recommendation is to add judgment in the form of an override to a statistically generated base line forecast. This practice provides the ability to track the effectiveness of the judgmental override and introduces more accountability into the process. 6
7 Automatic Time Series Approaches 3 Months of Data 14 7

8 12 Months of Data Months of Data 16 8

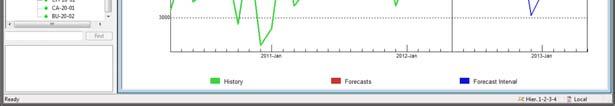
9 36 Months of Data 17 6 Years of Data 18 9
10 Time Series Approaches Pros: Simple to understand and explain Widely accepted and used Often quite accurate Adaptive Easy to apply Can be automated Time Series Approaches Cons: Requires adequate demand history Assumes continuity between past and future Does not capture response to noncalendar based events (e.g., promotions) Does not capture response to explanatory variables Implementations vary and some are poor 10
11 Rejecting Automatic Models When you disagree with the forecasts generated using an automatic time series approach you should reject them. Generally there are three ways to do this: Judgmentally override the forecasted values. Dictate that a different forecasting model be used. Reconfigure the input data. ER1 Why is it Wrong? Domain knowledge Your knowledge of the future leads you to reject the forecast. The solution is most often to judgmentally adjust the forecast. Might be done informally or as part of a structured process (e.g., S&OP) 11
12 Slide 22 ER1 please make sure the copy on this slide will be readable Beth Rennie, 8/20/2012

13 Adding Judgment Best practices: Retain statistical forecast and adjusted forecast for comparison Document reason for changes ER2 Why is it Wrong? Chose wrong time series model Often a case of misidentifying trends and/or seasonal patterns. Dictating an appropriate exponential smoothing model is often a good solution. 12
14 Slide 24 ER2 please make sure the copy on this slide will be readable Beth Rennie, 8/20/2012
15 Exponential Smoothing Main Characteristics of Exponential Smoothing A family of models. Models three data components level, trend,and seasonality. Assumes that each component is changing in time. Assumes that there is random variation (noise). Uses weights to reflect the relative emphasis given to the recent vs. the distant past. Estimates final values of the components and uses them to construct forecasts. 13
 (NN) (NA) (NM) Linear")
 (DN) (DA) (DM) Exponential Trend (1.")
16 Holt Winters Exponential Smoothing Nonseasonal Additive Seasonal Multiplicative Seasonal Constant Level (SIMPLE) (NN) (NA) (NM) Linear Trend (HOLT) (WINTERS) (LN) (LA) (LM) Damped Trend (0.95) (DN) (DA) (DM) Exponential Trend (1.05) (EN) (EA) (EM) Example: product known to be seasonal 14


17 Example: product known to be seasonal Example: product known to be seasonal 15
18 ER3 Why is it Wrong? Inadequate data Data too short (new product) New Product Forecasting and Top-down Approaches 16
19 Slide 31 ER3 please make sure the copy on this slide will be readable Beth Rennie, 8/20/2012
20 Types of New Products There are different types of new products including: Replacement Products Product Line Extensions New to Company New to World The type of new product you are trying to forecast will often dictate what approaches should be considered. Replacement Products and Product Line Extensions When forecasting replacement products or product line extensions you will often want to leverage the data that exist for the predecessor products. Approaches can include: Judgment and Market Research Item Supersession (i.e., mapping histories) Top down Forecasting 17


21 Item Supersession You create a forecast history for the new product using the demand histories of predecessor products and the new product. For a replacement product this may be as simple as merging the old product s history with the new product s history. More complex mapping may be necessary depending on the circumstances. Item Supersession Old Product ER4 New Product 18
22 Slide 36 ER4 please make sure the copy on this slide will be readable Beth Rennie, 8/20/2012


23 Item Supersession ER9 Forecast History Top down Forecasting Cough Syrup SKU 1 SKU 2 Etc. Group level data are higher volume, will often exhibit more structure and will have a longer demand history than the product line extensions and replacement products. To generate a top down forecast, you first forecast at the group level using the aggregated history. Then, you forecast at the lower levels. Finally, you apply proportionality factors to lower level forecasts so that the forecasts sum to the top level forecast. 19
24 Slide 37 ER9 please make sure the copy on this slide will be readable Beth Rennie, 8/20/2012

25 Bottom up Forecast Top down Forecast 20
26 New Product Forecasting When forecasting new to company or new to world products you obviously don t have internal data external data may or may not be available. Approaches can include: Judgment and Market Research Forecasting by Analogy (looks like) Assumption based Models Market Share Forecasting Diffusion Models ER5 Why is it Wrong? Inadequate data Date too low level (not enough structure) Simplify the hierarchy Forecast top down Aggregate the time buckets (e.g., switch from weeks to months) Use bucket conversions 21
27 Slide 42 ER5 please make sure the copy on this slide will be readable Beth Rennie, 8/20/2012
28 Bucket Conversion It is not uncommon for a company that needs a daily or weeklyforecast to discover that the data can t support statistical modeling at these periodicities. One solution is to forecast at an aggregated level and allocate down to the lower level. This process is sometimes referred to as bucket conversion. Bucket Conversion S Bucket conversion can take different forms: Flat allocation Proportional allocation based on historical profiles Proportional allocation based on forecasts (bucket synchronization) 22
29 ER6 Why is it Wrong? Time series model is not appropriate when demand dis di driven by: Events that move around the calendar Multivariate Methods 23
30 Slide 45 ER6 please make sure the copy on this slide will be readable Beth Rennie, 8/20/2012
31 Common Events Product promotions Moveable holidays (e.g., Easter, Rosh Hashanah, Ramadan) Catastrophes (e.g., earthquakes, hurricanes, 9/11) Labor strikes Acquisitions New legislation or regulations Forecasting Event Driven Data Judgmentally adjust history to remove impact. Separate base demand from event driven demand. Use a time series extension model (e.g., eventindex model, ARIMA intervention model, etc.). Use a multivariate model (e.g., regression). 24

32 What is an Event Index Model? An extension of exponential smoothing. An index based approach. The model introduces an additional smoothing weight and updating equation. The model requires an event schedule. Example: Home Party Product with Giveaway This item includes both sales and free goods for December 2010 and January Base demand cannot be cleanly separated due to the fact that free goods substantially changed sales. The look of this series is common it looks like a competitive business interruption


33 Home Party Product (continued) The client is unaware of any useful explanatory variables other than the promotional schedule. This is one of 1,200 SKUs many of which exhibit similar behavior. Event index models work well and allow the process to be fully automated. 51 Home Party Product (continued) 52 26


 The client is unaware of any useful explanatory")
34 ER7 Example: Sales of Mouthwash Demand for mouthwash is not seasonal and for this brand not trended. Price promotions by both the manufacturer and competitors introduce significant peaks and valleys. The timing of promotions is similar from year to year (but not exactly the same), and thus without domain knowledge the data appear to be seasonal. The introduction of EDLP with Wal Mart changes the response to promotions. 53 ER8 Sales of Mouthwash (continued) The client is unaware of any useful explanatory variables other than the promotional schedule. This is one of 400 SKU by location all of which exhibit similar behavior. Event index models work well and capture the change in the promotional response
35 Slide 53 ER7 please make sure the copy on this slide will be readable Beth Rennie, 8/20/2012 Slide 54 ER8 please make sure the copy on this slide will be readable Beth Rennie, 8/20/2012


36 Sales of Mouthwash (continued) 55 Why is it Wrong? Time series model is not appropriate whendemand is driven by: Explanatory variables that can change abruptly 28
37 Dynamic Regression Pros: s Allows for the introduction of explanatory variables. Lends insight into relationships between variables. Allows for what if scenarios. Can exploit leading indicators. Dynamic Regression Cons: s Is not automatic, requires considerable expertise and time. Even if the regression model is good, will produce poor forecasts of the dependent variable if there are difficulties in forecasting the explanatory variables. Requires large amounts of data. 29


38 Independent Variables Internal Variables External Variables Prices Promotion Weather Economy Competition Demographics Example: Sales of Electricity Temperature is an important driver. 30


39 Example: Sales of Electricity Time series models cannot capture adequate response to temperature. Example: Sales of Electricity Dynamic regression models capture response to temperature and work well. 31
40 Summary Judgment is always important and is best applied as an adjustment to a statistically generated base line forecast. Automatic ti time series methods work well when you have adequate data and are generally superior to spreadsheet models. When you reject an automatic time series forecast, your options include: Judgmentally overriding the forecasted values. Dictating that a different forecasting model be used. Reconfiguring the input data. Questions? 32
41 Contact Eric Stellwagen Vice President & Cofounder Business Forecast Systems, Inc. 68 Leonard Street Belmont, MA USA (617) com Thank you for attending! 33