Network Congestion Effect of E-Hailing Transportation Services
|
|
|
- Scot Holt
- 5 years ago
- Views:
Transcription

1 Portland State University PDXScholar TREC Friday Seminar Series Transportation Research and Education Center (TREC) Network Congestion Effect of E-Hailing Transportation Services Xuegang Ban University of Washington Let us know how access to this document benefits you. Follow this and additional works at: Part of the Transportation Commons, Transportation Engineering Commons, and the Urban Studies and Planning Commons Recommended Citation Ban, Xuegang, "Network Congestion Effect of E-Hailing Transportation Services" (2017). TREC Friday Seminar Series This Book is brought to you for free and open access. It has been accepted for inclusion in TREC Friday Seminar Series by an authorized administrator of PDXScholar. For more information, please contact


2 Congestion Effect of E-Hailing Transportation Services Transportation Research and Education Center, Portland State University Xuegang (Jeff) Ban 05/12/2017
3 2 Acknowledgement > Collaborators: Dr. Jong-Shi Pang and Dr. Maged Dessouky, University of Southern California > Graduate Students Mr. Jingxing Wang & Ms. Rong Fan, University of Washington > Funding Support NSF CMMI ; CMMI


4 Advances in Vehicle Technologies Hybrid Vehicles Electric vehicles New Energy Vehicles Flying cars Drones Uber flying car plan: Automated vehicles 3


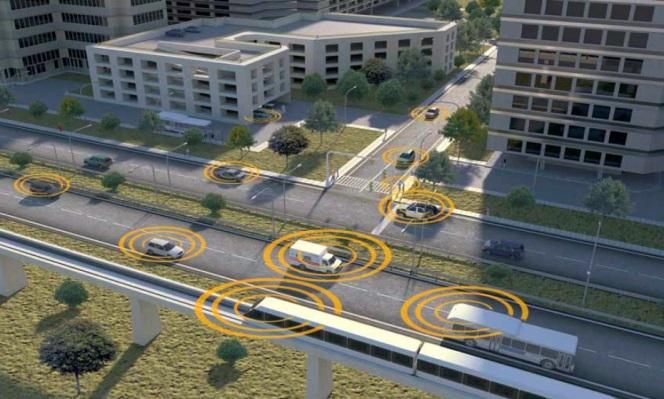


5 Advances in Vehicles/ Transportation (Communications) Mobile Sensing Shared Mobility New Social Media Connected Vehicles 4

6 5 Shared Mobility + +? Fifth Element
7 Modeling and Analyzing E-Hailing Services 6
 traffic network and why? When?")

8 Some Basic Concepts How is traffic distributed in a (urban) traffic network and why? When? Car? Which route? Safety, reliability, toll, scenery,... Where am I? Next turn? Change route? 7
9 8 Some Basic Concepts Transportation Network Modeling (Traffic Assignment): predict flow distribution in a traffic network, given the total demand (e.g., during the peak period) Traffic Equilibrium (Frank Knight, 1924) Wardrop First Principle: User Equilibrium (Wardrop, 1952) The journey times on all the routes actually used are equal, and less than those which would be experienced by a single vehicle on any unused route Wardrop Second Principle: System Optimal (Wardop, 1952) At equilibrium, the average journey time is minimum
10 9 Some Basic Concepts Transportation Network Analysis Paradigm User Equilibrium (UE) System Optimum (SO) Mixed Equilibrium (ME) New developments make them more relevant, not obsolete New systems make it more likely to estimate/predict state/behavior accurately New systems make it easier to communicate / influence users


11 10 E-Hailing Services > Phone calls > Mobile apps > Other means (e.g., Connected/automated vehicles in the future?)
12 11 E-Hailing Service Modes > E-Hailing Taxi > TNC (Transportation Network Company) > Ridesourcing (Uber/Lyft/Didi: drivers are for-hire ) > Ridesharing (both drivers and riders are travelers: carpool) > Ridesourcing + ridesharing (Uber Pool, Lyft Rideshare, Didi Shunfengche)
13 12 Impact of E-Hailing Services: Positive > Lower costs (compared with traditional taxis) > More convenient (easier to hail, reduced waiting time, etc.) > Promoting ridesharing modes (thus more efficient) > Reduction of the searching-for-parking traffic > Reduction of the driving around vacant taxi traffic > Others
14 13 Impact of E-Hailing Services: Negative > Safety and comfort concerns (many news items about the safety issues related Uber/Lyft/Didi services) > Concerns about the experience of the drivers and the reliability of the services > Deadhead miles (vacant trips) > Convenience leads to more use of such services (i.e., car trips), which may reduce transit ridership and increase vehicle miles travelled > Others
15 14 Research on the Network Impact > Empirical Methods (Data) > Steier (2015): NYC; Chen et al. (2017): Didi data; Nie (2017): taxi data in Shenzhen, China > Major findings (Nie, 2017): New e-hailing (TNCs) services may mildly increase congestion; Traditional taxis are competitive for specific trips or during specific periods of time (such as peak hours) Certain equilibrium may be reached among different modes
16 15 Research on Network Impact > Systematic Methods (Data + System Modeling) > Traditional taxis: Yang and Wong (1998); Yang et al. (2002, 2008, 2010, 2011) > E-hailing services: Xu et al. (2005); Ban et al. (2017) Equilibrium may be reached, which depends on the pricing schemes, choices behavior of service providers and customers, and their characteristics (such as value of times, among others); impact depends also on the network/travel characteristics The research did NOT consider ridesharing modes
17 16 How to Model E-Hailing Services? > Multiple key players and their interactions/choices > Solo drivers > Service Providers Taxis drivers TNC drivers > Customers with different Value of Times (VOTs) Solo drivers/riders (High) Taxi customers (Medium) TNC customers (Low)
18 17 Service Providers Behavior/Choices > Main consideration: profit maximization > Charging Schemes (basic) Fixed fare + distance-based charge + time-based charge > Cost: time-based cost and distance-based cost > Profit: For service mode m Fixed fare QQ kk mm O k RR jjjj mm j k Destination D k
19 18 Service Providers Choice Model QQ kk mm O k zz jjjj mm j k Destination D k
20 19 Customer Behavior/Choices > Main consideration: utility maximization / disutility minimization > Disutility Solo drivers: time and distance related disutility (maybe fixed fare) Service riders: fare + time related disutility
21 20 Customer Choice Model > Customer waiting time: waiting for service vehicles to travel to the pick up location and extra waiting time if no enough service vehicles > Choice Model: disutility of using different models equilibrates, i.e., no one wants to switch modes
22 21 Congestion Model > Choices of customers (which modes to choose) and service drivers (which customers to pick up) generate the flow of traffic (customers from origins to destinations + pick up trips) that interacts on the traffic network, creating network congestion > Main Consideration: during their travels, all drivers choose the routes that minimizes their own travel costs/disutilities > Similar to the classical UE problem
23 22 Congestion Model > Flow conservation + Route choice QQ kk i=o k zz iiii mm k Destination j=d k O l l D l
24 23 A General Equilibrium Model (GEM) > A game with multiple players, each aiming to optimizing his/her objective (max. profit, min. disutility, etc.) > It can be shown that the model has at least one solution and can be obtained by solving a standard mathematical problem. > The solution can be used to evaluate: % of the deadhead miles, % of travelers choosing each mode, congestion level of the network (e.g., VMTs), and how different charging schemes and other parameters may impact the results
25 24 Preliminary Results - I > A toy network (for illustration) > Origin 1; destination: 2,3,4 > Demands: 50, 40, 50

26 25 Preliminary Results - I > Demand pattern is extremely asymmetric, similar to the AM/PM commute scenario > Charging Schemes Seattle Data with modifications
27 26 Preliminary Results - I > Total VMT: veh-miles > Deadhead miles: 2750 veh-miles (~50%)
28 27 Sensitivity Analysis > Test how the model results change with the change of a single parameter > In general, increasing certain cost factor of a given mode, customers choice of that mode will decrease. > The changes are more sensitive to some parameters such as the time- and distance-based charging fee than other parameters (such as the distance-based cost of drivers)
29 28 Sensitivity Analysis Asymmetric Demand Pattern Symmetric Demand Pattern

30 Sensitivity Analysis 29

31 Results - Sioux Falls Network 30

32 Results Sioux Falls Network 31
33 32 Summary of Findings > The congestion impact of e-hailing services depends on the pricing scheme, the characteristics and choice behavior of providers and customers, the travel demand pattern, and the geometry of the network > The larger the percentage of e-hailing services, the lower the demand symmetry, the larger the increase of the total VMT > For certain trips such as AM commute trips, demand pattern may be very asymmetric. In this case, significant use of e- hailing services may noticeably increase VMT and congestion > E-hailing providers: encourage the use of ridesharing services and reduce deadhead miles
34 33 Current / Future Research > Extensions: Integrate transit or elastic demand Integrate ridesharing modes Consider dynamics of the system Optimize system performance (dispatch, congestion, etc.) > Testing and validation on real-world networks/data
35 Intelligent Urban Traffic System Lab (iuts) Started at Rensselar Polytechnic Institute (RPI), transferred (almost) to the University of Washington (UW) People and Alumni: 5 Ph.D. and 3 M.S. students graduated; 2 Post-docs; 30+ undergraduate student researchers; 4 Ph.D. students in progress (2 more in Fall 2017); ~ 5 MS students; a number of undergraduate researchers and visiting scholars / students Funding: More than $3.0M since 2008, including ~$1.0M from NSF; 25 completed and 3 active projects iuts Homepage:
36 Intelligent Urban Traffic System Lab (iuts) Research outcomes (since 2008): Journal publications: about 50 published or accepted Conference proceeding papers (refereed): about 40 Invited Talks: 30 (universities, transportation management agencies, transportation research institutes, mobile research institutes, industry) Research projects: PI/Co-PI 28 research projects for $3.0 million Awards: NSF CAREER Award (2011); CUTC (Council of University Transportation Centers) New Faculty Award (2012); Best Paper Award, University Transportation Research Center (UTRC), Region 2 (2008); Research Excellence Award, School of Engineering, RPI (2014) Professional Services (since 2008) National Committees: Elected Vice Chair ( ) and Cluster Chair ( ) of ITS Special Interest Group (SIG) of Transportation Science & Logistics (TSL) Society under INFORMS; Committee Member of Transportation Network Modeling (ADB30) and Vehicle Highway Automation (AHB30), Transportation Research Board, National Academies Editorial Board: Associate Editor of Journal of IEEE Transactions on Intelligent Transportation Systems; Transportation Research, Part C; Intelligent Transportation Systems; Editorial Board Member of Transportation Research, Part B; Networks and Spatial Economics; TransporMetrica B
37 36 Thank You! Contact: