ESI Investor and Analyst Conference
|
|
|
- Geraldine Harrington
- 5 years ago
- Views:
Transcription
1 ESI Investor and Analyst Conference

2 2 Safe harbor This presentation contains forward-looking statements. These statements are subject to a number of risks and uncertainties. Risks and uncertainties that may affect the forward-looking statements include: The relative strength and volatility of the electronics industry which is dependent on many factors including component prices, global economic and political stability, and overall demand for electronic devices (such as capacitors, semiconductor memory devices and advanced electronic packages) used in wireless telecommunications equipment, computers, and other consumer and automotive electronics The ability of the company to respond promptly to customer requirements The ability of the company to develop, manufacture and successfully deliver new products and enhancements The company s need to continue investing in research and development The company s ability to create and sustain intellectual property protection around its products. Our ability to achieve our new business and financial model The size and growth of our market and market share Protection of our intellectual property Consensus street estimates for our fourth fiscal quarter Our future uses of cash Such risks and uncertainties are discussed in more detail in the company s annual report on Form 10-K and other interim reports on Form 10-Q.

3 Corporate overview video 3


4 Agenda 4 Introduction & overview Markets & products Technologies & competencies Financials Michael Burger John Williams Steve Harris Allen Muhich
5 5 Introduction & overview Michael Burger Key takeaways for today Established new organization, cost structure and strategy Focused on high-growth market opportunities Core competencies create differentiation & barrier to entry Scalable financial model for sustained profitability
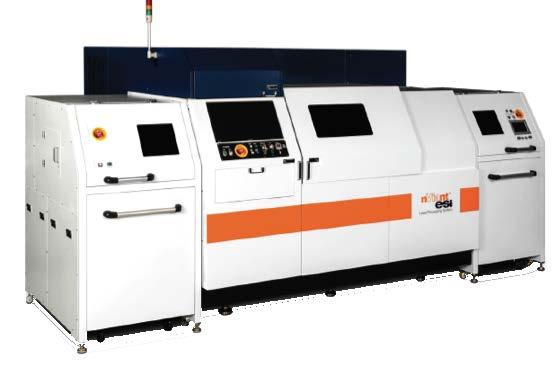
6 What we do We enable our customers to commercialize technologies through precision laser processing. 6


7 ESI at a glance 7 Founded in 1944 Laser-based process equipment Manufacturing Singapore and United States Markets Interconnect, semiconductor & components, and industrial processing


8 ESI at a glance 8 Intellectual Property ~1,000 active patents worldwide Fiscal 2017 revenue Fiscal 2018 consensus $161M / $358M 600+ employees A solid balance sheet of $100 million cash at December quarter end
9 9 A brief history
10 Revenue below break even point Revenue total in millions Q1 Q2 Q3 Q4 Breakeven $90 $80 $70 $60 $50 $40 $30 $20 $10 Our past Decreasing revenue Inflated break even point 10 $0 FY13 FY14 FY15 FY16 FY17

11 EPS losses in down quarters Non-GAAP EPS Q1 Q2 Q3 Q4 $0.25 Our past Decreasing revenue Inflated break even point Growing losses 11 $- $(0.25) FY13 FY14 FY15 FY16 FY17

12 Cash consumption as results decline Cash* total in millions Q1 Q2 Q3 Q4 $250 $200 $150 Our past Decreasing revenue Inflated break even point Growing losses Consuming cash 12 $100 $50 $0 FY13 FY14 FY15 FY16 FY17 * Cash + investments

13 Valuation erosion despite strong markets ESIO Stock price Q1 Q2 Q3 Q4 $14 $12 $10 $8 $6 $4 Our past Decreasing revenue Inflated break even point Growing losses Consuming cash Diminishing shareholder return 13 $2 $- FY13 FY14 FY15 FY16 FY17 So something had to change

14 Improved execution and market focus Drive a new business model that includes a reduced cost structure and a success model that focuses on gross margin and EBITDA expansion 14 Reduced cost structure Moved to functional organization New leadership team in place Refocused strategy
15 Reduced cost structure Quarterly revenue $90 $80 $70 $60 $50 $40 $30 $20 $10 Q1 Q2 Q3 Q4 Adjusted EBITDA breakeven FY14 FY17 Lowered adjusted EBITDA breakeven revenue level to ~$35 million/quarter Annual expense down $10 12 million Preserved investment in core business and competencies Now have a scalable business model 15 $0 FY13 FY14 FY15 FY16 FY17
16 Recent Financial Highlights Quarterly revenue Q1 Q2 Q3 Q4 Adjusted EBITDA breakeven FY18 to date Strong demand in FY18 driven by new technologies, materials, and applications Higher revenues on lower costs driving leveraged profitability FY16 FY17 FY18* *Consensus street for Q4

17 Strong Balance Sheet: Stability & Flexibility Cash Q1 Q2 Q3 Q FY18 to date Strong balance sheet and cash flow enable the execution of our growth strategy Operating cash flow in December quarter of $15.1 million Cash and investments over $100 million $30 million unused credit facility provides additional financial flexibility for working capital 17 0 FY16 FY17 FY18
18 Key takeaways for today Established new organization, cost structure and strategy Focused on high-growth market opportunities Core competencies create differentiation & barrier to entry Scalable financial model for sustained profitability 18

19 19 Markets & Products John Williams
20 What we do We enable our customers to commercialize technologies through precision laser processing. 20
21 Processes, technologies, techniques, and materials 21
22 Processes, technologies, techniques, and materials Interconnect HDI PCB Via drilling and substrate processing Flex PCBs Via drilling, routing patterning 22

23 Processes, technologies, techniques, and materials Semiconductor 23 Semiconductors Scribing & marking of wafers
24 Processes, technologies, techniques, and materials Component Passive Components Circuit trimming and MLCC testing 24


25 Served addressable markets FY18 25 $200M Semiconductor& components $700M $1.0B + $300M Flexible PCB + HDI PCB + Other industrial = ~$2.2B micro-machining


26 Rapidly growing SAM $275M Semiconductor& components + $400M $800M Flexible PCB + HDI PCB + $1.2B Other industrial micro-machining = ~$2.7B $500M increase


27 Connectivity macro market trends will drive growth Internet of things & 5G Digitized automotive 27 5G


28 28 Sense of scale Flex PCB s enable technology More complex PCB s Each via = smaller than human hair


29 29 Sense of scale = Higher density of vias, closer together More PCB s/device More devices globally x20 x1 billion
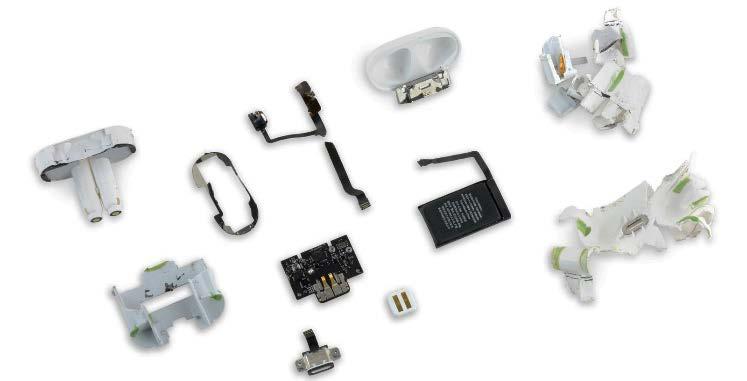


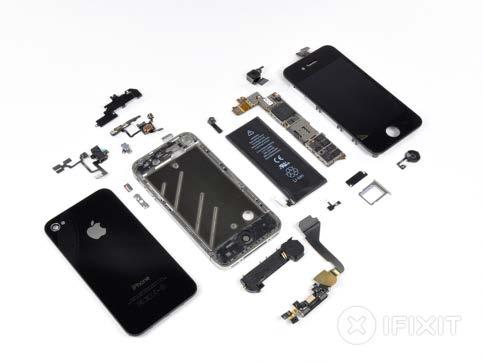
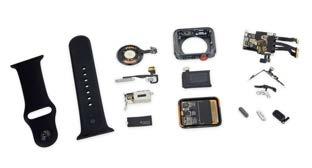
30 Flex proliferation in consumer electronics Teardown photos courtesy of ifixit

31 Customer testimonial 31
32 32 Global FPCB annual production (msqm) Flex market growth Global FPCB annual production (msqm) and ESI flex unit shipments Global FPCB annual production (msqm) >10% CAGR ESI flex unit shipments >18% CAGR ESI Flex drilling system shipments FY09 FY10 FY11 FY12 FY13 FY14 FY15 FY16 FY17 FY18 FY19 FY20 FY21 0


33 Market Share Percentage FY18 33 Semiconductor & Flexible PCB components + >30% >75% + HDI PCB <2% + Other industrial micro-machining <3% Now Next Later


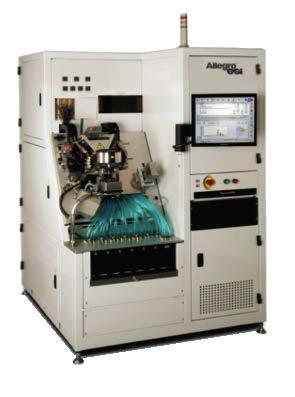
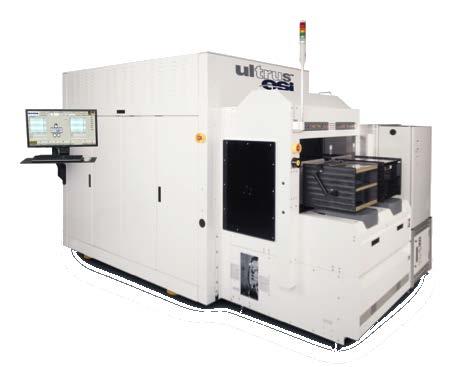

34 34 Current leadership products
35 35 New products in the next 12 months MLCC HDI Flex Summer 2018 Winter 2018 Summer 2018
36 How we differentiate Speed 36 Quality Yielded throughput Accuracy


37 How we differentiate Speed 37 Quality Accuracy Yielded throughput ESI value Cost of ownership
38 Key takeaways for today Established new organization, cost structure and strategy Focused on high-growth market opportunities Core competencies create differentiation & barrier to entry Scalable financial model for sustained profitability 38

39 39 Technologies & competencies Steve Harris
40 What we do We enable our customers to commercialize technologies through precision laser processing. 40


41 Core competencies match market requirements Patterning Via drilling Cutting Marking Trimming Component testing Micromachining 41 Aerospace Consumer electronics Automotive Semiconductors Laser material interaction Laser and optics technology Motion control
42 How we differentiate Speed 42 Quality Accuracy Yielded throughput

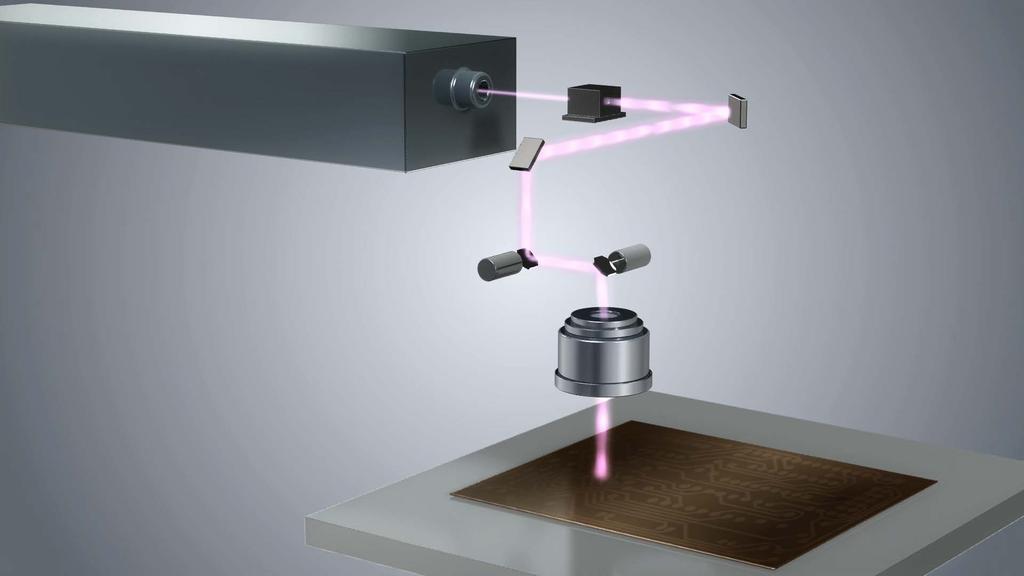
43 Production via drilling 43


44 Motion Control Mind-blowing accuracy! World record basketball shot: Top of Euromast in Rotterdam, Netherlands 321 feet ESI System Accuracy: 200,000 times greater than world record basketball shot! Equivalent to making shot from 63 miles 44

45 Core competencies in action 45
46 Core Competency: Laser Material Interaction Enabled by simulation Results: Quality, Yield Fastest time to customer solution Informed Laser and Application Development

47 Core Competency: Laser & Optics Design ESI Internal Laser Design Systems Optics design of custom and commercial components Results: Accuracy, Speed, Quality
48 Core Competency: Motion Control Proprietary controllers and algorithms ESI designed and commmercial components Results: Speed, Accuracy

49 Laser material interaction expertise Core Competency: Laser Material Interaction World class and proprietary simulation capability Results: Time to customer solution Informed Laser development Informed Application development 49
50 IP protect our R&D investment 1,300+ Active Patents and Pending Applications US Foreign ~1,000 active patents worldwide 300+ pending applications Targeted by geography and technology Willing to aggressively protect Robust process to track and defend trade secrets 50
51 Key takeaways for today Established new organization, cost structure and strategy Focused on high-growth market opportunities Core competencies create differentiation & barrier to entry Scalable financial model for sustained profitability 51

52 52 Financials Allen Muhich
53 What we do We enable our customers to commercialize technologies through precision laser processing. 53


54 Operational excellence another core competency Singapore Volume Manufacturing Scalable integration & test model Supply chain management expertise Tax benefits Proximity to customers Experienced staff 54 Demonstrated scalability Ramped flex output 500% in 6 months within cost model
55 Proven scalable financial model Revenue total in millions $400 $350 $300 $250 $200 $150 $100 $50 FY18* Revenue +122% y/y 55 $0 FY17 FY18* *Consensus street for Q4

56 Proven scalable financial model Non-GAAP Gross Margin 50% 48% FY18* Revenue +122% y/y Gross Margin +550bps y/y 56 46% 44% 42% 40% 38% FY17 FY18* *Consensus street for Q4

57 Proven scalable financial model Non-GAAP EBITDA 35% 30% 25% 20% 15% 10% 5% 0% FY18* Revenue +122% y/y Gross Margin +550bps y/y EBITDA >$100M 57-5% FY17 FY18* *Consensus street for Q4
58 Proven scalable financial model Non-GAAP EPS FY18* Revenue +122% y/y Gross Margin +550bps y/y EBITDA >$100M EPS $ (0.50) FY17 FY18* *Consensus street for Q4
59 Proven scalable financial model Cash + Investments FY18* Revenue +122% y/y Gross Margin +550bps y/y EBITDA >$100M EPS $2.62 Cash +$50M to $100M through FY18Q /31/16 12/31/17 *Consensus street for Q4

60 Proven scalable financial model Cash + Investments Uses of cash Invest in organic growth Share buyback M&A /31/16 12/31/17


61 Rapidly growing markets FY21 $275M $400M Semiconductor& components >35% share Flexible PCB HDI PCB >75% share $800M $1.2B >10% share Other industrial micro-machining >3% share = >$500M market model revenue 61

62 Financial model Revenue $300M $400M $500M $600M 62 Gross Margin % 46% - 48% 48% - 50% 49% - 51% 50% - 52% Operating Expense 24% - 26% 20% - 22% 18% - 20% 17% - 19% EBITDA 23% - 26% 28% - 30% 32% - 34% 34% - 36%
63 Updated success model 63 49% Gross margin 29% EBITDA Previous success model: 44% gross margin, 8% EBITDA
64 Key takeaways for today Established new organization, cost structure and strategy Focused on high-growth market opportunities Core competencies create differentiation & barrier to entry Scalable financial model for sustained profitability 64

65 65 Questions?