Measuring the scale and scope of Airbnb in Queenstown-Lakes District. for Queenstown-Lakes District Council November 2017
|
|
|
- Florence Hines
- 5 years ago
- Views:
Transcription
1 Measuring the scale and scope of Airbnb in Queenstown-Lakes District for Queenstown-Lakes District Council November 2017
2 All work and services rendered are at the request of, and for the purposes of the client only. Neither Infometrics nor any of its employees accepts any responsibility on any grounds whatsoever, including negligence, to any other person or organisation. While every effort is made by Infometrics to ensure that the information, opinions, and forecasts are accurate and reliable, Infometrics shall not be liable for any adverse consequences of the client s decisions made in reliance of any report provided by Infometrics, nor shall Infometrics be held to have given or implied any warranty as to whether any report provided by Infometrics will assist in the performance of the client s functions.
3
4 1 Table of contents 1. Executive Summary... 2 Queenstown-Lakes District Airbnb Heatmaps Report purpose and structure Introducing the data and framework... 7 Scope of each domain and indicators used... 7 Sector Size... 7 Housing/rental pressures... 8 Seasonality... 9 Earnings... 9 Quality About the dataset Perspectives at a District level Sector size Housing/rental pressures Seasonality Earnings Quality Comparing Queenstown and Wanaka Sector size Housing/rental pressures Seasonality Earnings Quality Comparisons of all Zones in the district Summary across all zones Sector size Housing/rental pressures Seasonality Earnings...46 Quality Other private accommodation providers Additional Airbnb heatmaps... 52
5 2 1. EXECUTIVE SUMMARY This report measures the current position of Airbnb within the Queenstown-Lakes District visitor economy. We have used data on Airbnb listings that has been coded to area units and Queenstown-Lakes District planning zones. Such geographical precision has allowed us to report on Airbnb s position within Queenstown-Lakes District as a whole, the Queenstown and Wanaka Regional Tourism Organisation (RTO) areas, and on a zone by zone basis. Insights have also been benchmarked against commercial accommodation s position in the district. Size of Airbnb in Queenstown-Lakes District There were 4,226 Airbnb listings in Queenstown-Lakes in September Airbnb has grown rapidly in Queenstown-Lakes. The number of listings has increased by 65% from 2,558 in October Nationally there were 47,425 Airbnb listings in September 2017, meaning that Queenstown-Lakes accounted for nearly 9% of total Airbnb listings. During September 2017, there was an average of 10,383 commercial stay units available in Queenstown-Lakes. In percentage terms, the number of Airbnb listings in Queenstown-Lakes was equivalent to 41% of the size of the commercial accommodation sector. This proportion grew from 25% in October There were 340,809 Airbnb stay unit nights booked in Queenstown-Lakes over the 12 months to September This equates to 14.1% of commercial accommodation stay unit nights. One reason for Airbnb having a smaller relative number of stay unit nights compared with listings is lower occupancy rates. The average occupancy rate in Airbnb over the 12-month period was 36% compared with 63% in commercial accommodation. Airbnb equated to 14.2% of guest nights in commercial accommodation in the 12 months to September Visitors tend to stay longer in Airbnb than in commercial accommodation, with average stay lengths of 4.2 and 2.5 days, respectively. Impact of Airbnb on housing and rental pressure Airbnb can potentially impact on the well-being of residents of Queenstown-Lakes by removing homes from the available rental pool. To get a sense of this we have compared the number of whole homes listed on Airbnb against the total stock of dwellings in the district. We have also examined how much of the time these homes are available on Airbnb. The key findings are: Most listings (68%) in Queenstown-Lakes are entire houses/units, rather than just spare private rooms (31%). The remaining listings (1%) consist of shared rooms. Houses/units listed on Airbnb in Queenstown-Lakes are generally 3+ bedroom family homes. 59% or 1,699 whole house listings in Queenstown- Lakes in September 2017 were 3+ bedroom homes, compared to 42% nationally. Over the 12 months to September, Queenstown-Lakes hosts who made their whole house listings available did so 70% of the time. Such a high proportion of availability suggests that in the absence of the option of
6 3 getting superior returns on Airbnb many of the properties might have been in the general rental pool. The number of whole houses available on Airbnb is equivalent to 14% of Queenstown-Lakes District s housing stock. This proportion was the highest in the country and well above the national average of 1.2%. We conclude that Airbnb has made a significant encroachment on the Queenstown- Lakes rental pool and made finding accommodation for residents substantially more difficult. Seasonality of Airbnb Seasonality is observed in both Airbnb and commercial accommodation in terms of stay unit nights, guest nights, occupancy rates. There are two peaks: mid-summer (January) and midwinter (July) which coincides with the ski-season and school holidays. May is the month with lowest activity. However, seasonality is less pronounced in Airbnb than commercial accommodation. For example, the number of Airbnb guest nights in May is equivalent to 33% of guest nights in January, whereas the comparable ratio for commercial accommodation is 51% This suggests that Airbnb is picking up slack when commercial accommodation is having more difficulty housing guests. Nevertheless, Airbnb is nibbling away at commercial accommodation even in low demand periods. Earnings from Airbnb Airbnb accommodation generated $74.5m of total revenue for hosts in Queenstown-Lakes District over the 12 months to September. This compares to $85.2m in Auckland. Airbnbs in Queenstown-Lakes accounted for 24% of total earnings in New Zealand over the period. The average Airbnb property in Queenstown-Lakes District generated $21,265 over the 12 months to September. This is about two and a half times higher than the New Zealand average of $8,707 per property. The rate per effective room in Airbnbs in Queenstown-Lakes District over the 12- month period was $111 per night, higher than the New Zealand average of $74 per night. Compared to 65 other Territorial Authorities, Queenstown-Lakes has the highest average room rate per night. Comparing Queenstown and Wanaka RTOs Airbnb listings in the Queenstown RTO account for nearly three-quarters (73%) of total listings in the Queenstown-Lakes-District, while the Wanaka RTO accounts for the other quarter (27%). Airbnb listings as a proportion of commercial accommodation are similar in Queenstown and Wanaka (both close to 40%). Queenstown listings have higher occupancy rates than Wanaka listings. As a result, Queenstown s share of guest nights (76%) is slightly higher its share of listings. The data suggests that Airbnb has a larger potential impact on the rental market for families looking for long-term accommodation in Wanaka than in Queenstown. In Wanaka, entire homes/apartments make up a larger share of Airbnbs than Queenstown. Nearly three quarters of Airbnbs in Wanaka are entire homes/apartments compared with about two thirds in Queenstown. In Wanaka, entire houses/units were available for rent 74% of days in the 12 months to September, compared with 70% in Queenstown.
7 4 Both Queenstown and Wanaka show similar seasonal patterns with summer and winter peaks. A notable difference is that Wanaka had a very strong August which in terms of most indicators was higher than its summer peak. Queenstown s January summer peak was higher than its July winter peak. Total earnings in Queenstown were more than $60m in the 12 months to September 2017, compared with $14m in Wanaka. On average, an Airbnb listing in Queenstown earned about $23,500 in the 12 months to September 2017, while the average was about $15,000 in Wanaka. The average daily rate per effective room in Airbnb in Queenstown was $115 and $90 in Wanaka over the 12-month period. Comparing Zones The report examines the characteristics of Airbnb listings in the 35 planning zones used by Queenstown-Lakes District Council. Airbnb s presence is largest in the Low Density Residential Zone which contains 49% of all properties listed on Airbnb. The High Density Residential Zone was the second largest with 11% of Airbnb listings, followed by Township (Operative) at 5% and Medium Density Residential (4.9%). We have examined the potential impact of Airbnb on the rental market in each zone. Airbnbs in Large Lot Residential zones (78%) and High (75%) and Medium (73%) Density Residential zones are more likely to be for whole houses rather than private room listings. By comparison, approximately half of listings in the Shotover Country Zone are for private rooms. The data shows that in September 64% of listings in the Low Density Residential Zone were for houses/apartments with 3 or more bedrooms. Just over half of whole houses/units in High Density Residential zones are listed with three or more bedrooms - this is high given that many properties in this area are likely to be townhouses or apartments. Zones where there are a high proportion of 1 bedroom units include Rural (34%) and Large Lot Residential (31%). Despite some variability between zones, the overarching observation is that most whole houses/units listed on Airbnb are available the majority of the time, irrespective of which zone they are located in. Airbnb consequently has a substantial impact on the availability of rentals for families. Of the $74.5m of total revenue generated for Airbnb hosts over the 12 months to September, $37.5m was made by properties in the Low Density Residential Zone. This compares to $13.0 in the High Density Residential Zone, $4.9m in the Medium Density Zone and $3.2m in the Rural Lifestyle Zone. Other private accommodation providers There were 1,193 Bookabach listings and 1,044 Holiday Homes listing in Queenstown-Lakes as at the 29 th of September This compares to 4,106 Airbnb listings in August. There is considerable overlap between the three types of listings and Infometrics estimates it likely there is in the order of 5,000 range of unique private accommodation providers in Queenstown-Lakes District.
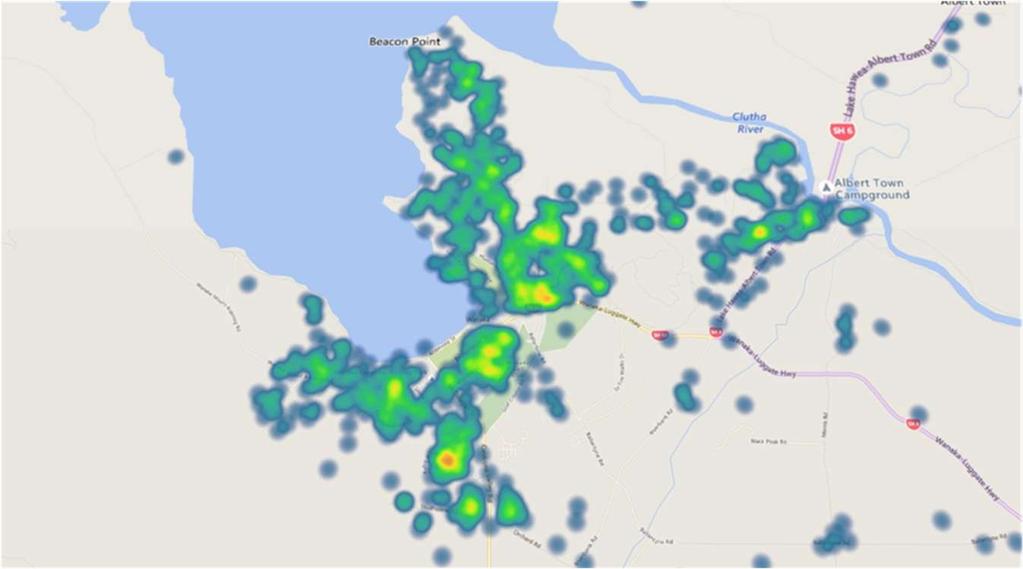

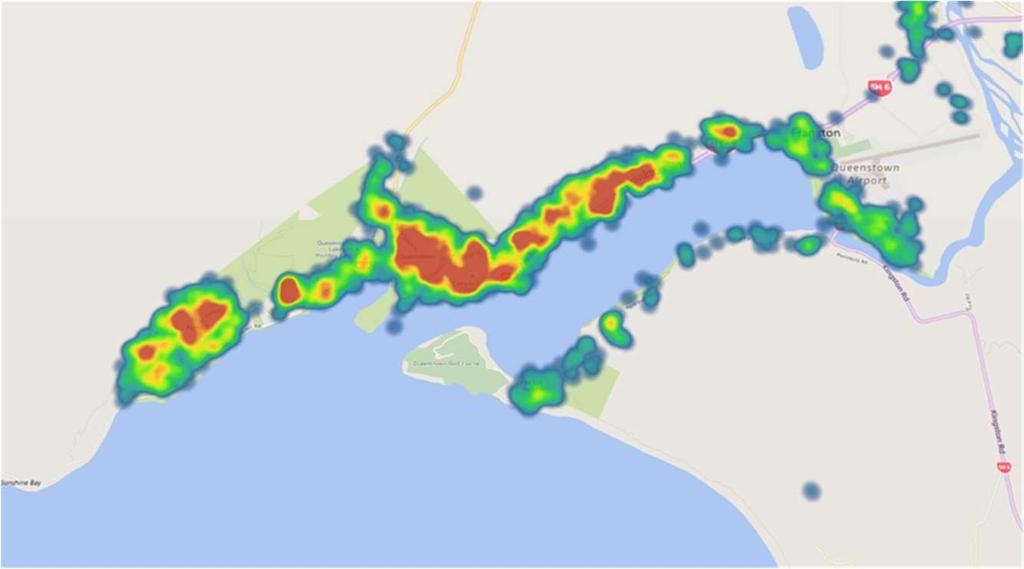
8 5 Queenstown-Lakes District Airbnb Heatmaps Queenstown-Lakes District Queenstown Wanaka
9 6 2. REPORT PURPOSE AND STRUCTURE This report measures the current position of Airbnb within the Queenstown-Lakes visitor economy. Drawing on detailed Airbnb data we provide a range of insights into the size of Airbnb in the District, stay characteristics and the impact of Airbnb on housing and rental pressures. Airbnb data has been coded to enable Infometrics to provide insights on Airbnb s position within Queenstown-Lakes District as a whole, the Queenstown and Wanaka Regional Tourism Organisation (RTO) areas and by Queenstown Lakes planning zone areas. This report has five key sections: Section 3: provides the analytical framework and six domains used to analyse Airbnb s position in the Queenstown-Lakes District. Section 4: measures the position of Airbnb within the Queenstown-Lakes visitor economy. Section 5: compares Airbnb in Queenstown-Lakes District with Wanaka and Queenstown Regional Tourism Organisations. Section 6: takes a detailed look at Airbnb s position in Queenstown-Lakes by Queenstown-Lakes District Council planning zone areas. Section 7: briefly looks at what other private accommodation platforms are offering in the area and how they compare to Airbnb. A detailed excel file accompanies this report.
10 7 3. INTRODUCING THE DATA AND FRAMEWORK To understand with the scale and nature of Airbnb s position in Queenstown-Lakes District, it is important to use a well-structured dataset that covers a broad array of subjects. This section introduces each analysis domain and why it has been chosen. Relevant background information about the dataset used is also provided. Scope of each domain and indicators used Infometrics analysis of Airbnb has been spread across five domains of interest, with a number of indicators sitting within each domain. The five domains are shown in the table below along with examples of questions that each domain can answer: Domain Sector size Housing/rental pressures Seasonality Earnings Quality Examples of questions that each domain can answer How many people in total stay in Airbnbs and what are their average occupancies? What sort of dwellings are people staying in and are these dwellings likely to have been taken out of the rental pool for the purpose of Airbnb? Are Airbnbs plugging in gaps at peak times or nibbling at commercial accommodation year-round? How much are hosts making each year and what is the average price for a room? Are Airbnb listings in Auckland getting better reviews by guests than the New Zealand average? Attention has been paid in the design of each domain to not only capture the position of Airbnb within the visitor market, but also to understand the potential for Airbnb to be affecting the availability of rental accommodation within Queenstown- Lakes District. The rest of this section discusses each domain in more detail and outlines what it is trying to address. Sector Size A necessary starting point for analysis is quantifying the underlying size of Airbnb. Establishing relevant benchmarks of size help policymakers understand the magnitude of any potential opportunities or problems, without falling into the trap of relying on unquantified anecdotes. Is Airbnb being overhyped in the media, or is it actually a significant player in Queenstown s tourism sector and a potential threat to rental affordability across the resort? The following table outlines which indicators have been included in the sector size section and what each indicator shows. Indicator Number of properties listed (capacity) Stay unit nights What the indicator shows The total number of properties listed can show the capacity of Airbnb at a point in time and this can be compared to commercial accommodation. The total number of nights over a given time period that Airbnbs have been booked in the area. This measure can
11 8 Guest nights Average stay length Occupancy rate be compared against the commercial accommodation equivalent. By assuming that guests per property are the same as guests per stay unit in commercial accommodation, we can provide an estimate of the number of guest nights. Note this estimate is likely to be conservative as guests per Airbnb may exceed their commercial accommodation equivalent when there are a lot of whole houses available for rent. How many days an average Airbnb booking is for. This measure can be compared against commercial accommodation equivalents. If guests are staying for longer on average then there is more opportunity to spend on other services when in the area. The proportion of a given time period that the Airbnb has been booked. This measure can be compared against occupancy in commercial accommodation. Housing/rental pressures Airbnb has been singled out as a potential contributor to affordability issues in Queenstown-Lakes District s housing and rental market. The housing/rental pressures domain has been carefully constructed to help fill in information gaps across these areas of concern. The key focus of the housing/rental pressures domain is understanding the characteristics of homes being rented out via Airbnb and how regularly hosts are trying to rent their properties out on the platform. These insights will show which suburbs have high concentrations of homes listed on Airbnb that would have been suitable for families to live in long-term. They will also show whether these homes are being opportunistically rented at peak times, or are likely to have been removed from the general rental pool to chase higher returns on Airbnb. The following table outlines which indicators have been included and what each indicator shows. Indicator Type of listings (eg. shared room, private room, whole house) Number of bedrooms in whole house Airbnb listings (eg. 1, 2, 3, 4+) Average proportion of the time that Airbnb is available to be booked What the indicator shows The total number of properties listed broken down by type: shared room, private room, and whole house. This data can help establish whether a listing is just a family renting a spare room or if it is an entire residential unit/home. This indicator takes the number of whole house listings and breaks these in to bedroom numbers (1, 2, 3, 4+). This indicator can help establish what type of whole houses are being rented to understand whether they are small units, or homes suitable for accommodating families. The average number of days over a time period that hosts have made the Airbnb available for rent. If the indicator shows that properties are available most of the time then it is reasonable to assume that in the absence of Airbnb the property could have been in the general rental pool or the room could have been available for a lodger/flatmate.
12 9 Airbnb listings as a proportion of the housing stock The total number of properties listed as a proportion of the dwelling stock 1. This indicator is only available for the territorial authority and not suburb level analysis. The indicator shows what proportion of homes in Queenstown-Lakes District are being used for Airbnb. It proxies the proportion of residential ratepayers that may be affected by any policy changes. Seasonality Tourism in Queenstown has traditionally had summer and winter peaks, with relatively lulls in between. However, over recent years activity has begun to spread into shoulder and low seasons, as a sharp lift in visitor numbers has exposed capacity pressures at peak times. This section investigates the seasonality of Airbnb demand across several indicators. The purpose of this section is to provide evidence as to whether Airbnb is predominantly plugging in gaps at peak times or if Airbnb is nibbling at commercial accommodation year-round. The following table outlines which indicators have been included and what each indicator shows. Indicator Stay unit nights by month Guest nights by month Occupancy rate by month What the indicator shows The total number of nights each month that Airbnbs have been booked in the area. This measure can be compared against the commercial accommodation equivalent to see if they have similar or different seasonal trends. Looking at the estimate of guest nights from the sector size section on a monthly basis. This measure can be compared against the commercial accommodation equivalent to see if they have similar or different seasonal trends. The proportion of each month that Airbnbs have been booked. This measure can be compared against occupancy in the commercial accommodation equivalent to see if they have similar or different seasonal trends. Earnings The earnings generated for hosts by providing Airbnb accommodation represent a cash injection in to the local economy. Unfortunately the intermediation of the transaction by Airbnb means this cash injection is not captured well in existing regional tourism spending estimates. This is because existing regional tourism estimates only effectively capture card spending with local merchants. This section gives insights into how much money is flowing into the local economy and into each property owner s back pocket as a result of Airbnb. It also gives insights into the average price that Airbnb guests are paying each night. 1 Infometrics' dwelling stock estimates are based on the local authority breakdown of the dwelling stock available from the census. Changes in the regional dwelling stock between censuses are determined by residential building activity at a local authority level alongside an allowance for the scrappage of existing dwellings. These quarterly estimates at a local authority level are consistent with quarterly nationwide estimates of the dwelling stock regularly published by Statistics NZ.
13 10 The following table outlines which indicators have been included and what each indicator shows. Indicator Total earnings of all properties Average earnings for each property Average daily rate ($) per effective room What the indicator shows The total revenue earned by all properties in the area over a given time period (includes cleaning fees). This indicator represents the total cash injection in to the local economy from Airbnb earnings. The average earnings of each property is estimated by dividing total revenue in an area by the number of properties available for rent on Airbnb over a given time period. This indicator represents the return which each property owner is earning on average from listing their property on Airbnb. Each listing s price (including cleaning fees) is converted into an effective room rate by taking in to consideration the number of bedrooms in the listing. An average of this effective room rate is formed across all listings in the area over a given time period. This indicator represents how much it costs on average to rent a room with Airbnb. Quality A common complaint from the commercial accommodation sector is that Airbnb accommodation has no assurance of quality and that could undermine visitors experiences. However, these complaints do not tell the whole story. Airbnb has its own selfregulating quality framework. This framework is driven by a peer reviewing system that effectively pushes private households into ensuring they deliver a quality experience. If someone gets bad reviews, either they will need to lift their game, or the market will squeeze them out. This section gives insights into the quality of Airbnb properties within Queenstown- Lakes District by comparing ratings within the district and against other parts of New Zealand. The following table outlines which indicators have been included and what each indicator shows. Indicator Average property rating by Airbnb guests What the indicator shows The average rating (out of 5) by guests for properties in the area. This indicator signals how content Airbnb guests have been with the quality of their accommodation and the experience received. About the dataset Actual listings data from Airbnb has been used in this report. The raw data has been sourced from Airbnb by a third-party provider, with the information collected on a monthly basis stretching back to October Infometrics has coded this information to territorial authorities, regional tourism organisation (RTO) and area unit boundaries. The raw data has also been coded by Queenstown-Lakes District Council planning zones. By categorising the data in this format, comparisons have been able to be made against other territorial authorities and RTOs to see where Queenstown-Lakes district fits in against the rest of New Zealand.
14 11 Data categorised this way is also directly comparable against other publiclyavailable datasets. For example, within the report all indicators under the sector size and seasonality domains have been compared to their commercial accommodation equivalents at a territorial authority or RTO level. Commercial accommodation data is sourced from Statistics NZ s Commercial Accommodation Monitor. This survey-based dataset goes down to a fine level of detail, including by RTO area and territorial authorities. Infometrics' dwelling stock estimates are based on the local authority breakdown of the dwelling stock available from the census. Changes in the regional dwelling stock between censuses are determined by residential building activity at a local authority level alongside an allowance for the scrappage of existing dwellings. These quarterly estimates at a local authority level are consistent with quarterly nationwide estimates of the dwelling stock regularly published by Statistics NZ.
15 12 4. PERSPECTIVES AT A DISTRICT LEVEL This section looks at data on Airbnb in Queenstown-Lakes District. Comparisons to commercial accommodation and ranking against other territorial authorities are made where appropriate. Table 1 provides a summary of all indicators discussed in this section for Queenstown-Lakes and New Zealand. Subsequent sections break down the insights from Table 1 into Queenstown and Wanaka (Section 5), and then further into zone level analysis (Section 6). Table 1: Queenstown-Lakes District Summary Queenstown- Lakes District Airbnb New Zealand Commercial accommodation Queenstown- Lakes District Airbnb as % of Commercial Number of listings 4,226 47,425 10,383 41% Stay unit nights 26, , ,386 Total over year to September ,809 2,619,334 2,411,455 14% Guest nights 50, , ,882 Total over year to September ,714 4,687,223 4,403,800 14% Average stay length Average over year to September Occupancy 24% 17% 56% Average over year to September % 28% 63% Type of listings (% of total) Whole house/unit 68% 50% Private room 31% 48% Shared room 0.9% 1.5% Bedrooms in whole house listings (% of total) 1 bedroom 20% 31% 2 bedrooms 21% 27% 3 bedrooms 34% 25% 4+ bedrooms 25% 17% Airbnb listings as % of housing stock Sept % 1.2% Total earnings 12 months to September 2017 $74,468,151 $315,254,292 Average daily room rate 12 months to Sep $111 $74 Quality Data is for September 2017 unless otherwise stated A detailed account of each indicator follows. Sector size This domain helps establish a baseline understanding of the underlying size of Airbnb, average stay lengths by guests, and the occupancy rates of Airbnb properties. All indicators in this domain have been compared against their commercial accommodation equivalents and have been ranked against other territorial authorities. Capacity The total number of properties listed on Airbnb shows the capacity of Airbnb at a point in time. There were 4,226 Airbnb listings in Queenstown-Lakes in September At the same point in time there were 47,425 Airbnb listings nationally meaning that Queenstown-Lakes accounts for nearly 9% of total Airbnb listings.
16 13 Having now established the size of Airbnb s footprint in Queenstown-Lakes District, it is interesting to put these counts alongside numbers from the commercial accommodation sector. This step enables us to get a feel for how many people are choosing Airbnb over hotels, motels, and other traditional options. If, on any given night, all Airbnb hosts were willing to let out their rooms, then the 4,226 listings that were available as at September 2017 would compare to an average of 10,383 commercial stay units that were available. In percentage terms, the number of Airbnb listings in Queenstown-Lakes was equivalent to 41% of the size of the commercial accommodation sector in September This proportion was higher than at a New Zealand level (35%). These proportions have risen from 25% and 18% respectively back in October Table 2: Airbnb listings compared to commercial accommodation listings Queenstown-Lakes District New Zealand Oct-16 Sep-17 Change Oct-16 Sep-17 Change Airbnb 2,558 4,226 65% 24,519 47,425 93% Commercial accommodation 10,412 10,383 0% 138, ,891-3% Airbnb as % of commercial accommodation 25% 41% 18% 35% Airbnb has grown rapidly in Queenstown-Lakes. The number of listings increased from 2,558 in October 2016 to 4,226 listings in September 2017, an increase of 65%. Queenstown-Lakes has not grown as quickly as other regions, but still has the second higher number of Airbnb listings across New Zealand, behind only Auckland. In September, Queenstown-Lakes District had the 11th largest ratio of Airbnb properties listed to commercial accommodation stay units across 66 2 territorial authorities. Many other areas with high number of Airbnb properties relative to commercial accommodation stay units tended to be areas with very small commercial accommodation capacity for example, Porirua with 196 commercial stay units available, compared to 243 Airbnb listings. 2 There are 67 territorial authorities in New Zealand. However, our analysis only includes 66 as it excludes The Chatham Islands.
17 14 Figure 1: Airbnb property listings and commercial accommodation stay units Listing numbers in Queenstown-Lakes District Airbnb vs commercial accommodation 12,000 Airbnb Commercial accommodation 10,000 8,000 6,000 4,000 2,000 0 Oct-16 Nov-16 Dec-16 Jan-17 Feb-17 Mar-17 Apr-17 May-17 Jun-17 Jul-17 Aug-17 Sep-17 Stay unit nights Stay unit nights show the total number of nights that Airbnbs have been booked. There were 340,809 Airbnb stay unit nights booked in Queenstown-Lakes over the 12 months to September Over the same period slightly more than 2.4 million stay unit nights were booked in commercial accommodation. The number of Airbnb stay unit nights in the 12 months to September equated to 14% of commercial accommodation stay unit nights. This was somewhat higher than the national figure of 12%. Table 3: Stay unit nights over the year to September 2017 Stay unit nights Queenstown- New Lakes District Zealand Airbnb 340,809 2,619,334 Commercial accommodation 2,411,455 22,308,546 Airbnb % of commercial 14.1% 12% The reason for Airbnb having a smaller relative number of stay unit nights compared with listings is due to lower occupancy rates. Not all Airbnb hosts are looking to have visitors year-round. Instead some hosts may only be filling up spare rooms at peak times, or renting out their house periodically when they are out of town. By comparison, commercial operators are always aiming to fill their rooms to maximise their return on investment. This is addressed in the occupancy rate indicator. Queenstown-Lakes District has the 11 th highest proportion of Airbnb stay unit nights relative to commercial stay unit nights out of 66 territorial authorities. Ahead of Queenstown-Lakes are (amongst others) Waikato district and Selwyn District at first and second place, respectively.
18 15 Figure 2: Airbnb and commercial accommodation stay unit nights in Queenstown-Lakes District Stay unit nights Airbnb vs commercial accomodation 45,000 40,000 35,000 30,000 25,000 20,000 15,000 Airbnb 10,000 Commercial accommodation 5,000 (RHS) 0 Oct-16 Nov-16 Dec-16 Jan-17 Feb-17 Mar-17 Apr-17 May-17 Jun-17 Jul-17 Aug-17 Sep Guest nights Airbnb guest nights have been estimated by assuming that guests per property are the same as guests per stay unit in commercial accommodation. We believe this estimate is likely to be conservative as guests per Airbnb may exceed their commercial accommodation equivalent when there are a lot of whole houses available for rent on Airbnb in an area. Our estimates show that there were 626,714 guest nights in Queenstown-Lakes District over the 12 months to September By comparison, there were 4,403,800 guest nights in commercial accommodation over the same period. The relative size of Airbnb to commercial accommodation guest nights was 14.2% over the 12 month period. Queenstown had the second highest number of guest nights per month out of 66 territorial authorities, behind only Auckland. Table 4: Guest nights in the 12 months to September 2017 Guest nights Queenstown- New Lakes District Zealand Airbnb 626,714 4,687,223 Commercial accommodation 4,403,800 39,022,755 Airbnb as % of commercial 14.2% 12.0% Average stay length This indicator shows the average number of days that guests are staying in Airbnb accommodation in the area. If guests are staying for longer on average then there is more opportunity to increase their overall spend in the area. Guests stayed on average 4.2 nights in Airbnbs in Queenstown-Lakes District over the 12 months to September. This is above the national average of 3.9.
19 16 Guests stayed in commercial accommodation in Queenstown-Lakes District for an average of 2.5 nights over the 12 months to September Table 5: Average length of stay over the 12 months to September2017 (days) Stay length (days) Queenstown- Lakes District New Zealand Airbnb Commercial accommodation Airbnb as % of commercial 168% 199% Airbnb guests in Queenstown-Lakes District stayed the third longest out of 66 territorial authorities in the 12 months to September. In these authorities, 1.0% to 2.0% of listings appeared to be used as long-term rentals (occupied by a single guest for more than 20 days a month). Figure 3: Guests average length of stay in Airbnb and commercial accommodation Length of stay Airbnb vs commercial accommodation Airbnb Commercial accommodation 0.0 Oct-16 Nov-16 Dec-16 Jan-17 Feb-17 Mar-17 Apr-17 May-17 Jun-17 Jul-17 Aug-17 Sep-17 Occupancy This indicator measures the proportion of nights an accommodation listing is booked over a specific period. We estimate that Airbnb properties in Queenstown-Lakes District averaged 36% occupancy over the 12 months to September. This compares with the national average of 28%. It is important to note that included in our Airbnb occupancy rate are properties which may have not been made available for the entire month. We include these properties in order to ensure the rate is directly comparable with the commercial accommodation equivalent (which assumes availability 100% of the time). Over the 12 months to September, the average occupancy rate of commercial accommodation was 63%, which is well above the national average of just 44%. This commercial accommodation rate includes hotels and motels, along with holiday parks and camping grounds.
20 17 As explained earlier, it is not surprising to see that Airbnb properties operate with lower occupancy rates. Not all Airbnb hosts are looking to have visitors year-round. Instead, some hosts may only fill spare rooms at peak times, or rent out their house periodically when they are out of town. By comparison, commercial operators are always aiming to fill their rooms to maximise their return on investment. Even so, over the 12 months to September, Queenstown-Lakes had the sixth highest Airbnb occupancy rate across 66 territorial authorities. Table 6: Average occupancy rate in the 12 months to September 2017 Occupancy rate Queenstown- New Lakes District Zealand Airbnb 36% 28% Commercial accommodation 63% 44% Airbnb as % of commercial 57% 64% Housing/rental pressures The key focus of the housing/rental pressures domain is understanding the characteristics of homes being rented out via Airbnb and how regularly hosts are trying to rent their properties out on the Airbnb platform. These insights show which areas have high concentrations of homes listed on Airbnb that would have been suitable for families to live in long-term. They also show whether these homes are being opportunistically rented at peak times, or are likely to have been removed from the general rental pool to chase higher returns on Airbnb. Benchmarking the number of whole homes listed on Airbnb against the total number of dwellings in Queenstown-Lakes District gives further insight as to how much of the area s housing pool has been directly influenced by Airbnb. The key findings of this section are: Most listings (68% or 2,884 houses) in Queenstown-Lakes are entire houses/units, rather than just spare private rooms (31%). Nationally these proportions are 50% and 48% respectively. Houses/units listed on Airbnb in Queenstown-Lakes are generally 3+ bedroom family homes. 59% or 1,699 whole house listings in Queenstown- Lakes are 3+ bedroom homes, compared to 42% nationally. Over the 12 months to September, Queenstown-Lakes hosts made their whole house listings available 70% of the time. Such a high proportion of availability suggests that in the absence of the option of getting superior returns on Airbnb many of the properties might have been in the general rental pool. The number of whole houses available on Airbnb was equivalent to 14% of Queenstown-Lakes District s housing stock in the September 2017 quarter. This proportion was the highest in the country and well above the national average of 1.2%.
21 18 This domain considers these pressures at a district-wide level. Sections 5 and 6 of this report a similar framework of housing pressures is considered for Queenstown and Wanaka and then on a zone-by-zone basis. Type of listings The type of listings indicator breaks the total number of properties listed on Airbnb down by type: shared room, private room, and whole house. This data can help establish whether a listing is just a family renting out a spare room or if it is an entire residential unit/home. Just over two-thirds (68% or 2,884) of Airbnb listings in Queenstown-Lakes District in September 2017 were whole houses/units. Another 31% (1,302 listings) were private rooms and 0.9% (36 listings) were shared rooms. At a national level 50% of listings were whole houses/units, 48% were private rooms, and 1.5% were shared rooms. Queenstown-Lakes District has the fourth highest proportion of Airbnb listings that are entire houses or units out of 66 territorial authorities. Table 7: Airbnb listings by type, September 2017 Type of listing Queenstown-Lakes New Zealand District Number Proportion Number Proportion Entire home/apt 2,884 68% 23,890 50% Private room 1,302 31% 22,775 48% Shared room % % This high proportion of whole house/unit listings suggests that a lot of Airbnbs in Queenstown-Lakes District are suitable for rentals, rather than hosts earning a little bit of extra money from spare rooms. It is useful to now look at the nature of these houses/units to see if they are 3 or 4 bedroom family homes, or if they are small units more suitable for singles or couples. Number of bedrooms in whole house listings This indicator takes the number of whole house listings and breaks these in to bedroom numbers (1, 2, 3, 4+). This indicator can help establish what type of whole houses are being rented to understand whether they are small units, or homes suitable for accommodating families. In September 2017, 59% (1,699) of whole house/unit Airbnb listings in Queenstown-Lakes District were for 3+ bedroom properties, while 21% were for 2 bedroom homes and 20% were for 1 bedroom properties. By comparison, at a national level, 42% were for 3+ bedroom homes, 27% for 2 bedroom, and 31% for 1 bedroom properties. Queenstown-Lakes District has the fourth highest proportion of whole house/unit listings that have 3 or more bedrooms.
22 19 Table 8: Entire house/unit Airbnb listings by number of bedrooms, September 2017 Number of bedrooms Queenstown-Lakes District New Zealand Number Proportion Number Proportion % 7,491 31% % 6,461 27% % 5,903 25% % 4,035 17% *Total shares may not add to 100% due to some observations missing information on number of bedrooms (<1%) This high proportion of 3+ bedroom homes available on Airbnb indicates that there are significant numbers of homes being listed that would have been suitable for a family to rent. The big question now is whether hosts in Queenstown-Lakes are only opportunistically renting out their home on occasions or if there is evidence that houses are being taken out of the general rental pool to list on Airbnb. Proportion of time Airbnb is available to book This indicator shows the average number of days over a time period that hosts have made their property available to rent on Airbnb. Understanding how frequently hosts are willing to rent out their property enables us to ascertain whether it is reasonable to assume that in the absence of Airbnb, the home could have potentially been added to the general rental pool. Entire home/unit listings in Queenstown-Lakes District were on average available for rent 70% of the time over the 12 months to September By comparison, at a national level, whole home/unit listings on Airbnb were available to rent on average 68% of the time over the year to September Table 9: The proportion of time Airbnb properties have been available for over the year to September 2017 Queenstown- Lakes District New Zealand Entire houses/units 70% 68% All listing types 69% 70% Table 9 shows that availability for entire houses/units in Queenstown-Lakes District is slightly higher than for all property types generally (including private and shared listings). The opposite is true nationally. Given that properties are available to rent on Airbnb such a high proportion of the time suggests that in the absence of Airbnb many of the properties in Queenstown- Lakes could have potentially been in the general rental pool.
23 20 Nevertheless, Queenstown-Lakes only ranks 54 th out of 66 territorial authorities for the average proportion of time that whole homes were available to rent over the 12 months to September It seems that most Airbnb properties across territorial authorities are being made available a large proportion of the time. The territorial authorities where whole houses on Airbnb are available for booking the highest proportion of the time are generally small districts, but many tourist hotspots in the South Island were also above Queenstown-Lakes. Whole house listings in Central Otago District were available to book for 77% of the time in the 12 months to September, while whole house listings in the Mackenzie District and Hurunui District were available for 77% and 84% of the time respectively. The fact that houses in Queenstown-Lakes were still available most of the time, coupled with the sheer volume of large houses, suggests there is likely to have been significant encroachment into the district s rental pool. To further come to grips with the magnitude of this problem, it is important to ascertain the number of whole house listings on Airbnb in Queenstown-Lakes compared to the number of dwellings in the district s housing stock. Airbnb listings as proportion of housing stock This indicator shows what proportion of homes in Queenstown-Lakes District are being offered as whole house listings on Airbnb. It proxies the proportion of residential ratepayers that may be affected by any policy changes that affect whole house listings. The data shows that Airbnb entire homes/units listed in Queenstown-Lakes District are equivalent to approximately 14% of the 19,376 dwellings in the district. Nationally the ratio stands at 1.2%. Table 10: Airbnb listings as a % of the housing stock Queenstown- Lakes District New Zealand Airbnb listings* 2,640 21,964 Total housing stock** 19,376 1,828,438 Airbnb as % of total stock 14% 1.2% * Whole houses/apartments only ** Housing stock estimations by Infometrics Compared to other territorial authorities, Queenstown-Lakes District has the highest number of whole houses listed on Airbnb as a proportion of the total dwelling stock. Ruapehu District comes in second place, with the number of listings on Airbnb equating to about 3.5% of the dwelling stock in the June 2017 quarter. The 6,011 entire house/apartments listed on Airbnb in the June quarter in Auckland represents approximately 1.4% of the 544,806 dwellings in our biggest city. Seasonality This domain investigates the seasonality of Airbnb demand across several indicators.
24 21 The purpose of this domain is to provide evidence as to whether Airbnb is predominantly plugging in gaps at peak times or if Airbnb is nibbling at commercial accommodation year-round. Stay unit nights by month This indicator shows stay unit nights on a month-by-month basis so that seasonal trends can be explored. Stay unit nights were at their highest in January in Queenstown-Lakes District. Data from the commercial accommodation monitor shows that January also had the highest number of stay unit nights over the year. Figure 4: Monthly stay nights in Airbnb and commercial accommodation Stay unit nights Airbnb vs commercial accomodation 45,000 40,000 35,000 30,000 25,000 20,000 15,000 Airbnb 10,000 Commercial accommodation 5,000 (RHS) 0 Oct-16 Nov-16 Dec-16 Jan-17 Feb-17 Mar-17 Apr-17 May-17 Jun-17 Jul-17 Aug-17 Sep Guest nights by month This indicator shows the estimate of guest nights on a month-by-month basis so that seasonal trends can be explored. Guest nights were at their highest in January 2017 in Queenstown-Lakes District. July 2017 saw the second highest number of guest nights, coinciding with the winter ski season. Comparing this indicator against the commercial accommodation equivalent shows a similar seasonal peak summer season trend. Both Airbnb and commercial accommodation have the highest number of guest nights occurring in January. Of note is the higher winter peak in the Airbnb data compared to commercial accommodation.
25 22 Figure 5: Monthly guest nights at Airbnb and Commercial Accommodation Queenstown-Lakes District guest nights Airbnb vs commercial accommodation 90,000 80,000 70,000 60,000 50,000 40,000 30,000 20,000 10,000 Airbnb Commercial accommodation (RHS) 0 Oct-16 Nov-16 Dec-16 Jan-17 Feb-17 Mar-17 Apr-17 May-17 Jun-17 Jul-17 Aug-17 Sep , , , , , ,000 0 Occupancy rate by month This indicator shows the proportion of each month that Airbnbs have been booked. By looking at occupancy on a month-by-month basis seasonal trends can be established. Occupancy in Airbnbs in Queenstown-Lakes was highest in January 2017, a similar trend that occurs across New Zealand. Occupancy in Airbnbs in Queenstown-Lakes during this peak month is the seventh highest across 66 territorial authorities. Comparing Airbnb against commercial accommodation shows that occupancy for Airbnbs in Queenstown-Lakes across all months is lower. However, peak times do coincide and the gap is proportionally smaller at these peaks, suggesting that Airbnb is picking up slack when commercial accommodation is having more difficulty accommodating guests. Figure 6: Month-by-month occupancy rate in Airbnb and commercial accommodation Occupancy rate in Queenstown-Lakes District Airbnb vs commercial accommodation 90% Airbnb 80% Commercial accommodation 70% 60% 50% 40% 30% 20% 10% 0% Oct-16 Nov-16 Dec-16 Jan-17 Feb-17 Mar-17 Apr-17 May-17 Jun-17 Jul-17 Aug-17 Sep-17 Earnings This domain provides insights into how much money is flowing into the local economy and to each property owner. It also provides insights into the average price that Airbnb guests are paying each night.
26 23 Table 11: Earnings from Airbnb in the 12 months to September 2017 Queenstown- Lakes District Auckland New Zealand Total earnings $74,468,151 $85,198,111 $315,254,292 Average earnings per property $21,265 $6,857 $8,707 Average daily rate per room $111 $74 $74 Total earnings of all properties This indicator represents the total cash injection in to the local economy from Airbnb earnings. It is defined as the total revenue (including cleaning fees) earned by all properties in the area over a given time period. Airbnb generated $74.5m of total revenue for hosts in Queenstown-Lakes District over the year to September. This compares to $85.2m in the much larger Auckland. Airbnbs in Queenstown-Lakes accounted for 24% of total earnings in New Zealand over the 12-month period. The highest monthly earnings were measured in July. In terms of overall earnings over the 12 months to September, Queenstown-Lakes District ranked second out of 66 Territorial Authorities, behind Auckland. Figure 7: Total monthly earnings from Airbnb listings Airbnb total earnings 12 months to September 2017 Queenstown-Lakes District $12,000,000 New Zealand (RHS) $10,000,000 $8,000,000 $6,000,000 $4,000,000 $2,000,000 $0 Oct-16 Nov-16 Dec-16 Jan-17 Feb-17 Mar-17 Apr-17 May-17Jun-17 Jul-17 Aug-17 Sep-17 $45,000,000 $40,000,000 $35,000,000 $30,000,000 $25,000,000 $20,000,000 $15,000,000 $10,000,000 $5,000,000 $0 Average earnings for each property The average earnings of each property are estimated by dividing total revenue in an area by the number of properties available for rent on Airbnb over a given time period. This indicator represents the return which each property owner is earning on average from listing their property on Airbnb. The average Airbnb property in Queenstown-Lakes District generated $21,265 over the year to September. This is significantly higher than the New Zealand average of $8,707 per property. Queenstown-Lakes hosts made the highest amount of money per property across 66 Territorial Authorities in the 12 months to September It is also interesting to consider earnings on a monthly basis, to ascertain whether average earnings are higher at peak times.
27 24 Figure 8: Average monthly earnings per property Airbnb total earnings per month 12-months to September 2017 $3,500 $3,000 $2,500 New Zealand Queenstown-Lakes District $2,000 $1,500 $1,000 $500 $0 Oct-16 Nov-16 Dec-16 Jan-17 Feb-17 Mar-17 Apr-17 May-17 Jun-17 Jul-17 Aug-17 Sep-17 Queenstown-Lakes Airbnb s earned about four times more during the peak summer season than they did in May. Properties listed in January earned just shy of $3,000 on average each, compared to just $708 in May. Earnings spike again in July, with properties on average earning $2,393 each. This premium reflects high demand for property during the peak summer and skiing seasons, particularly for times that coincide with school holidays. Average daily rate ($) per effective room This indicator measures how much it costs on average to rent a room with Airbnb. It is calculated per effective room so that fair comparisons can be made across areas, even if there are a different composition of property types. Each listing s price (including cleaning fees) is converted into an effective room rate by taking in to consideration the number of bedrooms in the listing and then averaging across all listings. The data shows that the average daily rate per effective room in Airbnbs in Queenstown-Lakes District over the 12 months to September was $111 per night. This compares to the NZ average of $74 per night. Compared to 65 other Territorial Authorities, Queenstown has the highest average room rate per night. It is also interesting to consider these effective room rates on a monthly basis, to ascertain whether average daily rates are higher at peak times.
28 25 Figure 9: Daily effective room rate, month-by-month Daily effective room rate Month by month average $140 Queenstown-Lakes District New Zealand $120 $100 $80 $60 $40 $20 $0 Oct-16 Nov-16 Dec-16 Jan-17 Feb-17 Mar-17 Apr-17 May-17 Jun-17 Jul-17 Aug-17 Sep-17 Room rates in Queenstown-Lakes peaked during summer months at above $120 in December and January and fell to $95 per room in May. A similar trend appears across New Zealand. Quality This domain shows insights into the quality of Airbnb properties within Queenstown-Lakes District by comparing ratings within the district and against other parts of New Zealand. Average property rating by Airbnb guests This indicator signals how content Airbnb guests have been with the quality of their accommodation and the experience received by measuring the average rating out of 5 by guests for properties in the area. The data shows that the average rating for Airbnb properties in Queenstown-Lakes District is 4.8. This compares to the NZ average of 4.7. Table 12: Average Airbnb property ratings, 12 months to September 2017 Queenstown- Lakes District Auckland New Zealand Average rating
29 26 5. COMPARING QUEENSTOWN AND WANAKA Not only does the Crown Range provide a geographical separation between the Queenstown and Wanaka sides of the district, but in terms of destination marketing and promotion the two areas are independently represented by two separate Regional Tourism Organisations (RTOs). These RTOs are called Destination Queenstown and Lake Wanaka Tourism. This section outlines data on Airbnb in the Destination Queenstown RTO (Queenstown) and the Lake Wanaka Tourism RTO (Wanaka). Comparisons to commercial accommodation and ranking against other RTOs are provided where appropriate. The analysis will cover the five domains. Table 13 provides a summary of the indicators we calculate for each of the RTOs. Table 13: Queenstown and Wanaka RTO Airbnb summary Queenstown RTO Wanaka RTO New Zealand Number of listings 3,084 1,142 47,425 Stay unit nights 20,006 6, ,904 Sum over year to September ,998 79,811 2,619,334 Guest nights 37,615 12, ,855 Sum over year to September , ,064 4,687,223 Average stay length Average over year to September Occupancy 25% 22% 17% Average over year to September % 28% 28% Type of listings (% of total) Whole house/unit 66% 74% 50% Private room 33% 26% 48% Shared room 1.1% 0.1% 1.5% Bedrooms in whole house listings (% of total) 1 bedroom 19% 21% 31% 2 bedrooms 22% 20% 27% 3 bedrooms 35% 31% 25% 4+ bedrooms 24% 28% 17% Total earnings 12 months to September 2017 $60,453,684 $14,014,467 $315,254,292 Average daily room rate 12 months to Sep $117 $92 $74 Quality All data is for September 2017 unless otherwise specified Sector size To establish a baseline understanding of the size of Airbnb, we analyse the number of listings, the average length of stay by guests, and the occupancy rate to Airbnb properties. Capacity The total number of properties listed can show the capacity of Airbnb at a point in time.
30 27 Table 14: Listings in Queenstown and Wanaka RTOs, September 2017 Queenstown RTO Wanaka RTO Level % of QLDC total Level % of QLDC total Airbnb 3,084 73% 1,142 27% Commercial accommodation 7,501 73% 2,843 27% Airbnb as % of commercial accommodation 41% 40% Airbnb listings in Queenstown account for nearly three-quarters (73%) of total listings in the Queenstown-Lakes-District. Wanaka accounts for the other quarter (27%). Airbnb listings as a proportion of commercial accommodation are similar in Queenstown and Wanaka. The proportion is close to 40% in both RTOs. Stay unit nights Stay unit nights show the total number of nights that Airbnbs have been booked in the area. Table 15: Stay unit nights by RTO in the 12 months to September 2017 Queenstown RTO Wanaka RTO Level % of QLDC total Level % of QLDC total Airbnb 260,998 77% 79,811 23% Commercial accommodation 1,950,350 81% 461,104 19% Airbnb as % of commercial accommodation 13% 17% There were nearly 261,000 Airbnb stay unit nights in Queenstown over the 12 months to September 2017, which accounted for 77% of the total in the district. In terms of stay unit nights Airbnb has a slightly larger share of the commercial accommodation market in Wanaka compared with Queenstown. Relative to other Regional Tourism Organisations, Queenstown has the highest proportion of Airbnb to commercial accommodation stay unit nights. Wanaka comes in at a close second. Guest nights Guest nights have been estimated by assuming that guests per property are the same as guests per stay unit in commercial accommodation. This estimate is likely to be conservative as guests per Airbnb may exceed their commercial accommodation equivalent when there are a lot of whole houses available for rent on Airbnb in an area.
31 28 Table 16: Guest nights by RTO in the 12 months to September 2017 Queenstown RTO Wanaka RTO Level % of QLDC total Level % of QLDC total Airbnb 479,650 77% 147,064 23% Commercial accommodation 3,543,460 80% 860,338 20% Airbnb as % of commercial accommodation 14% 17% Over the 12 months to September, there were about 480,000 guest nights in Queenstown which accounted for more than 75% of total guest nights in the district, with Wanaka accounting for the rest. In terms of guest nights Airbnb has a slightly larger share of the total market in Wanaka compared with Queenstown. Average stay length This indicator shows the average number of days that guests are staying in Airbnb accommodation in the area. If guests are staying for longer on average then there is more opportunity to increase their overall spend in the area. Guests stayed similar lengths of time in Airbnbs in Queenstown and Wanaka, for an average of 4.2 and 4.1 days over the 12 months to September 2017, respectively. This compares to an average length of stay of 3.9 days nationally. The number of days that guests spend per reservation in Airbnbs is much longer than in commercial accommodation. Table 17: Average length of stay by RTO over the 12 months to September 2017 (days) Stay length Queenstown Wanaka RTO RTO QLDC total Airbnb Commercial accommodation Airbnb as % of commercial accommodation 164.4% 186.9% 167.4% Occupancy This indicator measures the proportion of nights an accommodation listing is booked over a specific time period. Table 18 shows that Airbnbs in Queenstown (33%) had a higher average occupancy rate than Wanaka (28%) over the 12 months to September. In both RTOs the Airbnb occupancy rates were substantially lower than in commercial accommodation. The gap in Queenstown (37 percentage points) was substantially larger than in Wanaka (16 percentage points).
32 29 Table 18: Average occupancy rate by RTO in the 12 months to September 2017 Occupancy Queenstown RTO Wanaka RTO Airbnb 33% 28% Commercial accommodation 70% 44% Airbnb as % of commercial accommodation 47% 62% Housing/rental pressures The key focus of the housing/rental pressures domain is understanding the characteristics of homes being rented out via Airbnb and how regularly hosts are trying to rent their properties out on the platform. These insights show which RTOs have high concentrations of homes listed on Airbnb that would have been suitable for families to live in long-term. They also show whether these homes are being opportunistically rented at peak times, or are likely to have been removed from the general rental pool to chase higher returns on Airbnb. Type of listings This indicator breaks the total number of properties listed on Airbnb down by type: shared room, private room, and whole house. This data can help establish whether a listing is just a family renting a spare room or if it is an entire residential unit/home. Table 19: RTO listings by type, September 2017 Type of listing Queenstown RTO Wanaka RTO Number Proportion Number Proportion Entire home/apt 2,038 66% % Private room 1,007 33% % Shared room % 1 0% Table 19 shows that entire homes/apartments make up a larger share of Airbnbs in Wanaka compared with Queenstown. Nearly three quarters of Airbnbs in Wanaka are entire homes/apartments compared with about two thirds in Queenstown. Number of bedrooms in whole house listings This indicator takes the number of whole house listings and breaks these in to bedroom numbers (1, 2, 3, 4+). This indicator can help establish what type of whole houses are being rented to understand whether they are small units, or homes suitable for accommodating families.
33 30 Table 20: Entire house/unit Airbnb listings by number of bedrooms and RTO, September 2017 Number of bedrooms Queenstown RTO Wanaka RTO Number Proportion Number Proportion % % % % % % % % Total 2, There are no material differences between Queenstown and Wanaka in terms of Airbnb house size. A similar proportion of houses (nearly six out of ten) have 3 bedrooms or more in both RTOs. Proportion of time Airbnb is available to book This indicator shows the average number of days over a time period that hosts have made their property available to rent on Airbnb. Table 21 provides further evidence that Airbnb has a larger potential impact on the rental market for families looking for long term accommodation in Wanaka compared with Queenstown. In Wanaka entire houses/units were available for rent 74% of days in the 12 months to September 2017, compared with 70% in Queenstown. Table 21: Proportion of time whole house/units Airbnbs have been available over the 12 months to September 2017 by RTO Queenstown RTO Wanaka RTO QLDC Total Entire houses/units 70% 74% 71% All listing types 67% 73% 69% Seasonality This domain investigates the seasonality of Airbnb demand across several indicators. The purpose of this domain is to provide evidence as to whether Airbnb is predominantly plugging in gaps at peak times or if Airbnb is nibbling at commercial accommodation year-round. Stay unit nights by month This indicator shows stay unit nights on a month-by-month basis so that seasonal trends can be explored. Stay unit nights were at their highest in Queenstown in January with July not far behind. Wanaka hit a peak in August but it is not clear if this was driven by seasonality or the underlying growth in the popularity of Airbnb.
34 31 Figure 10: Monthly stay unit nights in Queenstown and Wanaka RTOs Monthly stay unit nights Queenstown vs Wanaka RTOs 35,000 30,000 Wanaka RTO Queenstown RTO 25,000 20,000 15,000 10,000 5,000 0 Oct-16 Nov-16 Dec-16 Jan-17 Feb-17 Mar-17 Apr-17 May-17 Jun-17 Jul-17 Aug-17 Sep-17 Guest nights by month This indicator shows the estimate of guest nights on a month-by-month basis so that seasonal trends can be explored. Guest nights data shows a similar trend to stay unit nights with Queenstown peaking in January followed by a second peak in July. Wanaka peaks in August. Figure 11: Monthly guest nights in Queenstown and Wanaka RTOs Monthly guest nights Queenstown vs Wanaka RTOs 70,000 60,000 50,000 Queenstown RTO Wanaka RTO 40,000 30,000 20,000 10,000 0 Oct-16 Nov-16 Dec-16 Jan-17 Feb-17 Mar-17 Apr-17 May-17 Jun-17 Jul-17 Aug-17 Sep-17 Occupancy rate by month This indicator shows the proportion of each month that Airbnbs have been booked. By looking at occupancy on a month-by-month basis seasonal trends can be established. Occupancies peaked in both Queenstown and Wanaka in January. Occupancies picked up from a low in May to a winter peak in July and August. However, winter occupancy peaks are substantially lower than the summer peaks. Wanaka experienced lower occupancies than Queenstown over the entire period except August 2017.
35 32 Figure 12: Month-by-month occupancy rate in Queenstown and Wanaka RTOs Monthly occupancy rate Queenstown vs Wanaka RTOs 60% 50% 40% Queenstown RTO Wanaka RTO 30% 20% 10% 0% Oct-16 Nov-16 Dec-16 Jan-17 Feb-17 Mar-17 Apr-17 May-17 Jun-17 Jul-17 Aug-17 Sep-17 Earnings This domain provides insights into how much money is flowing in to the local economy and into each property owner s back pocket as a result of Airbnb. It also provides insights into the average price that Airbnb guests are paying each night. Table 22: Earnings from Airbnb by RTO in the 12 months to September 2017 Queenstown RTO Wanaka RTO QLDC total Total earnings $60,453,684 $14,014,467 $74,468,151 Average earnings $23,539 $14,922 $21,265 Average daily rate per room $115 $90 $111 Total earnings of all properties This indicator represents the total cash injection in to the local economy from Airbnb earnings. It is defined as the total revenue earned by all properties in the area over a given time period (including cleaning fees). Total earnings in Queenstown were more than $60m in the 12 months to September 2017, compared with around $14m in Wanaka. Figure 13 shows summer and winter peaks in earnings. Earnings in the May trough are about a quarter of the summer and winter peaks. Total earnings in the winter peak exceeded the summer peak in Queenstown.
36 33 Figure 13: Total monthly earnings from Airbnb listings in Queenstown and Wanaka RTOs Airbnb total earnings Wanaka RTO vs Queenstown RTO $9,000,000 $8,000,000 $7,000,000 Queenstown RTO Wanaka RTO $6,000,000 $5,000,000 $4,000,000 $3,000,000 $2,000,000 $1,000,000 $0 Oct-16 Nov-16 Dec-16 Jan-17 Feb-17 Mar-17 Apr-17 May-17 Jun-17 Jul-17 Aug-17 Sep-17 Average earnings for each property The average earnings of each property are estimated by dividing total revenue in an area by the number of properties available for rent on Airbnb over a given time period. This indicator represents the return which each property owner is earning on average from listing their property on Airbnb. On average, an Airbnb listing in Queenstown earned almost $24,000 in the 12 months to September 2017, while the average was about $15,000 in Wanaka. Figure 14 shows that the average monthly earnings from Airbnb property in Queenstown were substantially higher than Wanaka, although the gap shrinks in May and August. Average earnings are highest in summer. Figure 14. Average monthly earnings per property in Queenstown and Wanaka RTOs Airbnb average earnings per property Wanaka RTO vs Queenstown RTO $3,500 $3,000 $2,500 $2,000 $1,500 $1,000 $500 Queenstown RTO Wanaka RTO (RHS) $0 Oct-16 Nov-16 Dec-16 Jan-17 Feb-17 Mar-17 Apr-17 May-17 Jun-17 Jul-17 Aug-17 Sep-17 Average daily rate ($) per effective room This indicator represents how much it costs on average to rent a room with Airbnb. It is calculated per effective room so that fair comparisons can be made across areas, even if there are a different composition of property types.
37 34 Each listing s price (including cleaning fees) is converted into an effective room rate by taking in to consideration the number of bedrooms in the listing and then averaged across all listings. The average daily rate per effective room in Airbnbs in Queenstown was $115 and $90 in Wanaka over the 12 months to September Figure 15 shows that there are clear summer and winter peaks in the average daily rate. Figure 15: The daily effective Airbnb room rate, month-by-month in Queenstown and Wanaka RTOs Daily effective room rate Wanaka RTO vs Queenstown RTO $140 $120 $100 Queenstown RTO Wanaka RTO $80 $60 $40 $20 $0 Oct-16 Nov-16 Dec-16 Jan-17 Feb-17 Mar-17 Apr-17 May-17 Jun-17 Jul-17 Aug-17 Sep-17 Quality This domain provides insights into the quality of Airbnb properties within Queenstown-Lakes District by comparing ratings within the district and against other parts of New Zealand. Average property rating by Airbnb guests This indicator signals how content Airbnb guests have been with the quality of their accommodation and the experience received by giving the average rating out of 5 by guests for properties in the area. With average ratings of 4.8 in both Queenstown and Wanaka Airbnb customers appear to be slightly happier than customers in Auckland and New Zealand as a whole (both 4.7). Table 23: Average Airbnb property ratings by RTO, 12 months to September 2017 Area Rating Queenstown RTO 4.8 Wanaka RTO 4.8 Auckland 4.7 New Zealand 4.7
38 35 6. COMPARISONS OF ALL ZONES IN THE DISTRICT This section looks at Airbnb data disaggregated by Queenstown-Lakes District zones to understand the scale and nature of Airbnb within each of Queenstown- Lakes District s zones. Analysis covers the same five domains used in earlier sections. We begin this section by summarising the nature of Airbnb across all zones. We then investigate each indicator individually to show how it looks in each zone. A data spreadsheet for all zones across all indicators accompanies this report to enable detailed zone by zone analysis. Infometrics assigned Airbnb properties to zones based on GPS co-ordinates sourced from Airbnb and zone boundary data from Queenstown-Lakes District Council. GPS co-ordinates for Airbnb listings are only an approximation of the property s true location (to ensure the host s protection). There is therefore a small possibility that some listings that fall very close to the boundary of two zones can be allocated to the wrong zone. For example, it is possible that a property assigned to the High Density Residential Zone is actually located a few metres away in the Low Density Residential Zone. It is our view that this problem does not get in the way of a generalised understanding of each zone. However, zones which are very small or have very few listings are more likely to be prone to error. Before considering the nature of Airbnb in each zone in Queenstown-Lakes District, it is useful to consider the district-wide findings made in Section 3 of this report. At a headline level in Queenstown-Lakes District, we established that: Most listings (68% or 2,884 houses) in Queenstown-Lakes are entire houses/units, rather than just spare private rooms (31%). Nationally these proportions are 50% and 48% respectively. Houses/units listed on Airbnb in Queenstown-Lakes are generally 3+ bedroom family homes. In September 2017, 59% or 1,699 whole house listings in Queenstown-Lakes are 3+ bedroom homes, compared to 42% nationally. Over the 12 months to September, Queenstown-Lakes hosts made their whole house listings available 70% of the time. Such a high proportion of availability suggests that in the absence of the option of getting superior returns on Airbnb many of the properties might have been in the general rental pool. The number of whole houses available on Airbnb was equivalent to 14% of Queenstown-Lakes District s housing stock in the September 2017 quarter. This proportion was the highest in the country and well above the national average of 1.2%. Summary across all zones There is considerable variation between the Queenstown-Lakes District Council zones. The zones widely differ in size and location, with a number of different zones present within each suburb or geographic area. The zones also differ according to the purpose they serve, such as to limit the development of dense dwelling types, or to describe a particular area. For example, some zones are largely residential, while others describe rural communities or townships.
39 36 Key findings from analysing these zones where Airbnb is most prevalent are: The 10 zones with the most Airbnb listings are: Low Density Residential (49%), High Density Residential (11%), Township (Operative) (5%), Medium Density Residential (4.9%), Rural Lifestyle (4.6%), Special Zone Shotover Country (4.5%), Large Lot Residential (3.2%), Rural Residential (2.8%), Special Zone Resort (2.7%), and Rural (2.2%). Airbnbs in Large Lot Residential zones (78%) and High (75%) and Medium (73%) Density Residential zones are most likely to be for whole houses rather than private room listings. By comparison, approximately half of listings in Shotover Country are for private rooms. The data shows that in September 64% of listings in the Low Density Residential Zone were for houses/apartments with 3 or more bedrooms. Just over half of whole houses/units in High Density Residential zones are listed with three or more bedrooms - this is high given that many properties in this area are likely to be townhouses or apartments. Zones where there are a high proportion of 1 bedroom units include Rural (34%) and Large Lot Residential (31%) Despite some variability between zones, the overarching observation is that most whole houses/units listed on Airbnb are available the majority of the time, irrespective of which zone it is located in. The following table (Table 24), gives a summary of indicators for five zones with the highest number of listings. Table 24: Summary of indicators by the five zones with the highest number of listings Data is for September 2017 unless otherwise stated Medium Density Residential Special Zone - Shotover Country Low Density High Density Township Residential Residential (Operative) Number of listings 2, Stay unit nights 13,318 3,884 1,530 1,069 1,217 Total over year to September ,371 47,988 19,287 14,717 13,553 Guest nights 25,041 7,303 2,877 2,010 2,288 Total over year to September ,275 88,240 35,499 27,094 24,847 Average stay length Average over year to September Occupancy 25% 31% 28% 20% 26% Average over year to September % 39% 35% 28% 31% Type of listings (% of total) Whole house/unit 68% 75% 73% 63% 65% Private room 31% 24% 27% 37% 48% Shared room 1% 1% 0.0% 1.0% 0.5% Bedrooms in whole house listings (% of total) 1 bedroom 13% 11% 0% 0% 18% 2 bedrooms 20% 29% 27% 14% 12% 3 bedrooms 36% 37% 41% 35% 27% 4+ bedrooms 28% 16% 22% 20% 17% Total earnings 12 months to September 2017 $37,536,987 $12,945,043 $4,847,572 $1,943,959 $1,739,930 Average daily room rate 12 months to Sep $107 $133 $112 $79 $81 Quality A detailed account of each domain and indicator is provided in the rest of this section.
40 37 Sector size This domain helps establish a baseline understanding of the underlying size of Airbnb, average stay lengths by guests, and the occupancy rates of Airbnb. Capacity The total number of properties listed on Airbnb in Queenstown-Lakes District is broken down to show number of listings in the Queenstown-Lakes District Council zones at a point in time. Close to 70% of all Airbnb listings on average per month in the year to September 2017 were within the Low, Medium, High-Density Residential Zones and the Township (Operative) Zone in Queenstown-Lakes District. Almost half of the average 3,521 listings were in the Low Density Residential Zone. A further 11% were in the High Density Residential Zone, and approximately 5% in were in each of the Medium Density Residential Zone and the Township (Operative) Zone. A further 4.6% of listings were in the Rural Lifestyle Zone. Table 25: Airbnb listings by zone The number of Airbnb listings on average per month* Zones % of total Total Low Density Residential 49% 1,738 High Density Residential 11% 382 Township (Operative) 5.0% 175 Medium Density Residential 4.9% 173 Rural Lifestyle 4.6% 160 Special Zone - Shotover Country 4.5% 157 Large Lot Residential 3.2% 114 Rural Residential 2.8% 99 Special Zone - Resort 2.7% 95 Rural 2.2% 78 High Density Residential (Operative) 1.6% 58 Special Zone - Quail Rise 1.4% 48 Rural Visitor 1.2% 41 Arrowtown Residential Historic Management Zone 1.0% 36 Gibbston Character Zone 0.8% 27 Town Centre Queenstown 0.7% 25 Special Zone - Remarkables Park 0.6% 21 Penrith park 0.5% 16 Special Zone - Meadow Park 0.3% 11 Special Zone - Mount Cardrona Station 0.3% 10 Open Space (Operative) 0.2% 7 Town Centre Wanaka 0.2% 6 Business Mixed Use 0.2% 6 Special Zone - Bendemeer 0.1% 4 Other 1.0% 34 Queenstown-Lakes District Total 3,521
41 38 Between October 2016 (our earliest month of data), and September 2017, there has been significant growth in the number of Airbnb listings across Queenstown-Lakes District. This growth is particularly strong in the residential areas (see Table 26). Table 26: October 2016 to September 2017 growth in Airbnb listings in Queenstown-Lakes District zones The number of listings on Airbnb Zones Oct-16 Sep-17 % change Low Density Residential 1,260 2,115 68% High Density Residential % Medium Density Residential % Township (Operative) % Special Zone - Shotover Country % Rural Lifestyle % Large Lot Residential % Rural Residential % Special Zone - Resort % Rural % High Density Residential (Operative) % Special Zone - Quail Rise % Rural Visitor % Arrowtown Residential Historic Management Zone % Town Centre Queenstown % Gibbston Character Zone % Special Zone - Remarkables Park % Penrith park % Special Zone - Meadow Park % Special Zone - Mount Cardrona Station % Open Space (Operative) % Town Centre Wanaka % Business Mixed Use % Special Zone - Bendemeer 4 4 0% Other % Queenstown-Lakes District Total 2,558 4,226 65% In the 12 months to September, the number of listings in the Low Density Residential Zone increased by 68%. The number of Airbnb listings over the same period in the Medium Density and High Density zones were both up by 55%. This compared to an average 65% across Queenstown-Lakes District. Please note that only the 10 zones with the largest number of Airbnb listings have been individually singled out in the remainder of the report, with other zones lumped in to an other category. Most zones in the other category each represent less than 1% of Airbnb listings in the district. A full data set has been provided in an accompanying spreadsheet so that QLDC can at its own discretion further investigate zones where Airbnb prevalence is lower.
42 39 Stay unit nights Stay unit nights is the number of nights that Airbnb s have been booked in the area. Stay unit nights reflects how often hosts choose to list their property, along with demand for Airbnbs. There were 340,809 stay unit nights in Queenstown-Lakes District over the year to September Of these, 170,432 (50%) were in the Low Density Residential Zone. Over the same period, the number of stay nights in the High and Medium Density Residential Zones was 48,003 (14%) and 19,287 (5.7%) respectively. Table 27: Stay unit nights by zone over the 12 months to September 2017 Zones Stay nights % of Total Low Density Residential 170,432 50% High Density Residential 48,003 14% Medium Density Residential 19, % Township (Operative) 14, % Rural Lifestyle 13, % Rural 6, % Special Zone - Shotover Country 13, % Large Lot Residential 9, % Rural Residential 7, % Special Zone - Resort 6, % Other 31, % Queenstown-Lakes District 340,809 Guest nights Guest nights are the number of guests that stay in Airbnb over a given period of time. The number of guests per property is unknown, and has been estimated by assuming that guests per property are the same as guests per stay unit in commercial accommodation. This estimate is likely to be conservative as guests per Airbnb may exceed their commercial accommodation equivalent when there are a lot of whole houses available for rent on Airbnb in an area. Our estimates show that of the 626,714 guest nights in Queenstown-Lakes District over the 12 months to September 2017, half were in the Low Density Residential Zone.
43 40 Table 28: Guest nights by zone in the 12 months to September 2017 Zones Guest nights % of Total Low Density Residential 313,275 50% High Density Residential 88,240 14% Medium Density Residential 35, % Township (Operative) 27, % Rural Lifestyle 24, % Rural 10, % Special Zone - Shotover Country 24, % Large Lot Residential 17, % Rural Residential 14, % Special Zone - Resort 11, % Other 59, % Queenstown-Lakes District 626,714 Average stay length This indicator shows the average number of days that guests are staying in Airbnb accommodation in the area. A longer average length of stay per guest means there is more opportunities for guests to spend on other services when in the area. Guests stayed for an average of 4.2 days in Airbnbs in Queenstown-Lakes District over the 12 months to September At an average length of 4.7 and 4.6 days respectively, Special Zone Resort and Rural Residential had the longest stays. This contrasts with the Rural Zone, with guests staying for an average of only 3.5 nights over the 12-month period. Table 29: Average length of stay by zone over the 12 months to September 2017 (days) Average stay Zones length Low Density Residential 4.3 High Density Residential 4.1 Medium Density Residential 4.2 Township (Operative) 3.7 Rural Lifestyle 4.2 Rural 3.5 Special Zone - Shotover Coun 4.2 Large Lot Residential 4.3 Rural Residential 4.6 Special Zone - Resort 4.7 Other 4.2 Queenstown District Council 4.2 New Zealand 3.9

44 41 Occupancy This indicator looks at number of days that a listing was booked as a proportion of total time (12 months to September 2017). Across all zones, the average occupancy rate over the 12 months to September was low compared to its commercial equivalent. This is because the calculation includes both the time that the listing was made available as well as when the property was unable to be booked. The High Density Residential Zone had an occupancy rate of 39% over the 12 months to September 2017, ahead of Medium and Low Density Residential. Table 30: Average occupancy rate by zone in the 12 months to September 2017 Housing/rental pressures We now seek to understand these housing/rental pressures from Airbnb in Queenstown-Lakes on a zone-by-zone basis. The key focus of the housing/rental pressures domain is understanding the characteristics of homes being rented out via Airbnb and how regularly hosts are trying to rent their properties out on the platform. These insights show which zones have high concentrations of homes listed on Airbnb that would have been suitable for families to live in long-term. They will also show whether these homes are being opportunistically rented at peak times, or are likely to have been removed from the general rental pool to chase higher returns on Airbnb. Key findings from analysing these zones were Airbnb is most prevalent are: Airbnbs in Large Lot Residential zones (78%) and High (75%) and Medium (73%) Density Residential zones are most likely to be for whole houses rather than private room listings. By comparison, approximately half of listings in Shotover Country are for private rooms. The data shows that in September 64% of listings in the Low Density Residential Zone were for houses/apartments with 3 or more bedrooms. Just over half of whole houses/units in High Density Residential zones are
45 42 listed with three or more bedrooms - this is high given that many properties in this area are likely to be townhouses or apartments. Zones where there are a high proportion of 1 bedroom units include Rural (34%) and Large Lot Residential (31%). Despite some variability between zones, the overarching observation is that most whole houses/units listed on Airbnb are available the majority of the time, irrespective of which zone it is located in. Type of listings This indicator breaks the total number of properties listed on Airbnb down by type: shared room, private room, and whole house. This data can help establish whether a listing is just a family renting a spare room or if it is an entire residential unit/home. In September, 78% of properties in the Large Lot Residential Zone were listed on Airbnb as entire houses or units. Similar high proportions of whole house/unit Airbnb listings were also seen in the High Density Residential zone and the Medium Density Residential Zone at 75% and 73%, respectively. This compares to an average across Queenstown-Lakes District of 68%, and just 50% nationally. This high proportion of whole house/unit listings in these residential zones suggests that a lot of Airbnbs in these areas are suitable for rentals, rather than hosts earning a little bit of extra money from spare rooms. In contrast, zones such as Shotover Country are much more focussed on private rooms for rent, with almost half of all Airbnb listings private rooms. In other words, half of listings in Shotover Country appear to be people earning a return from a spare room, rather than renting out their whole house/unit. Table 31: Listings by type and by 10 largest Queenstown-Lakes District Council zones in September 2017 (listing types expressed as % of total). Type of listing Zones Entire home/apt Private room Shared room Total Low Density Residential 68% 31% 0.5% 2,113 High Density Residential 75% 24% 0.7% 454 Medium Density Residential 73% 27% 0.0% 205 Township (Operative) 62% 37% 1.0% 202 Rural Lifestyle 69% 29% 1.1% 183 Rural 63% 34% 0.0% 98 Special Zone - Shotover Country 51% 48% 0.5% 194 Large Lot Residential 78% 22% 0.0% 135 Rural Residential 69% 30% 0.9% 116 Special Zone - Resort 64% 34% 0.0% 117 Other 69% 32% 3.9% 409 Queenstown District Council 68% 31% 1% 4,226 New Zealand 50% 48% 1% 45,926 Total shares may not add to 100%, due to properties missing information on listing type (<1%). Total includes all properties. Having established the key zones that have a large number of whole house/unit listings on Airbnb, we will now look at the nature of these houses/units to see if
46 43 they are 3 or 4 bedroom family homes, or if they are small units for singles or couples. Number of bedrooms in whole house listings This indicator takes the number of whole house listings and breaks these in to bedroom numbers (1, 2, 3, 4+). This indicator can help establish what type of whole houses are being rented to understand whether they are small units, or homes suitable for accommodating families. Across the district, 59% of whole house/unit Airbnb listings in September 2017 were for 3+ bedroom homes. This compares to only 42% nationally. Considering things on a zone-by-zone basis shows where whole house listings tend to be larger or smaller than the average across Queenstown-Lakes District. In September 2017, 64% of listings in the Low Density Residential Zone were for houses/apartments with 3 or more bedrooms. Just over half of whole houses/units in High Density Residential zones are listed with three or more bedrooms. This is high given that many properties listed on Airbnb that are located within High Density Residential zoned areas are likely to be townhouses or apartments. Zones where there are a high proportion of 1 bedroom units include Rural (34%) and Large Lot Residential (31%). Table 32: Entire house/unit Airbnb listings by number of bedrooms and largest Queenstown-Lakes District Council zones September 2017 (number of bedrooms expressed as % of total). Number of bedrooms Zones Total Low Density Residential 17% 20% 36% 28% 1,447 High Density Residential 18% 29% 37% 16% 342 Medium Density Residential 9% 27% 41% 22% 150 Township (Operative) 30% 14% 35% 20% 125 Rural Lifestyle 30% 20% 20% 30% 128 Rural 34% 22% 16% 28% 64 Special Zone - Shotover Country 29% 15% 34% 21% 99 Large Lot Residential 31% 22% 20% 27% 105 Rural Residential 24% 18% 21% 38% 80 Special Zone - Resort 12% 11% 49% 29% 76 Other 23% 29% 28% 21% 268 Queenstown-Lakes District 20% 21% 34% 25% 2,884 New Zealand 31% 27% 25% 17% 23,890 Total shares may not add to 100%, due to properties missing information on listing type (<1%). Total includes all properties This high proportion of 3+ bedroom homes available on the platform indicates that there are significant numbers of homes being listed on Airbnb that would have been suitable for a family to rent. The big question now is whether hosts in each zone are only opportunistically renting out their home on occasions or if there is evidence that houses are being taken out of the general rental pool to list on Airbnb.
47 44 Proportion of time Airbnb is available to book This indicator shows the average number of days over a time period that hosts have made their property available to rent on Airbnb. By understanding how frequently hosts are willing to rent out their property, we can ascertain whether it is reasonable to assume that in the absence of Airbnb, the home/unit could have potentially been added to the general rental pool. The data shows that entire home/unit listings in Queenstown-Lakes District were on average available for rent on 70% of the time over the 12 months to September By comparison, at a national level, whole home/unit listings on Airbnb were available to rent on average 68% of the time over the year to September Considering things on a zone-by-zone basis shows areas where hosts are making their properties available on Airbnb more or less of the time than the district average. Despite some variability between zones, the overarching observation is that most whole houses/units listed on Airbnb are available the majority of the time, irrespective of which zone it is located in. Table 33: Proportion of time that Airbnb properties have been available by zone over the 12 months to September (Whole house/units only). Whole house/unit Zone % of 12 months Low Density Residential 70% High Density Residential 84% Medium Density Residential 77% Township (Operative) 67% Rural Lifestyle 72% Rural 75% Special Zone - Shotover Country 46% Large Lot Residential 76% Rural Residential 61% Special Zone - Resort 52% Queenstown-Lakes District 70% New Zealand 68% Seasonality This domain investigates the seasonality of Airbnb demand across several indicators broken down into zones. The purpose of this domain is to provide evidence as to whether Airbnb is predominantly plugging in gaps at peak times or if Airbnb is nibbling at commercial accommodation year-round. Stay unit nights by month This indicator shows the total number of nights each month that Airbnbs have been booked in the area broken done by month. Stay unit nights across Queenstown-Lakes District Council zones generally had peaks in January and again in winter (July or August).
48 45 Figure 16: Monthly stay unit nights by five largest zones Monthly stay nights QLDC five largest zones 7,000 6,000 5,000 4,000 3,000 2,000 1,000 High Density Residential Medium Density Residential Township (Operative) Low Denisty Residential (RHS) 25,000 20,000 15,000 10,000 5,000 0 Oct-16 Nov-16 Dec-16 Jan-17 Feb-17 Mar-17 Apr-17 May-17 Jun-17 Jul-17 Aug-17 Sep-17 0 The highest month for unit stay nights for listings High Density Residential zones was in July. This was also the case for stay unit nights in Medium Density Residential zones. In part, the high number of unit stay nights during July and August reflects the growing number of listings, but is also likely due to strong demand for areas close to the main centres and to ski fields throughout the winter peak season. Guest nights by month This indicator looks at the estimate of guest nights from the sector size section on a monthly basis. Guest nights have experienced the same seasonal patterns as stay unit nights. Figure 187 shows clear peaks in January and July for properties in residential zones. Figure 17: Monthly guest nights in residential zones and Queenstown-Lakes District Queenstown RTO guest nights Airbnb vs commercial accomodation 14,000 12,000 10,000 8,000 6,000 4,000 2,000 High Density Residential Medium Density Residential Township (Operative) Low Density Residential (RHS) Oct-16 Nov-16 Dec-16 Jan-17 Feb-17 Mar-17 Apr-17 May-17 Jun-17 Jul-17 Aug-17 Sep Occupancy rate by month This indicator shows the proportion of each month that Airbnbs have been booked. The calculation includes properties which have not been made available to book (for example the host has chosen to block out dates to stay for the Christmas
49 46 holidays). By looking at occupancy on a month-by-month basis seasonal trends can be established. January was unsurprisingly the strongest month for occupancy. Of the four zones with the highest number of listings on average per month, the Medium Density Residential Zone had the highest occupancy rate in January, at almost 60%. This is considerable given properties were, on average, available to book only 75% of the time in January. Figure 18: Month-by-month Airbnb occupancy rate for the five largest zones Monthly occupancy rate QLDC zones 60% 50% 40% Low Density Residential High Density Residential Medium Density Residential Township (Operative) Queenstown-Lakes District 30% 20% 10% 0% Oct-16 Nov-16 Dec-16 Jan-17 Feb-17 Mar-17 Apr-17 May-17 Jun-17 Jul-17 Aug-17 Sep-17 Earnings This domain provides insights into how much money is flowing in to the local economy and into each property owner s back pocket as a result of Airbnb. It also provides insights into the average price that Airbnb guests are paying each night. Total earnings of all properties This indicator represents the total cash injection in to the local economy from Airbnb earnings. It is defined as the total revenue earned by all properties in the area over a given time period (including cleaning fees). Of the $74.5m of total revenue generated for hosts over the 12 months to September 2017, $37.5m was made by properties in the Low Density Residential Zone. This compares to $12.9 in the High Density Residential Zone, and $4.8m in the Medium Density Zone. Properties in the Rural Lifestyle Zone also bring in a significant amount of money into the district, totalling $4.8m in the 12 months to September 2017.
50 47 Table 34: Total earnings from Airbnb by zone in the 12 months to September 2017 Zones Total earnings Low Density Residential $37,536,987 High Density Residential $12,945,043 Medium Density Residential $4,847,572 Township (Operative) $1,943,959 Rural Lifestyle $3,245,289 Rural $1,078,818 Special Zone - Shotover Country $1,740,199 Large Lot Residential $1,913,313 Rural Residential $1,656,963 Special Zone - Resort $1,460,511 Other $6,099,496 Queenstown District Council $74,468,151 New Zealand $315,254,292 Average earnings for each property The average earnings of each property are estimated by dividing total revenue in an area by the number of properties available for rent on Airbnb over a given time period. This indicator represents the return which each property owner is earning on average from listing their property on Airbnb. The highest average earnings per property over the 12 months to September 2017 was for properties in the High Density Residential Zone, at $33,909. This compares to the Queenstown-Lakes District average of $21,265. Properties in rurally zoned areas earned comparatively less. Lower earnings per property over the period is likely due to below average occupancy rates, along with cheaper listing prices. Table 35: Total earnings per Airbnb property by zone in the year to September 2017 (all property types) Zones Earnings per property Low Density Residential $21,743 High Density Residential $33,909 Medium Density Residential $28,161 Township (Operative) $11,344 Rural Lifestyle $20,482 Rural $14,284 Special Zone - Shotover Country $11,029 Large Lot Residential $16,744 Rural Residential $16,861 Special Zone - Resort $15,768 Other $17,447 Queenstown District Council $21,265 New Zealand $8,707
51 48 Properties listed as whole houses can give us a better understanding of how the return per property for hosts compares with those who choose to lease their house on the private rental market. In the year to September 2017, hosts in Queenstown-Lakes earned on average $25,254 per entire house/unit, compared to $12,426 nationally. Those in High and Medium Density Residential zones made $42,308 and $36,788 respectively. Table 36: Total earnings per Airbnb property by zone in the 12 months to September 2017 for (whole house/units) Whole houses/units Zones Earnings per property Low Density Residential $28,067 High Density Residential $42,308 Medium Density Residential $36,788 Township (Operative) $14,236 Rural Lifestyle $24,845 Rural $16,995 Special Zone - Shotover Country $14,930 Large Lot Residential $19,404 Rural Residential $20,975 Special Zone - Resort $19,306 Other $21,278 Queenstown District Council $25,254 New Zealand $12,426 Looking at earnings for the zones with the largest number of listings across time shows that those in the High Density Residential Zone recorded average earnings of $5,330 in January and $5,625 during July. Over the 12 months to September 2017, hosts with properties in this zone earned on average $42,308 each. Figure 19: Average Airbnb monthly earnings per property for whole houses/units Average monthly earnings for whole houses/units QLDC zones $6,000 $5,000 $4,000 $3,000 $2,000 $1,000 Low Density Residential High Density Residential Medium Density Residential Township (Operative) Rural Lifestyle $0 Oct-16 Nov-16 Dec-16 Jan-17 Feb-17 Mar-17 Apr-17 May-17 Jun-17 Jul-17 Aug-17 Sep-17
52 49 Average daily rate ($) per effective room This indicator represents how much it costs on average to rent a room with Airbnb. It is calculated as per effective room so that fair comparisons can be made across areas, even if there are a different composition of property types. Each listing s price (including cleaning fees) is converted into an effective room rate by taking in to consideration the number of bedrooms in the listing and then averaged across all listings. The average daily rate per effective room for properties located in the Low Density Residential Zone was $106, roughly in line with the Queenstown-Lakes District average. For high density residential zoned properties, the average effective room rate was $131 per night. Properties in the Town Centre Queenstown Zone recorded the highest effective room rate of $ This compares with an average of just $74 nationwide. Table 37: Daily effective room rate by zone, average over 12 months to September 2017 Average effective Zones room rate Low Density Residential $106 High Density Residential $131 Medium Density Residential $107 Township (Operative) $78 Rural Lifestyle $131 Rural $105 Special Zone - Shotover Country $81 Large Lot Residential $110 Rural Residential $115 Special Zone - Resort $115 Other $113 Queenstown District Council $111 New Zealand $74 Quality This domain provides insights into the quality of Airbnb properties within Queenstown-Lakes District zones by looking at user ratings. Average property rating by Airbnb guests This indicator signals how content Airbnb guests have been with the quality of their accommodation and the experience received by giving the average rating out of 5 by guests for properties in the area. Most zones in Queenstown-Lakes district were rated at or above the New Zealand average. Areas with more than 10 listings a month with particularly high ratings were the Resort Zone, and the Rural Lifestyle Zone (each with an average score over the 12 months to September 2017 of 4.9). 3 The Town Centre Queenstown Zone had relatively few Airbnb listings per month over the 12 months to September Data can be found in the accompanying data tables.
53 50 Table 38: Average Airbnb property ratings by zone, average over year to September 2017 Zones Low Density Residential Rating 4.8 High Density Residential 4.8 Medium Density Residential 4.8 Township (Operative) 4.8 Rural Lifestyle 4.9 Rural 4.8 Special Zone - Shotover Country 4.9 Large Lot Residential 4.8 Rural Residential 4.8 Special Zone - Resort 4.9 Other 4.8 Queenstown District Council 4.8 New Zealand 4.7
54 51 7. OTHER PRIVATE ACCOMMODATION PROVIDERS Although Infometrics has detailed information about the Airbnb characteristics, very limited information is available about the characteristics of accommodation listed by other private accommodation providers, namely Bookabach and Holiday Houses. A further limitation is that information can only be gathered at a point in time as we do not have access to a time series data set. Table 39 shows that as at the 29 th of September 2017, there were 1,193 listings on Bookabach and 1,044 on Holiday Houses in the Queenstown-Lakes District. Table 39: Bookabach and Holiday Houses listing numbers on September Queentown Wanaka Queenstown- Lakes District Book abach ,193 Holiday Houses ,044 It should be noted that the above numbers are based on Bookabach s town boundaries of Queenstown and Wanaka and these are not consistent with the RTO boundaries. For this reason, the sum of Queenstown and Wanaka does not equal the Queenstown-Lakes District total. There is duplication between Bookabach, Holiday Houses, and Airbnb. This means the total units available in the Queenstown-Lakes District is not the 6,434 units (4,106 Airbnbs plus 1,193 Bookabach and 1,044 Holiday Houses). Infometrics used a random small sample of Bookabach, Holiday Houses and Airbnb listings to gauge the level of duplication across the three platforms. We found that there was a large amount of duplication between whole house listings on the Bookabach and Holiday Houses sites. Duplication between Airbnb and the two other platforms was less pronounced. As a result of this small test, we estimate that there are currently around 5,000 unique listings in the Queenstown-Lakes District. In lieu of more detailed data for listings on Bookabach and Holiday Houses, further analysis is limited. Nevertheless, Airbnb is twice the size of the other two main private accommodation providers in the area and is on a rapid growth trajectory. Infometrics believes that the analysis of Airbnb data gives a broad understanding about the scale of the sector, and very importantly for this analysis, a wellcategorised database of the characteristics of each property. Airbnb data is also more likely to represent trends in international visitor arrivals, as Airbnb is widely used in the international market and is a framework foreign guests are comfortable using.


55 52 8. ADDITIONAL AIRBNB HEATMAPS Lake Hayes Arrowtown

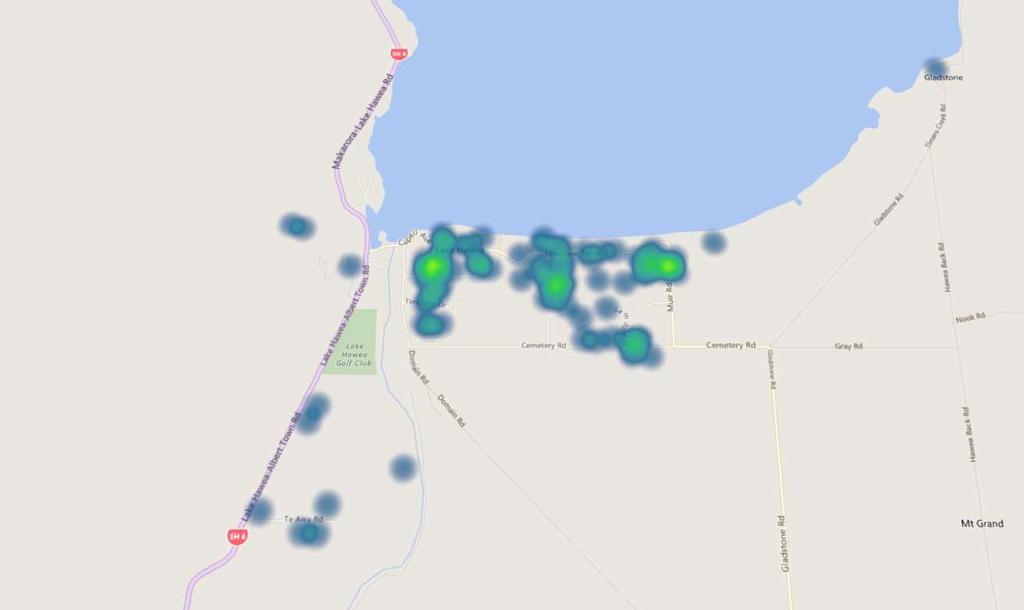
56 53 Glenorchy Hawea