Customer-based Corporate Valuation
|
|
|
- Dominic Goodman
- 5 years ago
- Views:
Transcription
1 Customer-based Corporate Valuation Professor Daniel McCarthy Professor Peter Fader ASA Seminar Series July 24, 2017
2 The sources of corporate valuation FIRM S TOTAL EQUITY OPERATING ASSETS (sales ops, brand, technology, distribution, production, HR, ) NON-OPERATING ASSETS (excess real estate, other investments) NET DEBT (cash and equivalents, debt, lease obligations) CUSTOMERS 2
3 The sources of corporate valuation FIRM S TOTAL EQUITY OPERATING ASSETS (sales ops, brand, technology, distribution, production, HR, ) NON-OPERATING ASSETS (excess real estate, other investments) NET DEBT (cash and equivalents, debt, lease obligations) CUSTOMERS 3
4 Customer-Based Corporate Valuation TWO KEY DIMENSIONS CONTRACTUAL VS. NON-CONTRACTUAL INTERNAL (GRANULAR) DATA VS. EXTERNAL (AGGREGATED) DATA 4
5 Contractual vs. Non-contractual TWO KEY DIMENSIONS Contractual: Observable attrition Telcos, insurance, club memberships, SaaS, etc. Relatively steady payments over lifetime Easy to model But less common than non-contractual CONTRACTUAL VS. NON- CONTRACTUAL INTERNAL DATA VS. EXTERNAL DATA 5
6 Contractual vs. Non-contractual TWO KEY DIMENSIONS Non-contractual: Latent attrition Retail, restaurants, gaming, travel, entertainment, healthcare/pharma, media usage, B2B distribution, Very random purchase timing and spend over lifetime Much harder to model Can t approximate it as contractual But suitable methods are now well-established CONTRACTUAL VS. NON- CONTRACTUAL INTERNAL DATA VS. EXTERNAL DATA 6
7 Internal vs. External Data TWO KEY DIMENSIONS Internal (granular) Customer-level transaction logs Can be augmented by other sources Marketing action, satisfaction, social media CONTRACTUAL VS. NON- CONTRACTUAL INTERNAL DATA VS. EXTERNAL DATA 7
8 Internal vs. External Data TWO KEY DIMENSIONS External (aggregated) Rolled up summaries Periodically disclosed First-party disclosures (10-K s, 10-Q s, investor presentations, etc.) CONTRACTUAL VS. NON- CONTRACTUAL INTERNAL DATA VS. EXTERNAL DATA Third-party disclosures (Slice Intelligence, 1010data, SecondMeasure, etc.) 8
9 Discounted Cash Flow Valuation Model INCOME STATEMENT/ BALANCE SHEET PROJECTIONS STOCK PRICE/ TREASURY RATE INFORMATION Benefits: 1. De-facto standard method (Koller/Goedhart/ Wessels 2010) CUSTOMER METRIC PROJECTIONS WTD. AVG. COST OF CAPITAL PROJECTIONS 2. Flexible (changes in debt / working capital / operating expenses) 3. General (values whole enterprise) 4. Naturally integrates customer metric projections!! Asset/CE-based analyses are nested. CUSTOMER ASSET VALUES FREE CASH FLOW PROJECTIONS OPERATING ASSET VALUE Shareholder Value = Operating Asset Value + Non-Operating Assets Net Debt NON-OPERATING ASSETS NET DEBT SHAREHOLDER VALUE 9
10 Case Study #1: DISH Network TWO KEY DIMENSIONS Contractual company External/aggregate data CONTRACTUAL VS. NON- CONTRACTUAL Compare to market valuation as well as Wall Street analyst revenue forecasts INTERNAL DATA VS. EXTERNAL DATA Paper available at 10
11 Dish Network Data 11
12 Valuing Contractual Firms: Customer Triangle Active Customers by Cohort Month Total Customers x ARPU = Revenue Jan Feb Mar Apr May Jun Attrition Acquisition Total Customers Spend Estimated off of quarterly marginal acquisition/loss data 12
13 13
,")
14 Valuation Results McCarthy, Fader, Hardie (2017), Valuing Subscription-Based Businesses Using Publicly Disclosed Customer Data, Journal of Marketing, 81(1),
15 Validation vs Wall Street Analyst Projections 3,454 quarterly sales predictions by analysts Predictions made 5/ /2014 Varying time horizons! How does our predictive accuracy compare? Example: Our forecasts are consistently 10-15% more accurate than those of the Wall Street analysts Analyst Prediction: $2,120M in Q3 05 Our Prediction: $1,988M in Q quarters ahead Actual Sales: $1,989M in Q3 05 5/5/2005: Q Results Reported 7/28/2005: Analyst Forecast Made 8/9/2005: Q Results Reported 11/8/2005: Q Results Reported
16 An update 16
17 An update 17

18 18 Name of Initiative


19 Case Study #2: Blue Apron June 1 st : Files S-1 for upcoming IPO Not disclosed: Any churn metrics! Disclosed: I fit the same model:

20 Model Validation 20
21 Model Insights Challenging retention: Rising CAC: 21


22 Media Reaction 22
: $10-11 Actual IPO Price (6/29): $10 Current Price (7/24): $7.")
23 Market Reaction Original IPO Range (6/19): $15-17 Revised IPO Range (6/28): $10-11 Actual IPO Price (6/29): $10 Current Price (7/24): $7.41 (-26%) 23
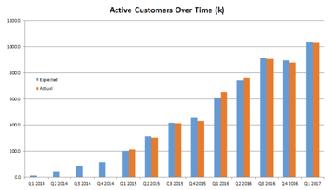
24 Case Study #3: E-Commerce Retailer TWO KEY DIMENSIONS Non-contractual company Analysis for a single geographic region External/aggregated data Acquisition models virtually identical to contractual case But how do we capture subsequent repeat purchasing and spend? Focus on choice of aggregated metrics CONTRACTUAL VS. NON- CONTRACTUAL INTERNAL DATA VS. EXTERNAL DATA Paper available at 24
25 Repeat Purchase Process Individual-Level Alive? No Yes For seasonality / macroeconomy No Buy Buy Fader et al 2010
26 Spend Process Expected spend per purchase for customers is lognormally distributed with drift: Time
27 Which Spend Metric Should Investors Want to See? Average spend per purchase we get for free from revenues, purchase process Median spend per purchase is excellent companion metric to average spend Communicable to non-technical audiences Natural measure of basket size Mean and median over time strongly identify the spend process 27
28 Which Purchase Metrics Should Investors Want to See? Consider six metrics (from SEC filings) that reflect repeat-purchase patterns: AU: Active users (# of customers who made > 0 purchases this year) HAU: Heavy active users (# who made > 1 purchases this year) RR: Repeat rate (% of last year s buyers who buy again this year) RBPO: Repeat buyer proportion-orders (% of this year s orders from customers who bought previously) RBPC: Repeat buyer proportion-customers (% of this year s buyers who bought who bought previously) F: Average frequency (average purchases among active users) 28
29 Illustration # of Transactions by Year and Customer Customer Y1 Y2 Y Gross adds AU HAU RR NA 100% 50% RBPO 0% 25% 75% RBPC 0% 50% 50% F 1 2 2
30 Customer Metrics in Practice Active Users Heavy Active Users Repeat Rate Repeat Buyer Proportion Frequency 30


31 Examples of Customer Metrics in Practice Amazon: Active Customers QVC: Repeat Rate Wayfair: Repeat Buyer Proportion 31
32 Which Purchase Metrics Should Investors Want to See? Consider six metrics (from SEC filings) that reflect repeat-purchase patterns: AU: Active users (# of customers who made > 0 purchases this year) HAU: Heavy active users (# who made > 1 purchases this year) RR: Repeat rate (% of last year s buyers who buy again this year) RBPO: Repeat buyer proportion (% of this year s orders from customers who bought before then) RBPC: Repeat buyer proportion (% of this quarter s buyers who bought who bought before then) F: Average frequency (average purchases among active users) How many metrics do investors need? Which metrics should investors demand?! We perform a large-scale simulation to answer these questions 32
33 Results: Average Error by Size (MAPE, count >20%) No further improvement after 2 good metrics

34 Results: Average Error (MAPE), All Pairs F in all 5 best collections
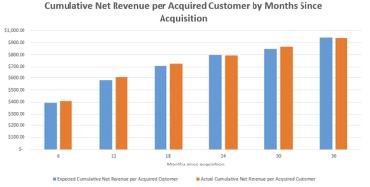
35 Valuation Example: E-commerce Retailer Consider a large business unit of an e-tailer: Commercial operations began July 1 st 2010 Track all purchases over subsequent 5.5 years For testing, split the 5.5 years (22 quarters) into two periods: Estimate model on quarters 1-18 ( calibration period ) Predict what will happen in quarters ( holdout period ) 35

36 Customer Data 36
37 Model Performance (1 of 6): Quarterly Additions 37
38 Model Performance (2 of 6): Tracking Quarter-by-Quarter Transactions 38
39 Model Performance (3 of 6): Tracking Cumulative Repeat Transactions 39
40 Model Performance (4 of 6): Calibration-Period Frequency Histogram 40
41 Model Performance (5 of 6): Conditional Expectations 41
42 Model Performance (6 of 6): Average Transaction Value Distribution 42
43 From model validation to corporate valuation
44 Projecting Revenues Customer additions: calibration period 44
45 Projecting Revenues Customer additions: calibration period and projections 45
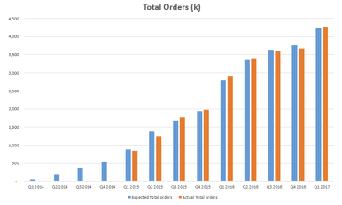
46 Projecting Revenues! Total number of purchases 46
47 Projecting Revenues! Total revenues 47
48 Valuation Results Assuming: Variable contribution ratio of 76.4% Customer acquisition cost of $76 per acquisition WACC of 6% Tax rate of 35% Clean balance sheet / no cash flow adjustments Date 1/7/2015 1/14/2015 1/21/2015 1/28/2015 FCF ($) $13,025 $13,822 $13,797 $13,772 WACC 6% Discount Factor PV(FCF) ($) $13,012 $13,794 $13,756 $13,717 NPV(FCF) =Shareholder Value $22,825,334 48
49 Other Customer Insights What else can we learn from this customer-based valuation model?
50 Value of New Users Insights into about-to-be-acquired customers: Expected Customer Lifetime Value (CLV): $
51 Value of New Users Insights into about-to-be-acquired customers: Expected Customer Lifetime Value (CLV): $76.2 Distribution of CLV: 51
52 Value of New Users Insights into about-to-be-acquired customers: Expected Customer Lifetime Value (CLV): $76.2 Distribution of CLV: 68% of new customers will be unprofitable 2.9% of new customers will generate 80% of all value 52

53 Existing Customers Versus New Customers Existing customers worth $3.1M, ~15% of total firm valuation Proportion of total sales from existing customers: In 3 years, < 25% of revenues from existing customers But the die-hards persist
54 Summary Customer data can improve company valuation estimates Contractual and non-contractual businesses require: Different models Different data We propose accurate models specifically suited to both business types We recommend the most informative customer data for NC firms (F and AU!) Coming up: two public company valuations 54
55 Daniel McCarthy Paper 1: Paper 2: