Macquarie Connections Australia Conference 1 May 2013 Mark Todd, CFO
|
|
|
- Richard Dennis
- 5 years ago
- Views:
Transcription


1 Macquarie Connections Australia Conference 1 May 2013 Mark Todd, CFO

 Growth Strategies Trading")
2 For personal use only Content Business Overview Kathmandu Re-Branding (Store development focus) Growth Strategies Trading Update Q&A

3 Kathmandu Business Overview


4 Business Overview Leading retailer of clothing and equipment for travel and adventure in Australia and New Zealand, founded 1987 Vertically integrated business from in-house design team to company-owned 130 store retail chain. Primarily designing/ sourcing/ selling technical product: Offshore long term manufacturing partners; 30% growth in SKU count since 2010; Apparel and Australian market development focus. Total sales split FY12 c.60/40 apparel/equipment. Substantial on-going investment in business growth Opened 10+ new stores per year since 2007; Distribution Centre s: 2012 New in Christchurch, expanded in Melbourne; Support Offices: c.150 staff spread Christchurch/Melbourne. Multiple effective & profitable store formats, aligned to market demographics and retail precinct options.
 NPAT c.$41.0m (FY10 $25.")
5 Growth since IPO, November 2009 Full Year FY09-FY12 Group Sales (NZ$m) $306.1 $245.8 $215.6 $347.1 Current Analysts consensus FY13* Sales c.$387m EBIT c. $63m (FY10 $47.9m) NPAT c.$41.0m (FY10 $25.2m) *(Bloomberg 24 April) FY09 FY10 FY11 FY12 1 st Half FY13
6 Growth in Market and Key Competitors, Australia/ NZ Kathmandu continues to grow market share through strategies focussed on: Store expansion and location optimisation; Brand positioning; Profitable range expansion; Customer loyalty and relationship management. Kathmandu +50 BCF +46 Anaconda +11 Ray s Outdoors +16 FCO (new 2012) +13 Mountain Designs +12 Paddy Pallin - 1 Macpac +21 Bivouac + 1 Snowgum - 6 Source: Kathmandu internal store count records. Competitors online store listings and any other relevant sources.
7 Product Development & Inventory Investment through FY11 and FY12 SKU count (current range per season) increased from c.3500 to Designers head count increase and Australian team established. Up weighting Australian design initiatives. Apparel focus, but also relevant equipment growth categories. Key outcomes from this programme Greater frequency & scope for seasonal range updating and new range development; Travel vs. Outdoor product offer re-balanced to meet / support associated wider product appeal in travel category; New company brand alignment incorporated and consistent across range; Platform now in place for appropriate future range development, product category and geographical variation opportunities recognised.


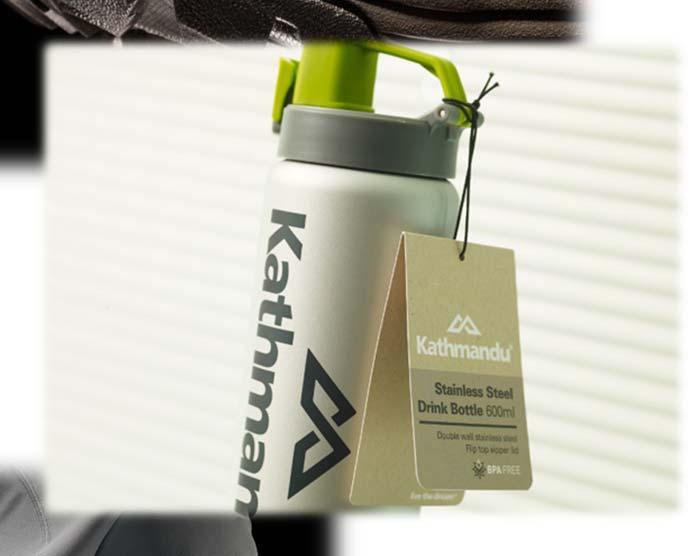

8 For personal use only Product Re-branding


9 For personal use only Website redevelopment including re-branding New Website Go-Live in 2012, enabled new branding to be incorporated in upgraded site

10 Kathmandu Re-Branding Store Development Strategy


11 Store Development and the Re-branding Opportunity
12 Application of new branding across our varying Store Environments Three examples 1. Flagship stores External signage application is more prominent due to sites being larger. Much more prominent use of brand Icon throughout store including sub category signage and fixture suite up scaled. Up scaled visual merchandising and large brand graphic application. 2. Mall and Small Formats External signage application is usually based on mall guidelines. Use of brand icon over counter only. Visual Merchandising reduced in scale & where possible brand graphics applied. 3. Outlet stores Outlet branding differs to any other format (colour and sub branding). Use of brand icon over counter only where possible. Fixtures scaled back to basics. Visual Merchandising is to a minimum.
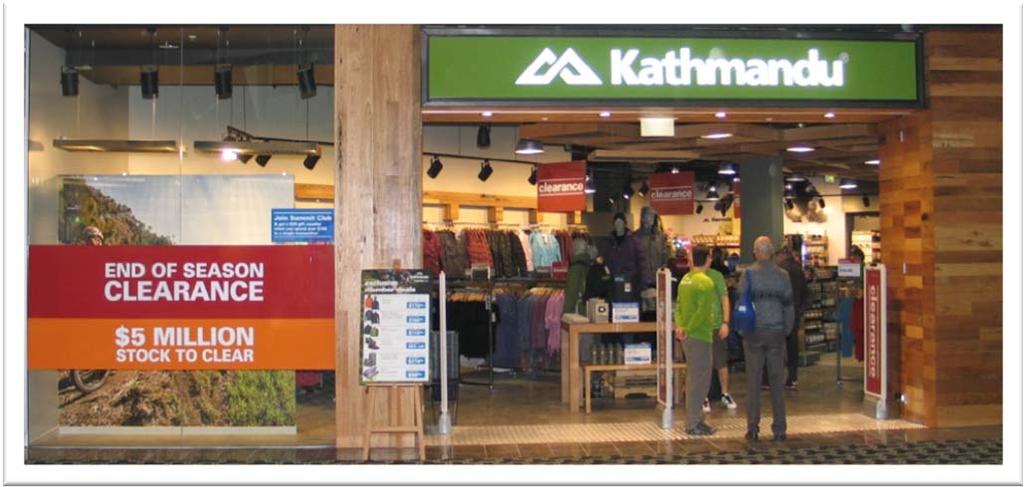
13 Flagship stores Broadway, Auckland External signage application is much more prominent, in tandem with choice of prime locations Camberwell, Melbourne Broadway, Auckland
14 Flagship stores More prominent use of brand icon through store including sub category signage. Fixture suite up scaled. Hay Street, Perth

15 Flagship stores Sub-category signage and Fixture suite up scaling


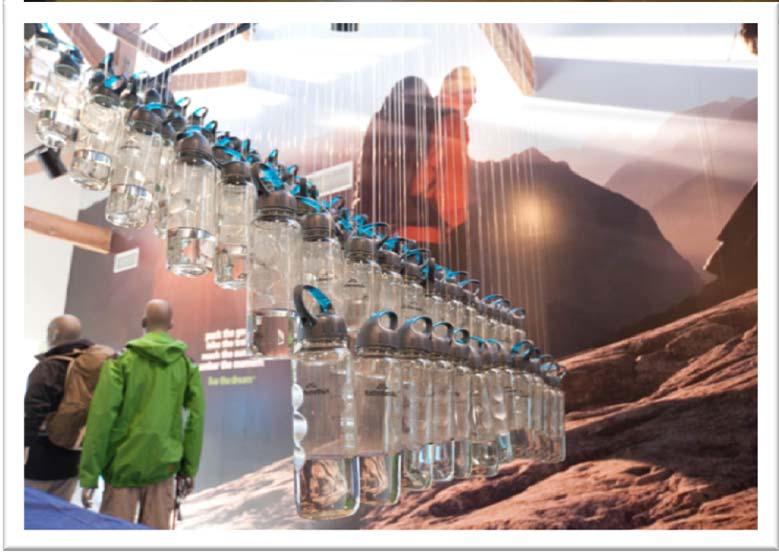

16 Flagship Stores Up scaled visual merchandising and large brand graphic application


17 Mall and Small Formats External signage application is usually based on mall guidelines.


18 Outlet Stores Outlet branding differs to any other format (colour and sub branding). Fixtures scaled back to basics. Visual Merchandising is to a minimum.

19 Store Roll Out status April 2013


20 Re-branding & Store Roll Out We have opened 40 new stores since the start of FY11. From end FY11 all new stores have been designed incorporating new brand identity. In same period we have refurbished or re-located a further 13 stores. Today 112 stores have the new branding, and by end of FY13 less than 10 stores will remain. Most remaining stores subject to assessment re lease renewal in next two years. Some re-branded stores especially those in major cities that are in top quartile of sales will be evaluated for full refurbishment in conjunction with lease renewal and annual capital expenditure programme. Capex on store rollout and refurbishment/ re-locations in excess of $15m per annum will continue through next 3 years at least.
21 Kathmandu Re-branding, the Overall Outcome Almost seamless transition as far as the customer concerned The updated branding is: Fresh - more contemporary, with greater impact and relevancy for consumers. Flexible works across multiple touch-points; on product, in stores and for marketing. Distinctive clearly differentiated from the competitor set. It has prompted: Fresh thinking across the business. A greater understanding of the essence of the brand. The potential: A brand that can compete globally.


22 Growth Strategies
23 Growth Strategies 5 key areas of opportunity and on-going investment: 1. Store rollout 170 store target for Australia / New Zealand, at least 3 years ahead. 2. Existing store network improvement A portion of existing portfolio to be re-aligned to our market and product positioning. 3. Online and digital Key to profitable expansion into international markets. 4. Enhanced product offering Focus on improved GMROI supported by improved systems in medium term. 5. Summit club Target of 1 million active members achievable by end 2015, and further potential to grow especially in Australia.


24 Summit Club growth strategy, further detail Target one million members. Currently on track to achieve target, with over 800,000 members. Increased 25% from same period last year. More than 50% of total sales are to our members. Membership has more than doubled in the past 4 years with average spend per member up. Australian target market penetration relative to New Zealand would be consistent with higher membership level.

25 Trading Update
26 Third Quarter Sales Total Group sales for the 13 weeks 28 January to 28 April $89.7m, up 12.5% on equivalent 13 week period in 2012 at constant exchange rates. Same store sales for the same period up 4.1% on 2012 at constant exchange rates. Sales through to end of March impacted by warm and dry autumn in both Australia and New Zealand, especially the latter. Last 4 weeks overall a return to more normal autumn weather patterns, strong end to our Easter sale promotion.
27 Full Year FY13 Outlook No change to commentary provided with our 1HFY13 result at end February. Winter sale in June/July is our largest promotional event each year, and weather is a key variable relevant to relative success of this sale. We remain confident of a strong performance for full year FY13.

28 Questions?